

Sea-level stands from the Western Mediterranean over the past 6.5 million years
- PMID: 33479271
- PMCID: PMC7820252
- DOI: 10.1038/s41598-020-80025-6
Sea-level stands from the Western Mediterranean over the past 6.5 million years
Erratum in
-
Author Correction: Sea-level stands from the Western Mediterranean over the past 6.5 million years.Sci Rep. 2021 Mar 17;11(1):6681. doi: 10.1038/s41598-021-85719-z. Sci Rep. 2021. PMID: 33731822 Free PMC article. No abstract available.
Abstract
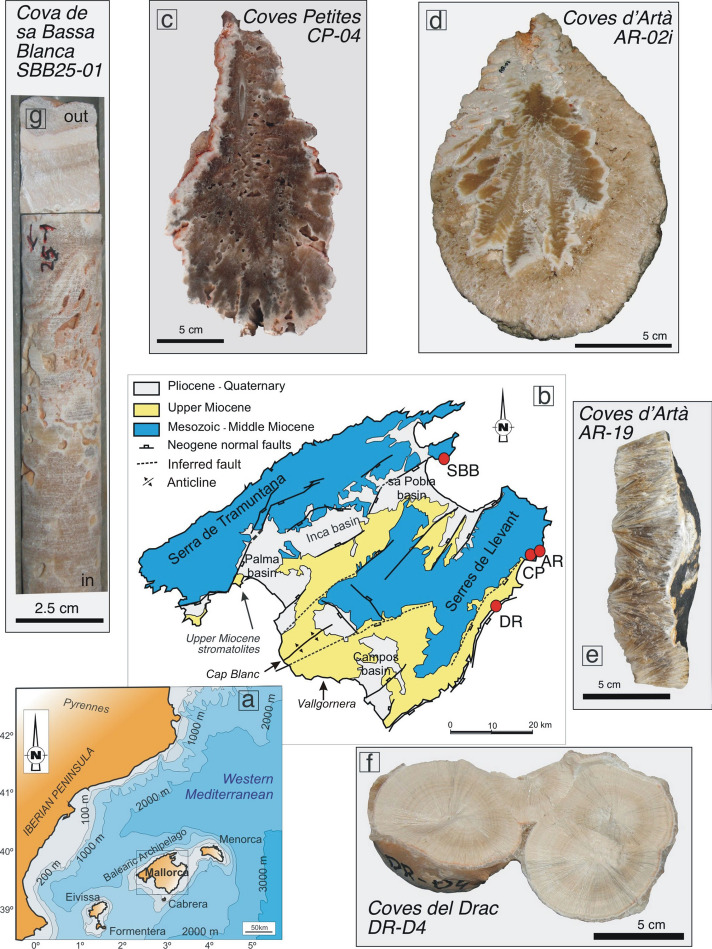
Sea-level reconstructions are important for understanding past ice sheet variability and its response to past and future warming. Here we present Neogene and Quaternary sea-level snapshots using phreatic overgrowths on speleothems (POS) from caves on Mallorca, Spain. POS are excellent sea level index points because of their clear relationship to sea level and precise U-Pb chronology. We find that local sea-level before and at the onset of the Messinian Salinity Crisis was at 33.3 ± 0.25 m (6.54 ± 0.37 Ma) and 31.8 ± 0.25 m (5.86 ± 0.60 Ma) above present levels, respectively. We further present global mean sea level (GMSL) estimates, i.e. local sea level corrected for glacial isostatic adjustment and long-term uplift, for three other POS. The results show that GMSL during the Pliocene-Pleistocene Transition was 6.4 m (- 2.0-8.8 m) at 2.63 ± 0.11 Ma and during the beginning and the end of the Mid-Pleistocene Transition was - 1.1 m (- 5.6-2.4 m) and 5 m (1.5-8.1 m), respectively. These estimates provide important constraints for the past evolution of sea level and show that local sea level prior to the MSC was similar to the highest stand during the Pliocene, with markedly lower position afterwards.
Conflict of interest statement
The authors declare no competing interests.
Figures


References
-
- Horton BP, et al. Mapping sea-level change in time, space, and probability. Annu. Rev. Environ. Resour. 2018;43:481–521. doi: 10.1146/annurev-environ-102017-025826. - DOI
-
- IPCC . Climate Change 2013: The Physical Science Basis. Contribution of Working Group I to the Fifth Assessment Report of the Intergovernmental Panel on Climate Change. Cambridge: Cambridge University Press; 2013.
-
- Fischer H, et al. Palaeoclimate constraints on the impact of 2 °C anthropogenic warming and beyond. Nat. Geosci. 2018;11:474–485. doi: 10.1038/s41561-018-0146-0. - DOI
Publication types
LinkOut - more resources
Full Text Sources
Other Literature Sources
Miscellaneous
