. 2021 Jan 21;11(1):1932.
doi: 10.1038/s41598-020-80563-z.

Further evidence supporting a potential role for ADH1B in obesity

Affiliations

Further evidence supporting a potential role for ADH1B in obesity

Liza D Morales et al. Sci Rep. .

Abstract

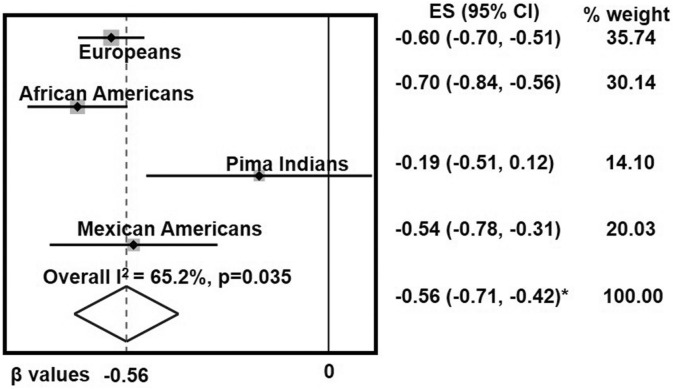
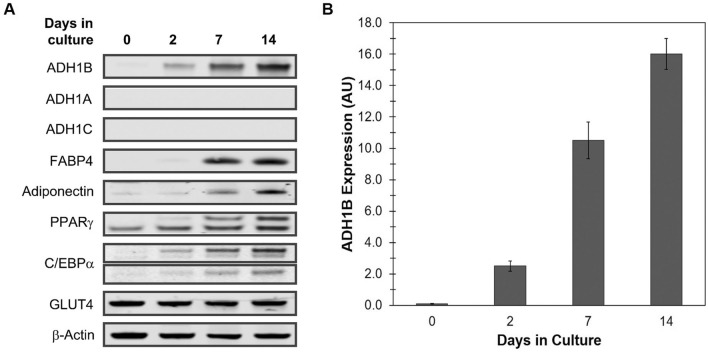
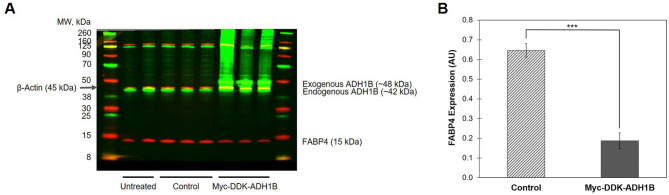
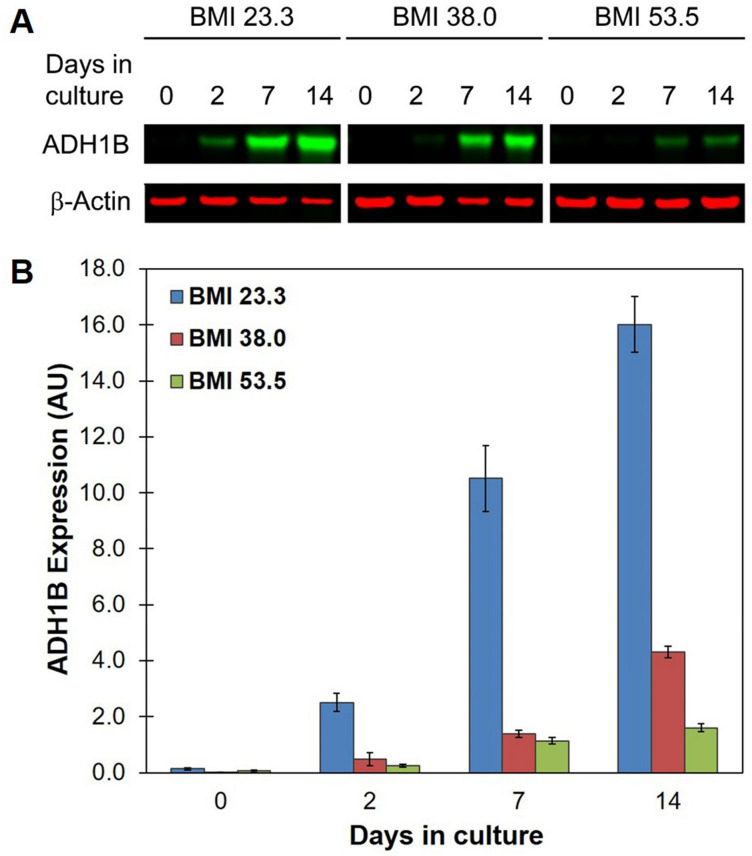
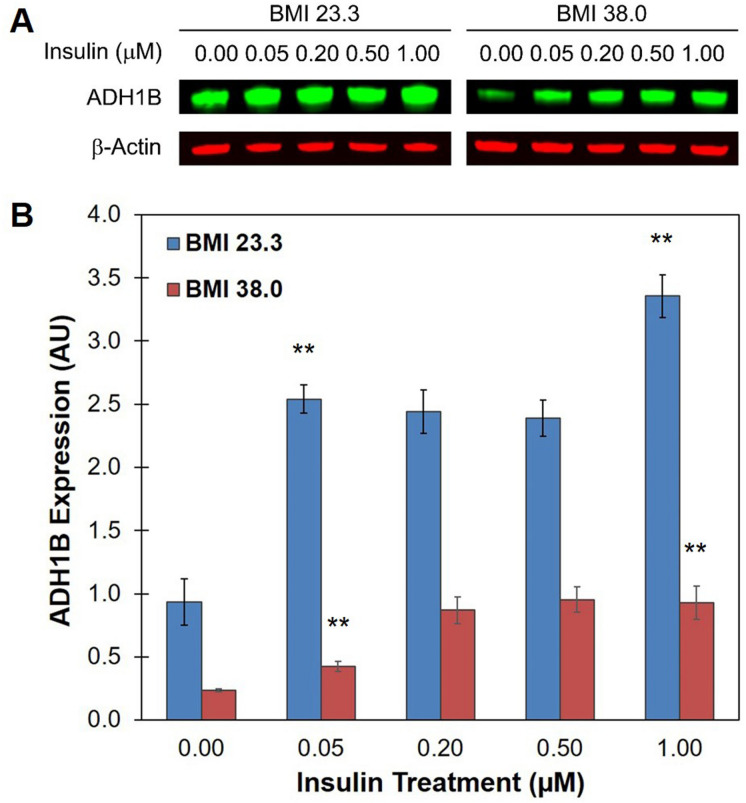
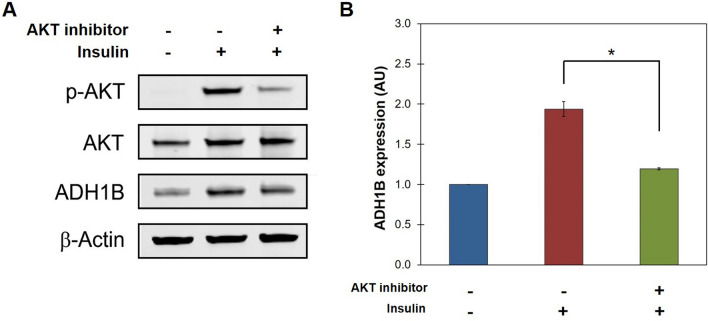
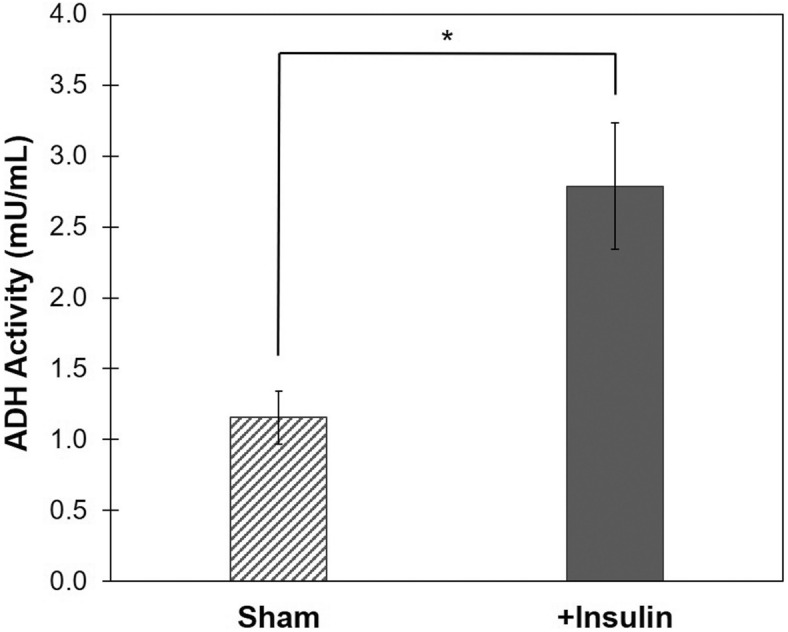
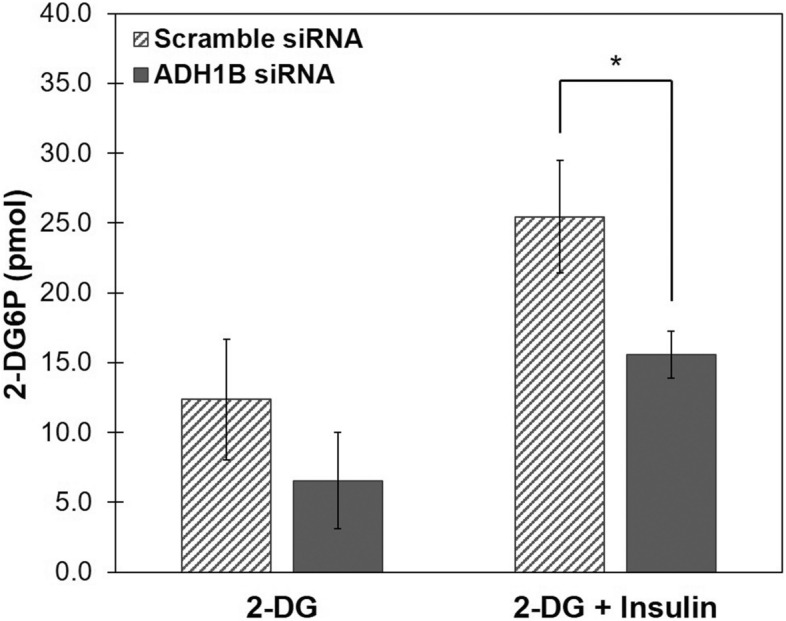
Insulin is an essential hormone that regulates glucose homeostasis and metabolism. Insulin resistance (IR) arises when tissues fail to respond to insulin, and it leads to serious health problems including Type 2 Diabetes (T2D). Obesity is a major contributor to the development of IR and T2D. We previously showed that gene expression of alcohol dehydrogenase 1B (ADH1B) was inversely correlated with obesity and IR in subcutaneous adipose tissue of Mexican Americans. In the current study, a meta-analysis of the relationship between ADH1B expression and BMI in Mexican Americans, African Americans, Europeans, and Pima Indians verified that BMI was increased with decreased ADH1B expression. Using established human subcutaneous pre-adipocyte cell lines derived from lean (BMI < 30 kg m-2) or obese (BMI ≥ 30 kg m-2) donors, we found that ADH1B protein expression increased substantially during differentiation, and overexpression of ADH1B inhibited fatty acid binding protein expression. Mature adipocytes from lean donors expressed ADH1B at higher levels than obese donors. Insulin further induced ADH1B protein expression as well as enzyme activity. Knockdown of ADH1B expression decreased insulin-stimulated glucose uptake. Our findings suggest that ADH1B is involved in the proper development and metabolic activity of adipose tissues and this function is suppressed by obesity.


Conflict of interest statement

The authors declare no competing interests.

Figures

Figure 1
Figure 1
Global relevance of the inverse association of ADH1B expression with obesity traits. Meta-analysis, using a random effects model, was performed to evaluate the relationship between adipose ADH1B mRNA expression and BMI in populations from four ethnic groups (Europeans, African Americans, Pima Indians, and Mexican Americans) as indicated. The data show point estimates and 95% confidence intervals for BMI β-values in each ethnic group. Gray squares represent weighted contributions from each study, and the diamond represents the overall summary statistic. For each standard deviation of decreased ADH1B expression, BMI was increased by 0.56 standard deviations, *P < 0.001.
Figure 2
Figure 2
Expression levels of ADH1 in differentiating human subcutaneous pre-adipocytes. (A) Representative composite image of immunoblot analysis. Total protein was isolated at the indicated time points during differentiation of human subcutaneous pre-adipocytes (Day 0) to cultured mature adipocytes (Day 14), resolved by SDS-PAGE, and immunoblotted with antibodies specific for the three ADH1 isoforms (ADH1A, ADH1B, ADH1C); the adipokines FABP4, adiponectin, PPARγ, and C/EBPα; and the adipose-specific glucose transporter GLUT4. β-Actin was used as a loading control. Full length blots are presented in Supplementary Figures S7 and S13. (B) Quantitative analysis of ADH1B protein expression. Western blot analysis was performed at least three times. Fluorescent signal intensity was quantified and normalized to β-Actin control. Data is presented as the mean ± s.e.m. AU, Arbitrary Units.
Figure 3
Figure 3
ADH1B regulates FABP4 expression during adipocyte differentiation. (A) Immunoblot analysis of cell lysates from adipocytes following differentiation and transduction with lentiviruses. Pre-adipocytes were transduced with lentivirus containing empty vector (Control) or vector encoding myc-DDK-tagged human ADH1B on Day 0 and Day 10 of differentiation in triplicate. Untreated pre-adipocytes were differentiated in duplicate and utilized as an additional control. Total protein was collected following complete differentiation, resolved by SDS-PAGE, and immunoblotted with antibodies specific for ADH1B, FABP4, and β-actin control. (B) Quantitative analysis of FABP4 expression in cells overexpressing ADH1B compared to empty vector control. Biological replicates were processed on the same Western blot. Fluorescence intensity was quantified and normalized to β-Actin control. Data is presented as the mean ± s.e.m. AU, Arbitrary Units; ***P = 0.0005.
Figure 4
Figure 4
ADH1B protein expression decreased with increasing BMI. (A) Representative composite immunoblot image of cell lysates from 3 pre-adipocyte cell lines derived from lean (BMI < 30 kg m−2) or obese (BMI ≥ 30 kg m−2) individuals during adipogenesis. Total protein was isolated at the indicated time points during differentiation, resolved by SDS-PAGE, and immunoblotted with antibodies specific for ADH1B and β-Actin loading control. Representative full-length blot is presented in Supplementary Figure S14. (B) Quantitative analysis of ADH1B expression. Western blot analysis was performed at least four times. Fluorescence intensity was quantified and normalized to β-Actin control. Data is presented as the mean ± s.e.m. AU, Arbitrary Units.
Figure 5
Figure 5
Insulin promotes expression of ADH1B in lean and obese adipocytes. (A) Representative composite immunoblot image of cell lysates from lean (BMI < 28 kg m−2) and obese (BMI ≥ 30 kg m−2) adipocytes following treatment with increasing doses of insulin. Cells were starved for 12 h and then treated with the indicated dose of insulin for 1 h. Total protein was isolated, resolved by SDS-PAGE, and immunoblotted with antibodies specific for ADH1B and β-Actin loading control. Full length blot is presented in Supplementary Figure S14. (B) Quantitative analysis of ADH1B expression. Western blot analysis was performed in quadruplicate. Fluorescence intensity was quantified and normalized to β-Actin control. Data is presented as the mean ± s.e.m. AU, Arbitrary Units; **P < 0.001.
Figure 6
Figure 6
AKT is involved in insulin-mediated ADH1B expression. (A) Representative composite image of ADH1B expression with ( +) and without (−) treatment with AKT inhibitor and/or insulin. Following differentiation, cultured adipocytes were starved for 12 h and then treated with 20 µM AKT1/2-specific inhibitor (+ AKT inhibitor) for 1 h prior to treatment with 1.0 µM insulin (+ Insulin) for 1 h. Non-treated cells (−Insulin, −AKT inhibitor) were utilized as control. Total protein was isolated, resolved by SDS-PAGE, and immunoblotted with antibodies specific for phosphorylated AKT (p-AKT) or total AKT and ADH1B. β-Actin was used as loading control. A representative full-length blot is presented in Supplementary Figure S16. (B) Quantitative analysis of ADH1B expression relative to non-treated control. Western blot analysis was performed in triplicate. Fluorescence intensity was quantified and normalized to β-Actin control. Data is presented as the mean ± s.e.m. AU, Arbitrary Units; *P < 0.01.
Figure 7
Figure 7
Insulin stimulates ADH1B enzymatic activity in adipocytes. Following differentiation, cultured adipocytes were starved for 12 h and treated with 1 µM insulin for 1 h (+ Insulin). Untreated cells were used as control (Sham). ADH activity was measured by a colorimetric assay (OD = 450 nm) that yields a proportional color change following ADH catalysis of isopropanol to produce NADH. ADH activity assay was performed in quadruplicate. Data is presented as the mean ± s.e.m. *P < 0.01.
Figure 8
Figure 8
Knockdown of ADH1B yields a decrease in insulin-stimulated glucose uptake within adipocytes. Knockdown of ADH1B was performed by transfection of differentiating pre-adipocytes with ADH1B-specific pooled siRNA or non-targeting (Scramble) control siRNA. Cultured adipocytes were starved for 12 h and then treated with 1 µM insulin (+ Insulin) to stimulate uptake of exogenous 2-deoxyglucose (2-DG) which is metabolized to 2-DG 6 phosphate (2-DG6P). Accumulated 2-DG6P was oxidized to generate a proportional amount of NADPH, yielding an oxidized product that was detected at OD = 412 nm. Data is presented as the mean ± s.e.m. *P < 0.05.

References

    1. US DHHS, CDC . Chronic Diseases and Their Risk factors: The Nation's Leading Causes of Death. Atlanta: US DHHS, CDC; 1999.
    1. Centers_for_Disease_Control_and_Prevention (U.S. Department of Health and Human Services, Centers for Disease Control and Prevention, Atlanta, 2011) http://www.cdc.gov/chronicdisease/resources/publications/aag/ddt.htm.
    1. Sanghera DK, Blackett PR. Type 2 diabetes genetics: Beyond GWAS. J. Diabetes Metab. 2012 doi: 10.4172/2155-6156.1000198. - DOI - PMC - PubMed
    1. DeFronzo RA. Insulin resistance: A multifaceted syndrome responsible for NIDDM, obesity, hypertension, dyslipidaemia and atherosclerosis. Neth. J. Med. 1997;50:191–197. doi: 10.1016/S0300-2977(97)00012-0. - DOI - PubMed
    1. DeFronzo R. Pathogenesis of type 2 diabetes: Metabolic and molecular implications of identifying diabetes genes. Diabetes Rev. 1997;5:177–269.

Publication types