. 2021 Jan 21;11(1):2047.
doi: 10.1038/s41598-021-81506-y.

Deep learning predicts postsurgical recurrence of hepatocellular carcinoma from digital histopathologic images

Affiliations

Deep learning predicts postsurgical recurrence of hepatocellular carcinoma from digital histopathologic images

Rikiya Yamashita et al. Sci Rep. .

Abstract

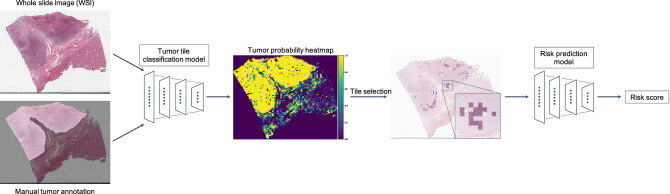
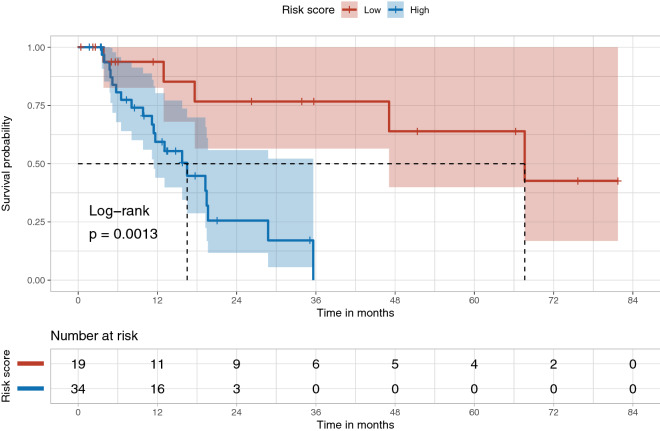
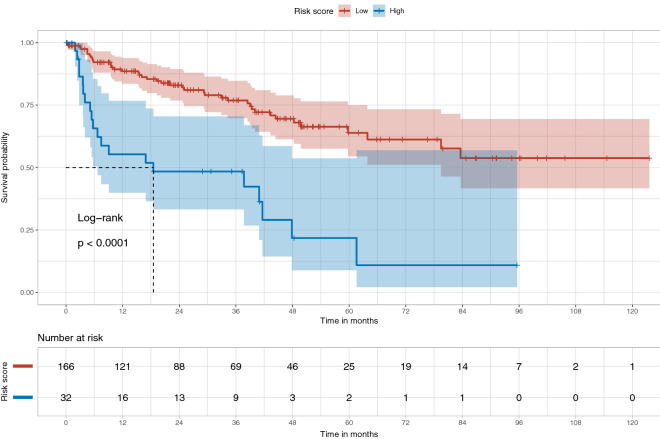
Recurrence risk stratification of patients undergoing primary surgical resection for hepatocellular carcinoma (HCC) is an area of active investigation, and several staging systems have been proposed to optimize treatment strategies. However, as many as 70% of patients still experience tumor recurrence at 5 years post-surgery. We developed and validated a deep learning-based system (HCC-SurvNet) that provides risk scores for disease recurrence after primary resection, directly from hematoxylin and eosin-stained digital whole-slide images of formalin-fixed, paraffin embedded liver resections. Our model achieved concordance indices of 0.724 and 0.683 on the internal and external test cohorts, respectively, exceeding the performance of the standard Tumor-Node-Metastasis classification system. The model's risk score stratified patients into low- and high-risk subgroups with statistically significant differences in their survival distributions, and was an independent risk factor for post-surgical recurrence in both test cohorts. Our results suggest that deep learning-based models can provide recurrence risk scores which may augment current patient stratification methods and help refine the clinical management of patients undergoing primary surgical resection for HCC.


Conflict of interest statement

The authors declare no competing interests.

Figures

Figure 1
Figure 1
Overview of HCC-SurvNet. All WSI were preprocessed by discarding non tissue-containing white background using thresholding, then partitioned into non-overlapping tiles of size 299 × 299 pixels and color normalized. A tumor tile classification model was developed using the Stanford-HCCDET dataset, which contained WSI with all tumor regions manually annotated. The tumor tile classification model was subsequently applied to each tissue-containing image tile in the TCGA-HCC (n = 360 WSI) and Stanford-HCC (n = 198 WSI) datasets for inference. The 100 tiles with the highest predicted probabilities of being tumor tiles were input into the downstream risk prediction model to yield tile-based risk scores, which were averaged to generate a WSI-level risk score for recurrence. WSI, whole-slide image.
Figure 2
Figure 2
Performance of the tumor tile classification model on the internal test set. The AUROC for tumor tile classification was 0.952 (95% CI 0.948, 0.957) on the internal test set (a). Model outputs differed significantly between tiles with a ground truth of tumor versus non-tumor (p value < 0.0001) (b). *The 95% CI for AUC is shown in parentheses in the ROC plot. **Error bars represent 95% CI in the bar chart. The p value was computed using the Wilcoxon rank sum test. AUC, area under the ROC curve; CI, confidence interval; ROC, receiver operating characteristic.
Figure 3
Figure 3
Performance of the tumor tile classification model on the external test set. The AUROC for tumor tile classification was 0.956 (95% CI 0.955, 0.958) on the external test set (a). Model outputs differed significantly between tiles with a ground truth of tumor versus non-tumor (p value < 0.0001) (b). *95% CI for AUC is shown in parentheses in the ROC plot. **Error bars represent 95% CI in the bar chart. The p value was computed using the Wilcoxon rank sum test. AUC, area under the ROC curve; CI, confidence interval; ROC, receiver operating characteristic.
Figure 4
Figure 4
Top 100 tiles selected by the tumor tile classification model. Spatial distribution of the top 100 tiles classified as being tumor tiles by the tumor tile classification model. The top row represents examples from the TCGA-HCC test dataset, and the bottom row represents examples from the Stanford-HCC dataset. The top 100 tiles were subsequently used for development of the survival prediction model. WSI, whole-slide image.
Figure 5
Figure 5
Kaplan–Meier plots for the high- and low-risk subgroups in the internal (TCGA-HCC) test set. The Kaplan–Meier plot shows the difference in the survival distributions for the low- and high-risk subgroups, stratified based on the risk scores predicted by HCC-SurvNet on the internal test set (log-rank p value = 0.0013).
Figure 6
Figure 6
Kaplan–Meier plots for the high- and low-risk subgroups in the external (Stanford-HCC) test set. The Kaplan–Meier plot shows the difference in the survival distributions for the low- and high-risk subgroups, stratified based on the risk scores predicted by HCC-SurvNet on the external test set (log-rank p value < 0.0001).

References

    1. Yang JD, et al. A global view of hepatocellular carcinoma: trends, risk, prevention and management. Nat. Rev. Gastroenterol. Hepatol. 2019;16:589–604. doi: 10.1038/s41575-019-0186-y. - DOI - PMC - PubMed
    1. Forner A, Reig M, Bruix J. Hepatocellular carcinoma. Lancet. 2018;391:1301–1314. doi: 10.1016/S0140-6736(18)30010-2. - DOI - PubMed
    1. Brierley J, Gospodarowicz MK, Wittekind C, editors. Liver in TNM Classification of Malignant Tumours. New York: Wiley; 2017. pp. 80–84.
    1. Forner A, Reig ME, de Lope CR, Bruix J. Current strategy for staging and treatment: the BCLC update and future prospects. Semin. Liver Dis. 2010;30:61–74. doi: 10.1055/s-0030-1247133. - DOI - PubMed
    1. Villanueva A. Hepatocellular carcinoma. N. Engl. J. Med. 2019;380:1450–1462. doi: 10.1056/NEJMra1713263. - DOI - PubMed

Publication types

MeSH terms