Comparative Study
. 2021 Jan 21;11(1):1955.
doi: 10.1038/s41598-021-81371-9.

Comparative neuroanatomy of the lumbosacral spinal cord of the rat, cat, pig, monkey, and human

Affiliations
Comparative Study

Comparative neuroanatomy of the lumbosacral spinal cord of the rat, cat, pig, monkey, and human

Amirali Toossi et al. Sci Rep. .

Abstract

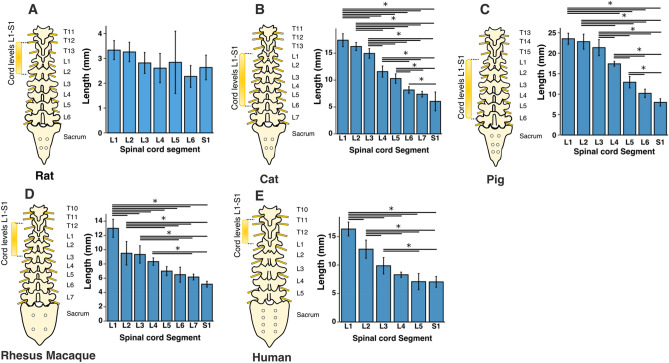
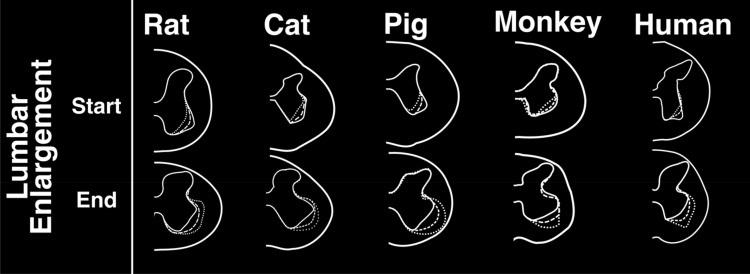
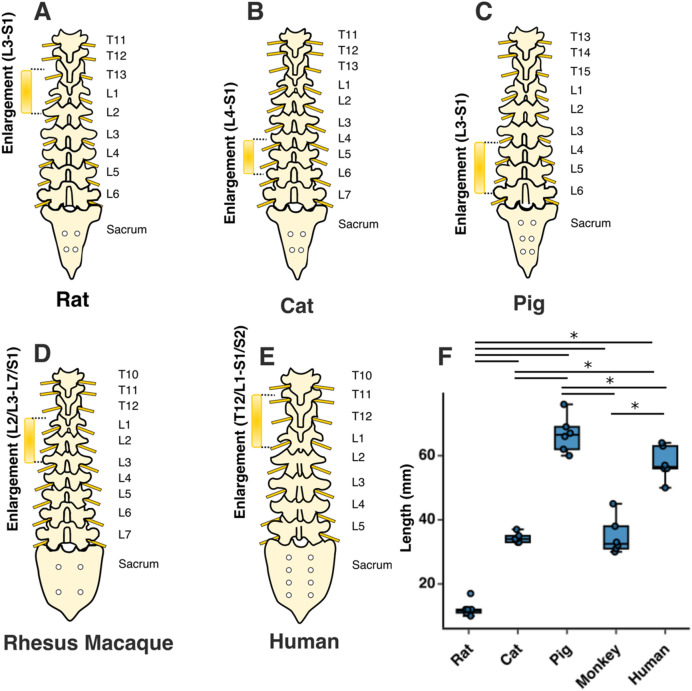
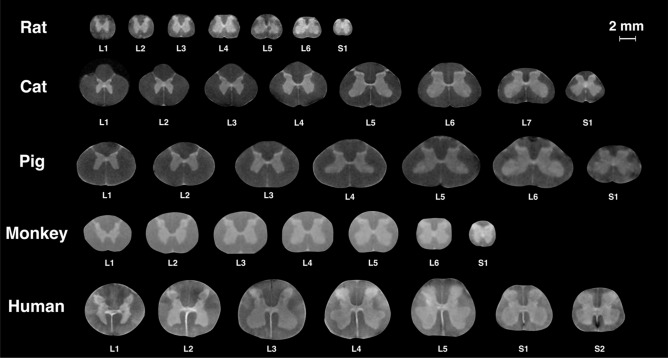
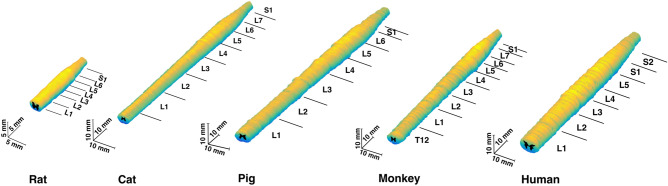
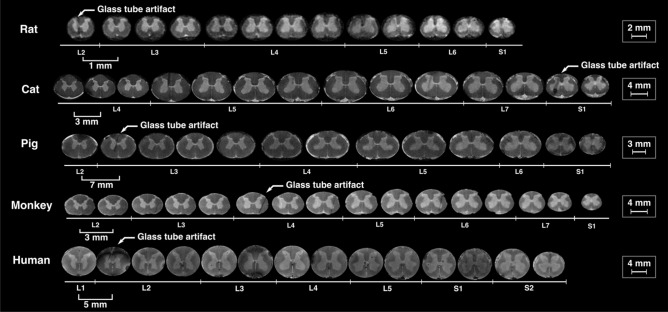
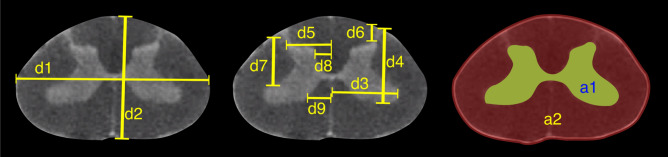
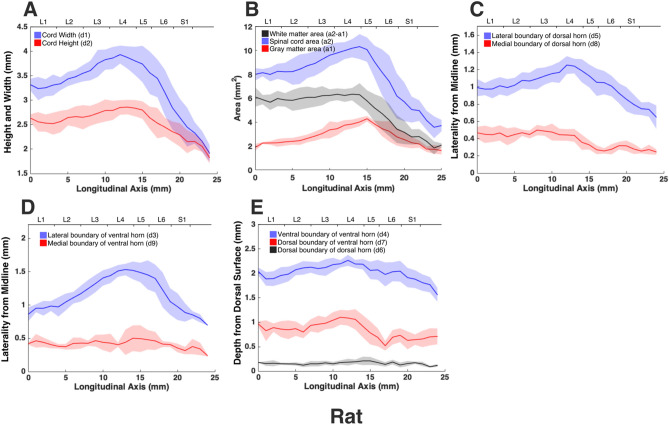
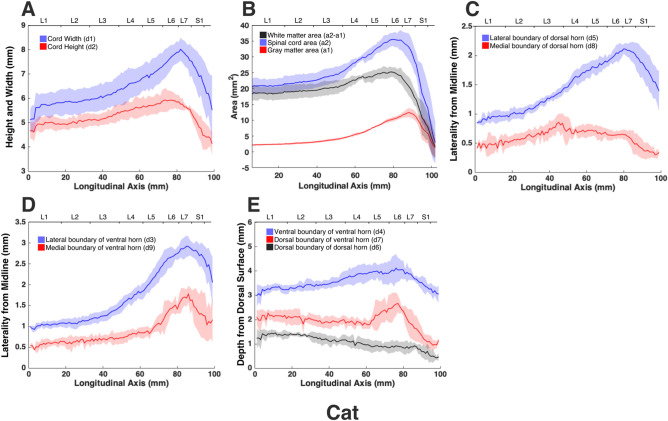
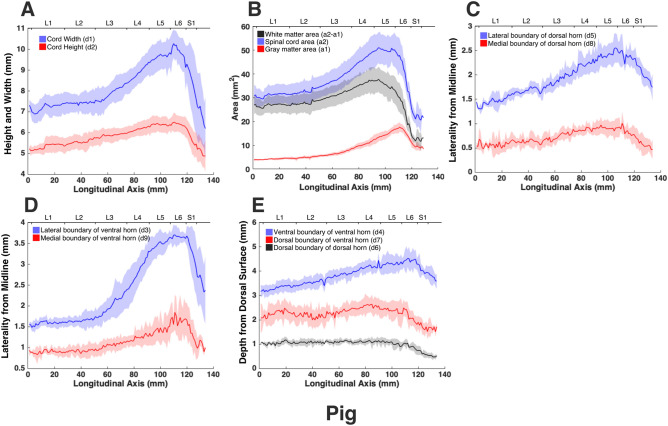
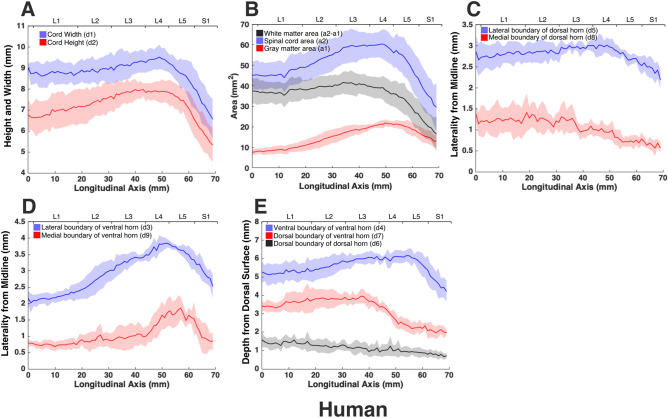
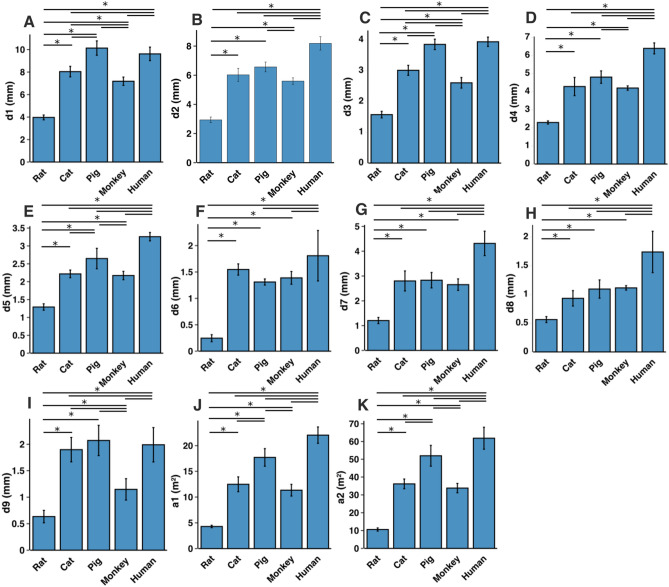
The overall goal of this work was to create a high-resolution MRI atlas of the lumbosacral enlargement of the spinal cord of the rat (Sprague-Dawley), cat, domestic pig, rhesus monkey, and human. These species were chosen because they are commonly used in basic and translational research in spinal cord injuries and diseases. Six spinal cord specimens from each of the studied species (total of 30 specimens) were fixed, extracted, and imaged. Sizes of the spinal cord segments, cross-sectional dimensions, and locations of the spinal cord gray and white matter were quantified and compared across species. The lumbar enlargement spans spinal cord levels L3-S1 in rats, L4-S1 in cats, L3-S1 in pigs, L2/L3-L7/S1 in monkeys, and T12/L1-S1/S2 in humans. The enlargements in pigs and humans are largest and most similar in size (length and cross-sectional area); followed by monkeys and cats; and followed by rats. The obtained atlas establishes a neuroanatomical reference for the intact lumbosacral spinal cord in these species. It can also be used to guide the planning of surgical procedures of the spinal cord and technology design and development of spinal cord neuroprostheses, as well as precise delivery of cells/drugs into target regions within the spinal cord parenchyma.


Conflict of interest statement

The authors declare no competing interests.

Figures

Figure 1
Figure 1
Segmental length of the spinal cord levels L1-S1. Bars represent the mean and the error bars show the standard deviation of the mean. * represents p < 0.05.
Figure 2
Figure 2
Characteristic morphological changes of the gray matter of the spinal cord at the rostral and caudal boundaries of the lumbosacral enlargement. These morphological changes were described by Vanderhorst and Holstege and Gross et al. Cross-sectional shapes illustrated here were derived from representative MRI images in each species. Dotted, dashed and solid traces show morphological changes of the gray matter moving from rostral to caudal direction, respectively.
Figure 3
Figure 3
Rostrocaudal extent and location of the lumbosacral enlargement in various species. The typical segmental levels of the lumbosacral enlargement were: L3-S1 for rats, L4-S1 for cats, L3-S1 for pigs, L2/L3-L7/S1 for rhesus macaque, and T12/L1-S1/S2 for humans. Levels for enlargement (in brackets) are spinal cord segments; the levels on the right side of the spinal column indicate the vertebral levels. Boxes represent interquartile range; horizontal line shows the median; whiskers represent minimum and maximum values of the dataset. ‘*’ symbol represents p < 0.05. Solid dots show individual data points.
Figure 4
Figure 4
MR images of spinal cord segments L1-S1 (T2*-weighted). Images of the spinal cords of rats, cats, pigs, and humans were acquired using a 4.7 T scanner. Images of the spinal cords of monkeys were acquired using a 3 T scanner. Each cross-sectional image is taken from the middle of the corresponding spinal cord segment.
Figure 5
Figure 5
3D model of the lumbosacral spinal cords of the rat, cat, pig, monkey, and human. 3D models were reconstructed based on the acquired MRIs from a representative animal (n = 1) per species. Annotations show the segments of the spinal cord identified using the method shown in Fig. S7.
Figure 6
Figure 6
Sequential cross sections (T2*-weighted MRIs) from the lumbosacral enlargement of the spinal cords of rat, cat, pig, monkey, and human, spaced apart by 1, 3, 7, 3 and 5 mm, respectively. Scale bars for each species are shown on the right. The artifacts (arrows) are the locations of the glass markers. Images of the spinal cords of rats, cats, pigs, and humans were acquired using a 4.7 T scanner. Images of the spinal cords of monkeys were acquired using a 3 T scanner.
Figure 7
Figure 7
MRI-based morphometric measurements of the lumbosacral spinal cords of rat, cat, pig, monkey, and human. d1 and d2 represent the width and height of the spinal cord, respectively. d3 and d9 are the mediolateral distances from the midline to the lateral and medial boundaries of the ventral horn. Similarly, d5 and d8 are the mediolateral distances from the midline to the lateral and medial boundaries of the dorsal horn. d7 and d4 are the depth of the dorsal and ventral boundaries of the ventral horn from the spinal cord surface. d6 is the depth of the dorsal boundary of the dorsal horn. a2 and a1 represent the cross-sectional areas of the spinal cord and the gray matter, respectively.
Figure 8
Figure 8
Measurements of cross-sectional dimensions of the spinal cord and locations of the ventral and dorsal horns of rat spinal cord. Presented data are based on n = 6 specimens. Solid lines represent the mean and the shaded regions represent the mean ± standard deviation. (A) Spinal cord width and height (d1 and d2, respectively in Fig. 7, left) across the lumbosacral cord. (B) Cross-sectional areas of the spinal cord and gray matter (a1, a2 in Fig. 7, right) across the lumbosacral cord. (C) Lateral distances from midline of dorsal horn boundaries (d5, d8 in Fig. 7, middle). (D) Lateral distances from midline of ventral horn boundaries (d3, d9 in Fig. 7, middle). (E) Depth from the dorsal surface of the spinal cord of the ventral and dorsal horn boundaries (d4, d7, d6, in Fig. 7, middle).
Figure 9
Figure 9
Measurements of cross-sectional dimensions of the spinal cord and locations of the ventral and dorsal horns of cat spinal cord. Presented data are based on n = 6 specimens. Solid lines represent the mean and the shaded regions represent the mean ± standard deviation. (A) Spinal cord width and height (d1 and d2, respectively in Fig. 7, left) across the lumbosacral cord. (B) Cross-sectional areas of the spinal cord and gray matter (a1, a2 in Fig. 7, right) across the lumbosacral cord. (C) Mediolateral distances from midline to the dorsal horn boundaries (d5, d8 in Fig. 7, middle). (D) Mediolateral distances from midline to the ventral horn boundaries (d3, d9 in Fig. 7, middle). (E) Depth from the dorsal surface of the spinal cord of the ventral and dorsal horn boundaries (d4, d7, d6, in Fig. 7, middle).
Figure 10
Figure 10
Measurements of cross-sectional dimensions of the spinal cord and locations of the ventral and dorsal horns of pig spinal cord. Presented data are based on n = 6 specimens. Solid lines represent the mean and the shaded regions represent the mean ± standard deviation. (A) Spinal cord width and height (d1 and d2, respectively in Fig. 7, left) across the lumbosacral cord. (B) Cross-sectional areas of the spinal cord and gray matter (a1, a2 in Fig. 7, right) across the lumbosacral cord. (C) Mediolateral distances from midline to the dorsal horn boundaries (d5, d8 in Fig. 7, middle). (D) Mediolateral distances from midline to the ventral horn boundaries (d3, d9 in Fig. 7, middle). (E) Depth from the dorsal surface of the spinal cord of the ventral and dorsal horn boundaries (d4, d7, d6, in Fig. 7, middle).
Figure 11
Figure 11
Measurements of cross-sectional dimensions of the spinal cord and locations of the ventral and dorsal horns of monkey spinal cord. Presented data are based on n = 6 specimens. Solid lines represent the mean and the shaded regions represent the mean ± standard deviation. (A) Spinal cord width and height (d1 and d2, respectively in Fig. 7, left) across the lumbosacral cord. (B) Cross-sectional areas of the spinal cord and gray matter (a1, a2 in Fig. 7, right) across the lumbosacral cord. (C) Mediolateral distances from midline to the dorsal horn boundaries (d5, d8 in Fig. 7, middle). (D) Mediolateral distances from midline to the ventral horn boundaries (d3, d9 in Fig. 7, middle). (E) Depth from the dorsal surface of the spinal cord of the ventral and dorsal horn boundaries (d4, d7, d6, in Fig. 7, middle).
Figure 12
Figure 12
Measurements of cross-sectional dimensions of the spinal cord and locations of the ventral and dorsal horns of human spinal cord. Presented data are based on n = 6 specimens. Solid lines represent the mean and the shaded regions represent the mean ± standard deviation. (A) Spinal cord width and height (d1 and d2, respectively in Fig. 7, left) across the lumbosacral cord. (B) Cross-sectional areas of the spinal cord and gray matter (a1, a2 in Fig. 7, right) across the lumbosacral cord. (C) Mediolateral distances from midline to the dorsal horn boundaries (d5, d8 in Fig. 7, middle). (D) Mediolateral distances from midline to the ventral horn boundaries (d3, d9 in Fig. 7, middle). (E) Depth from the dorsal surface of the spinal cord of the ventral and dorsal horn boundaries (d4, d7, d6, in Fig. 7, middle).
Figure 13
Figure 13
Comparison of the spinal cord dimensions and the locations of the dorsal and ventral horns in the spinal cords of rats, cats, pigs, monkeys, and humans. Graphs show the comparison of the values for each parameter at the Peak Cord Size (PCS) across species. Bars represent the mean and the error bars show the standard deviation of the mean. Parameters are those shown in Fig. 7 (A) d1. (B) d2. (C) d3. (D) d4. (E) d5. (F) d6. (G) d7. (H) d8. (I) d9. (J) a1. (K) a2.

References

    1. Silva NA, Sousa N, Reis RL, Salgado AJ. From basics to clinical: A comprehensive review on spinal cord injury. Prog. Neurobiol. 2014;114:25–57. doi: 10.1016/j.pneurobio.2013.11.002. - DOI - PubMed
    1. Kolb SJ, Kissel JT. Spinal muscular atrophy. Neurol. Clin. 2015;33:831–846. doi: 10.1016/j.ncl.2015.07.004. - DOI - PMC - PubMed
    1. Hardiman O, et al. Amyotrophic lateral sclerosis. Nat. Rev. Dis. Primers. 2017;3:1–19. - PubMed
    1. WHO | Spinal cord injury: as many as 500 000 people suffer each year. WHOhttp://www.who.int/mediacentre/news/releases/2013/spinal-cord-injury-201... (2019).
    1. Mehta P. Prevalence of amyotrophic lateral sclerosis—United States, 2014. MMWR Morb. Mortal Wkly. Rep. 2018;67:216. doi: 10.15585/mmwr.mm6707a3. - DOI - PMC - PubMed

Publication types