. 2021 Jan 21;11(1):2031.
doi: 10.1038/s41598-021-81466-3.

Thermoelectricity of near-resonant tunnel junctions and their relation to Carnot efficiency

Affiliations

Thermoelectricity of near-resonant tunnel junctions and their relation to Carnot efficiency

Matthias A Popp et al. Sci Rep. .

Abstract

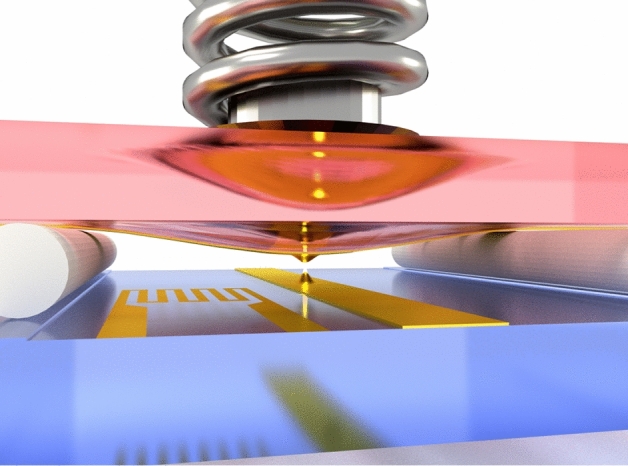
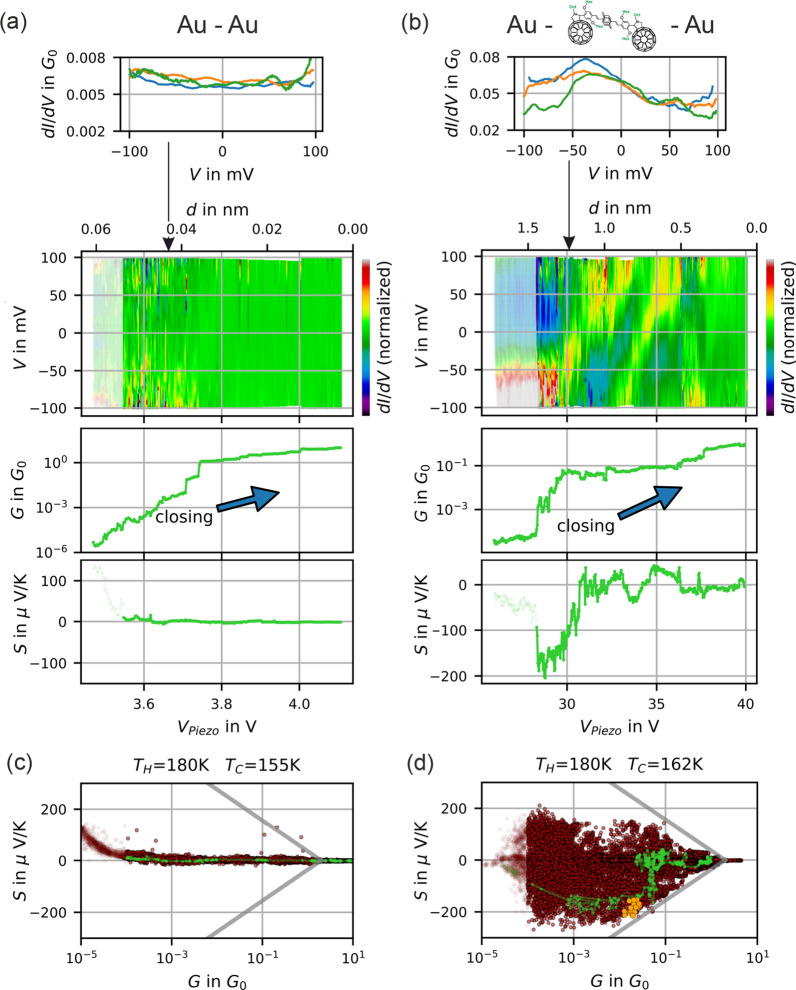
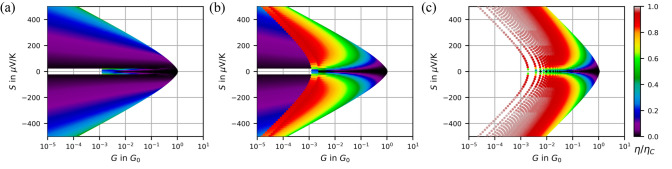
We present a conceptual study motivated by electrical and thermoelectrical measurements on various near-resonant tunnel junctions. The squeezable nano junction technique allows the quasi-synchronous measurement of conductance G, I(V) characteristics and Seebeck coefficient S. Correlations between G and S are uncovered, in particular boundaries for S(G). We find the simplest and consistent description of the observed phenomena in the framework of the single level resonant tunneling model within which measuring I(V) and S suffice for determining all model parameters. We can further employ the model for assigning thermoelectric efficiencies [Formula: see text] without measuring the heat flow. Within the ensemble of thermoelectric data, junctions with assigned [Formula: see text] close to the Carnot limit can be identified. These insights allow providing design rules for optimized thermoelectric efficiency in nanoscale junctions.


Conflict of interest statement

The authors declare no competing interests.

Figures

Figure 1
Figure 1
Scheme of the squeezable nanojunction (SNJ). Two SiC chips with electrodes are placed in a sandwich configuration. The ultra-stable distance between the electrodes is adjusted via a piezo-spring mechanism. Chip temperatures TH and TC are monitored via on-chip resistance thermometry.
Figure 2
Figure 2
Electric and thermoelectric characterization. (a, b) Show example dI/dV curves, shape evolution of dI/dV (color coded, every dI/dV is normalized to it’s mean value), conductances G and Seebeck coefficients S measured during mechanical variation of the junction’s distance (here: closing). (a) A bare gold-gold junction and (b) a junction with fullerene end-capped molecules, (SI) applied to the electrodes. (c, d) Show correlations of S and G using the data of the whole ensembles enclosing 21 (27) opening and closing cycles with a total of 14431 (25519) dI/dV and S measurements. Green dots correspond to the data in (a, b). Orange dots mark a sub-ensemble with high conversion efficiency. Gray lines are eye guides which separate G-S pairs from exclusion areas.
Figure 3
Figure 3
Conductance and Seebeck coefficient in the resonant level model. (a) Seebeck coefficients and conductances calculated within the resonant level model. The trajectories a-j are curves of constant Γ, varied logarithmically from Γ=10kBT to Γ=3·10-3kBT. Within each trajectory the position of the energy level E0 was varied in equidistant steps indicated by the color scale. The gray lines are the very same eye guides as in Fig. 2 which mark the boundaries to the excluded area. (b) Transmission functions τ(E) along the trajectory with Γ=1.1·10-1kBT. The labels 1–7 correspond to the labels in (a).
Figure 4
Figure 4
Heat conversion efficiency η of the electronic system calculated with respect to Carnot-efficiency ηC. (a, b) are calculated within the resonant level model. In (a) the off-resonant regime is in the foreground whereas in (b) the near-resonant regime is visible. (c) rectangular transmission function for comparison. Note that here also the excluded area differs.
Figure 5
Figure 5
Efficiencies with optimized transmission functions. (a) Optimal values of the thermoelectric conversion efficiency for rectangular and Lorentz shaped transmission functions, plotted as a function of Gth,loss. (b) The underlying optimized transmission functions.This plot is temperature invariant when choosing units of kBT and the (electrical) thermal conductance quantum Gth,0=2π2kB2T3h (left and lower scale). The right and upper scale denominate values at room temperature (T = 300K).

References

    1. Franz R, Wiedemann G. Ueber die Wärme-Leitungsfähigkeit der Metalle. Ann. Phys. Chem. 1853;165:497–531. doi: 10.1002/andp.18531650802. - DOI
    1. Cui L, et al. Quantized thermal transport in single-atom junctions. Science. 2017;10:1126. doi: 10.1126/science.aam6622. - DOI - PubMed
    1. Mahan GD, Sofo JO. The best thermoelectric. Proc. Natl. Acad. Sci. USA. 1996;93:7436–9. doi: 10.1073/PNAS.93.15.7436. - DOI - PMC - PubMed
    1. Whitney RS. Most efficient quantum thermoelectric at finite power output. Phys. Rev. Lett. 2014;112:1–5. doi: 10.1103/PhysRevLett.112.130601. - DOI - PubMed
    1. Buttiker M. Oherent and sequential tunneling in series barriers. IBM J. Res. Dev. 1988;32:63–75. doi: 10.1147/rd.321.0063. - DOI

LinkOut - more resources