. 2021 Feb;28(2):190-201.
doi: 10.1038/s41594-020-00550-w. Epub 2021 Jan 21.

Biomolecular condensation of NUP98 fusion proteins drives leukemogenic gene expression

Affiliations

Biomolecular condensation of NUP98 fusion proteins drives leukemogenic gene expression

Stefan Terlecki-Zaniewicz et al. Nat Struct Mol Biol. 2021 Feb.

Abstract

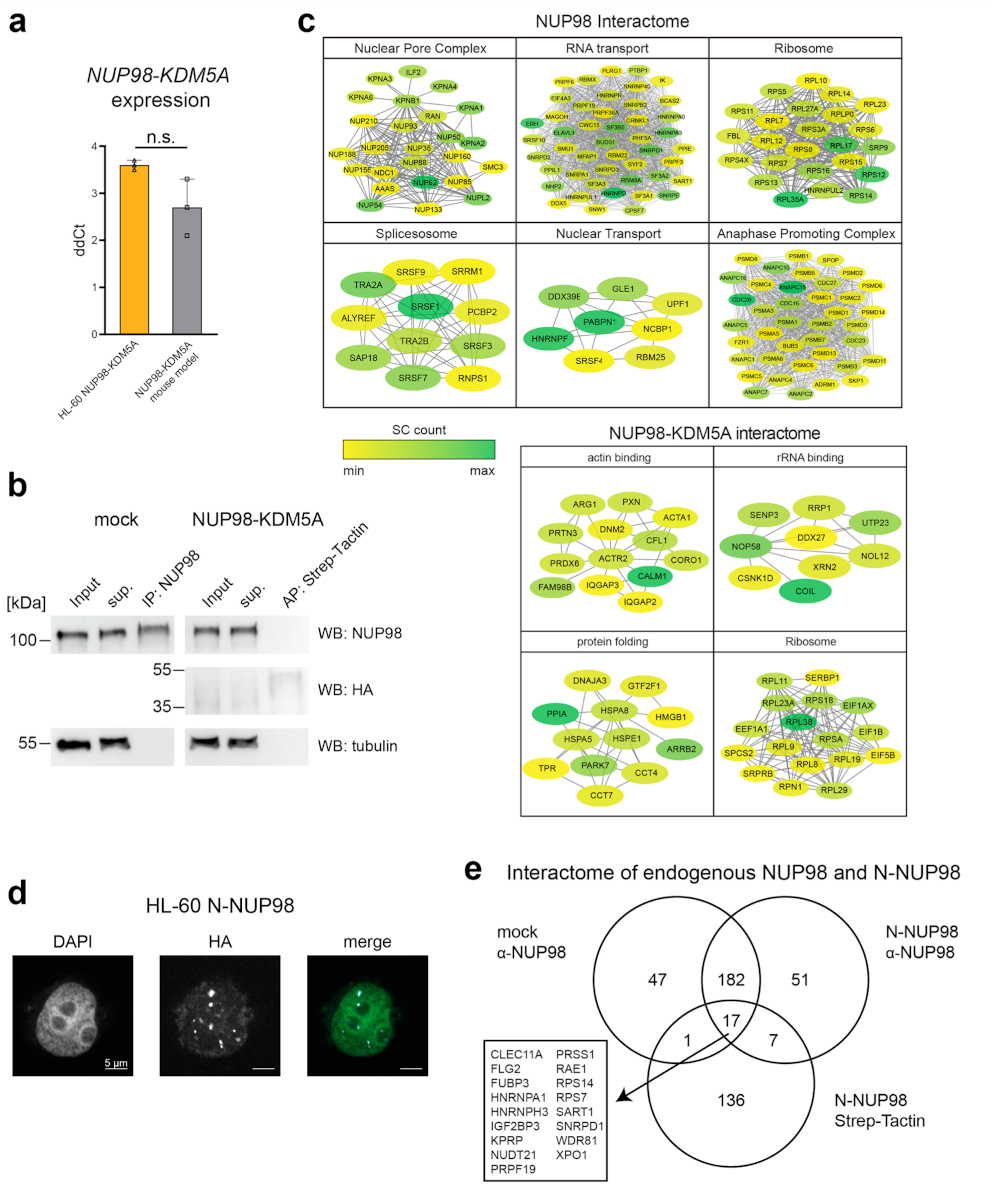
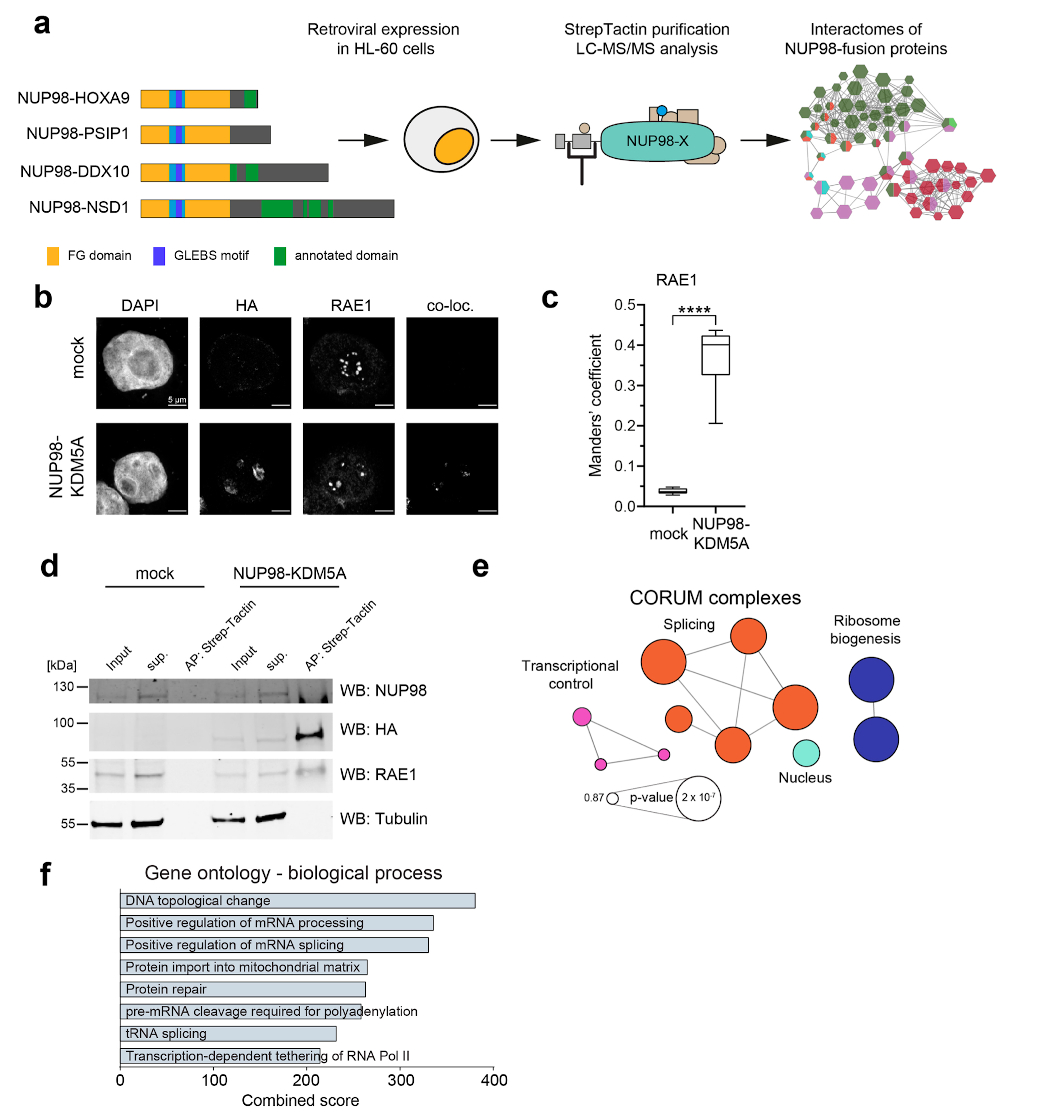
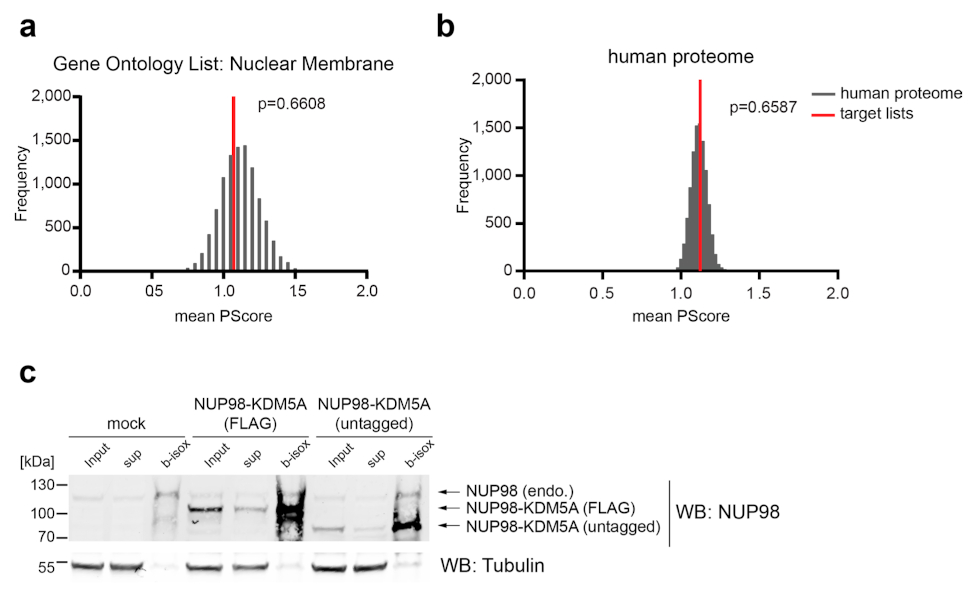
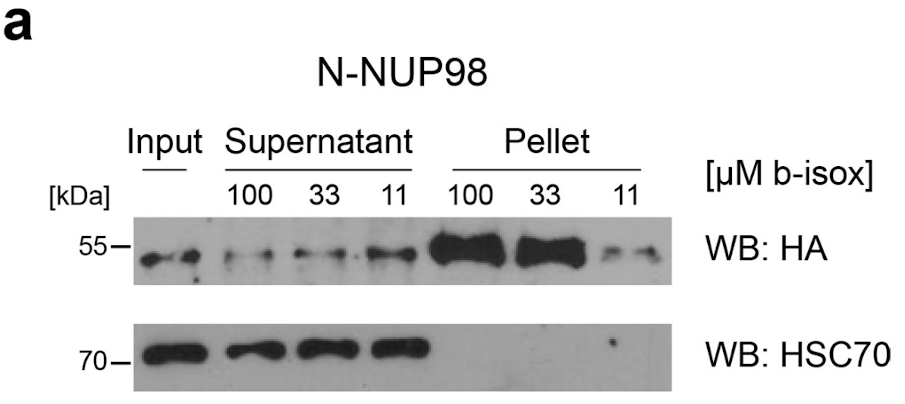
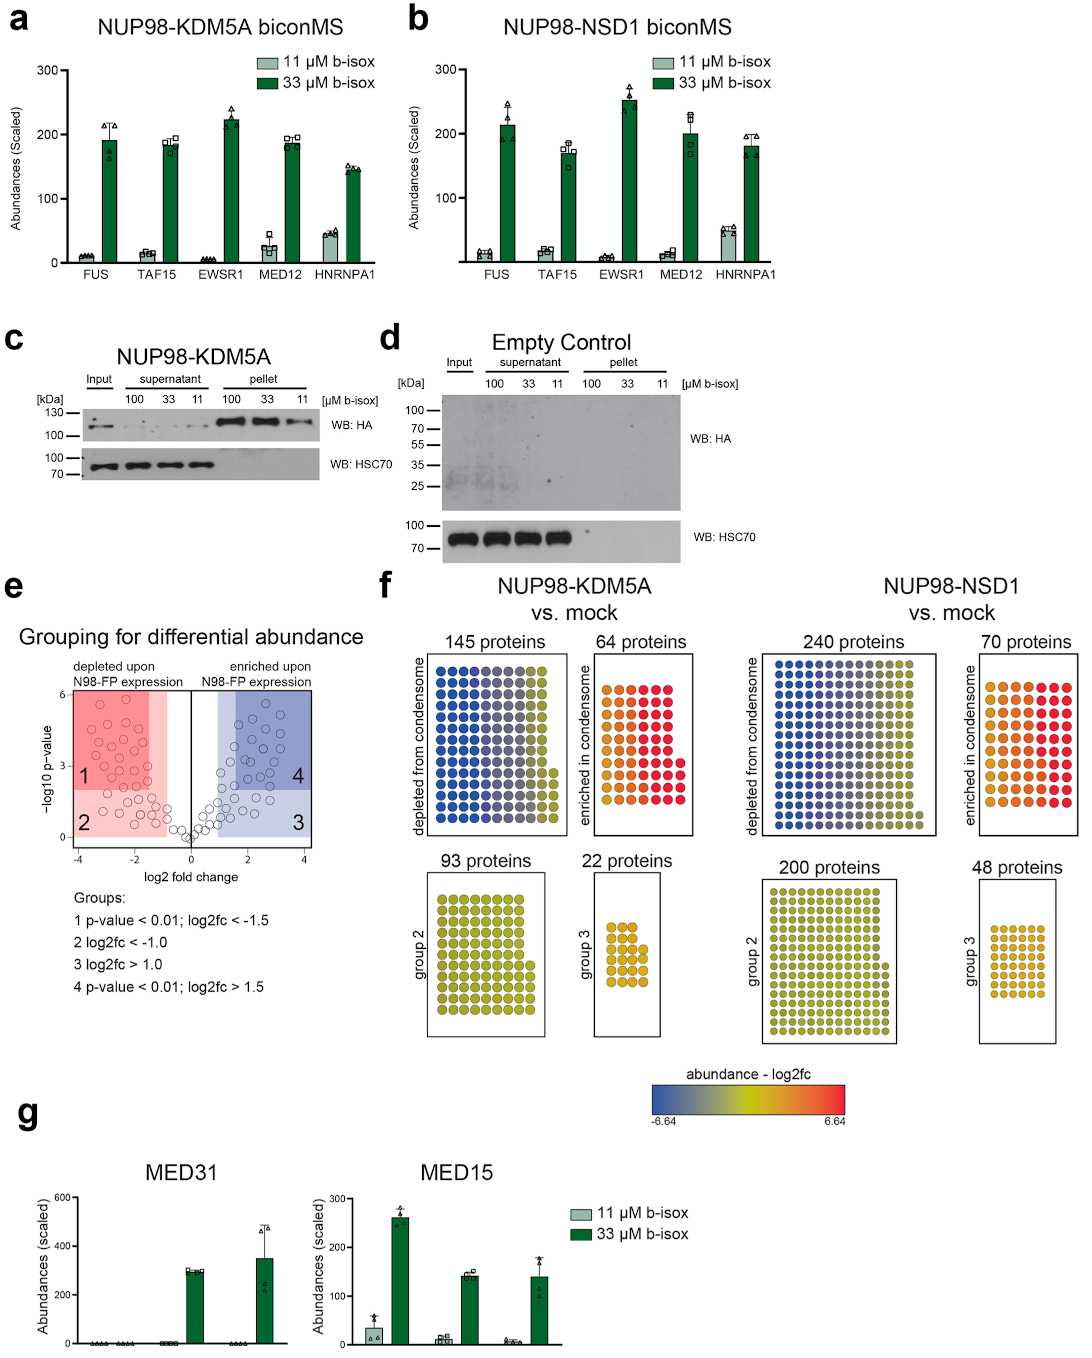
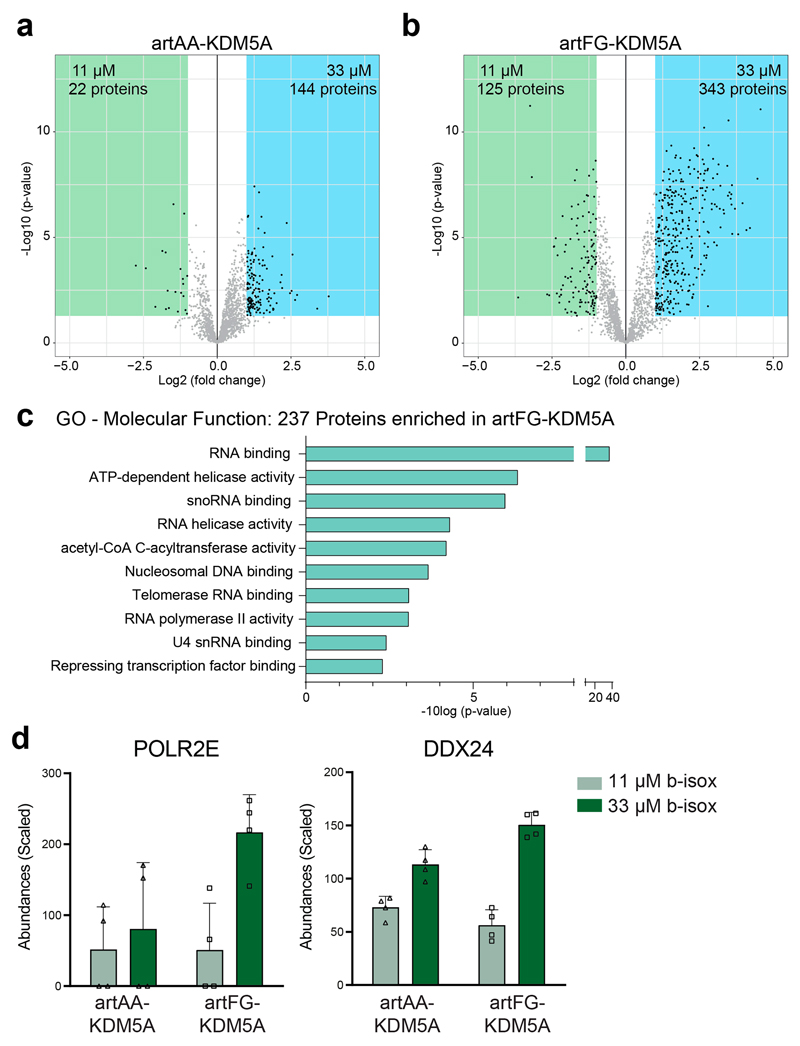
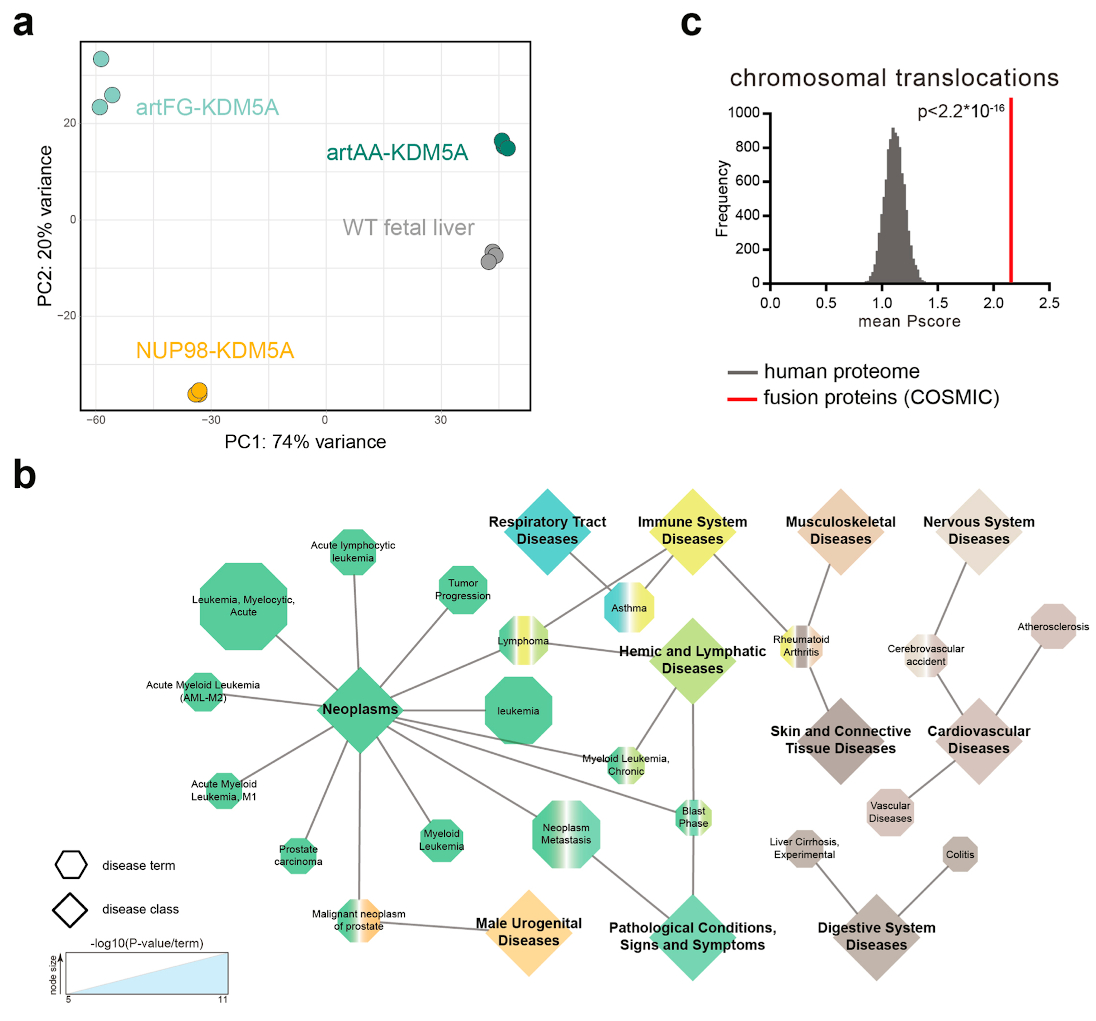
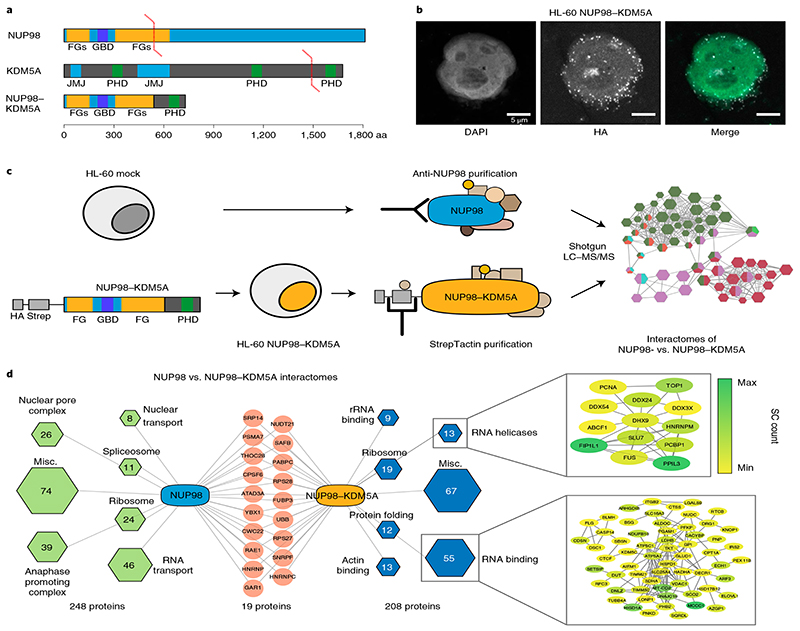
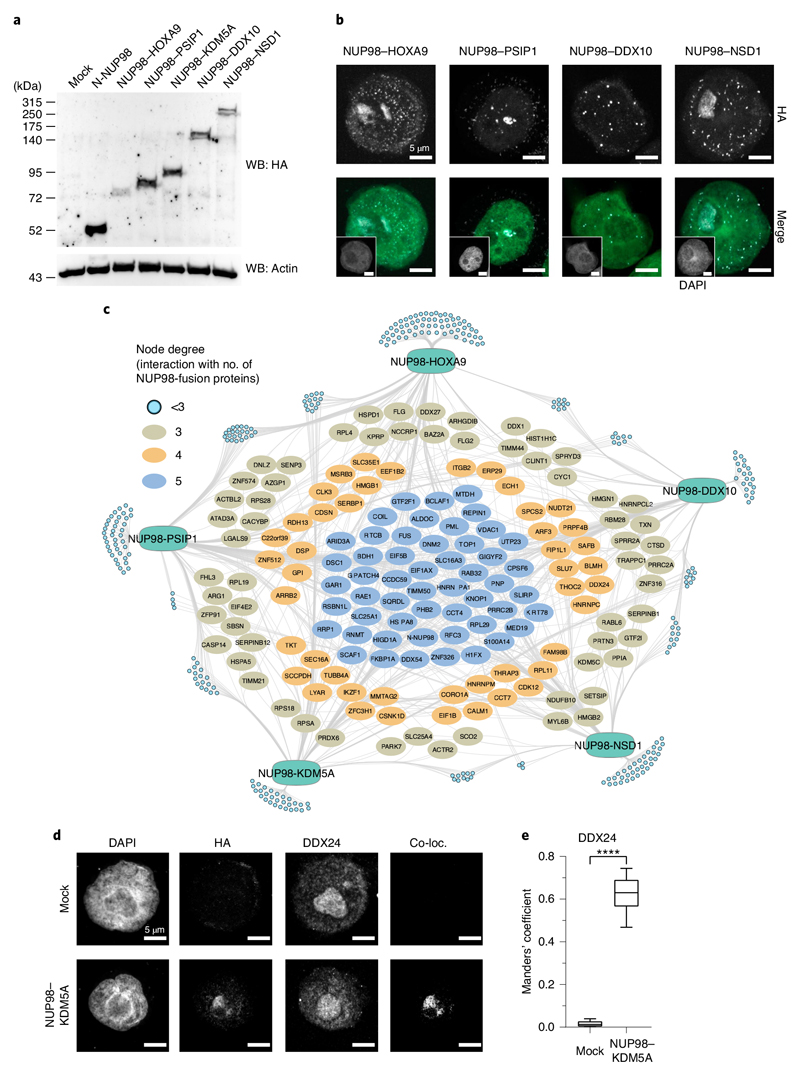
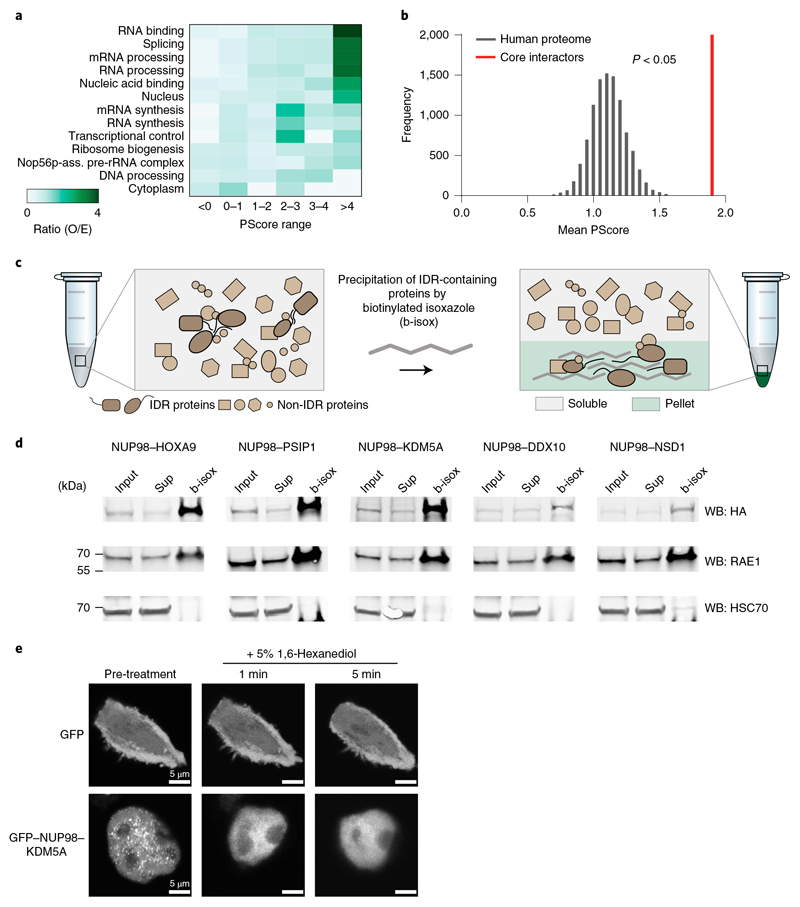
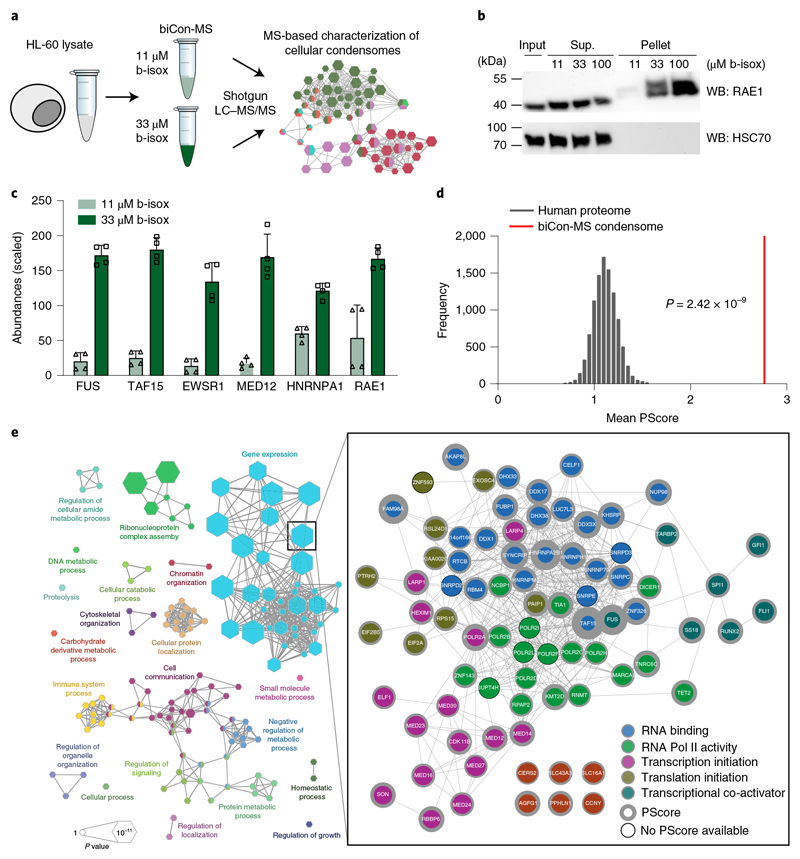
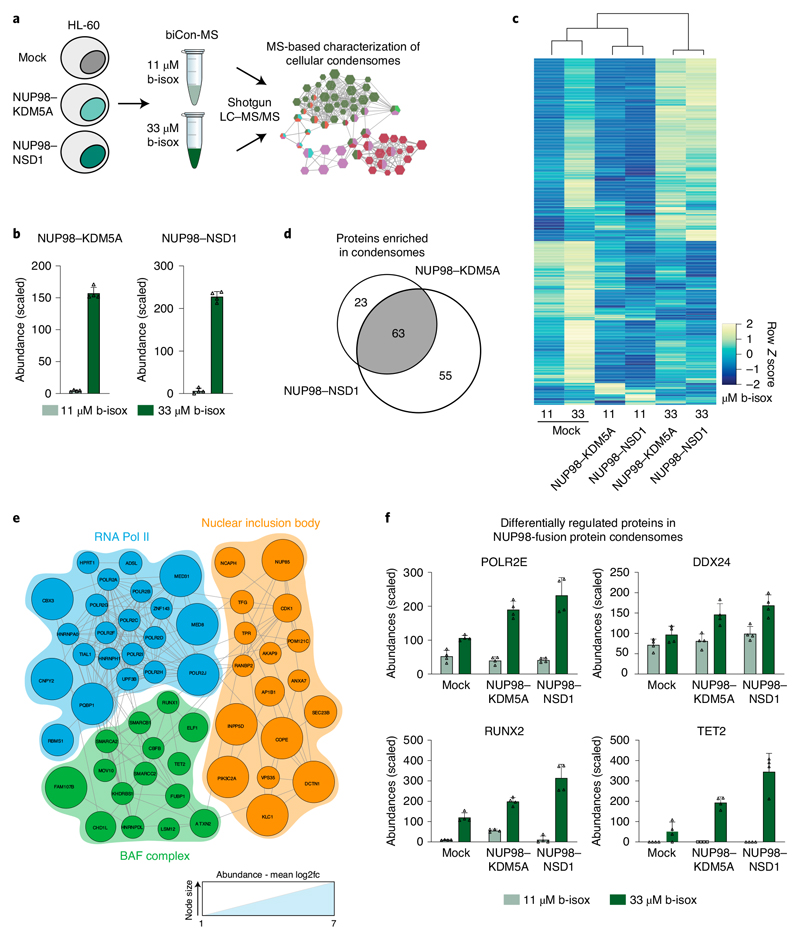
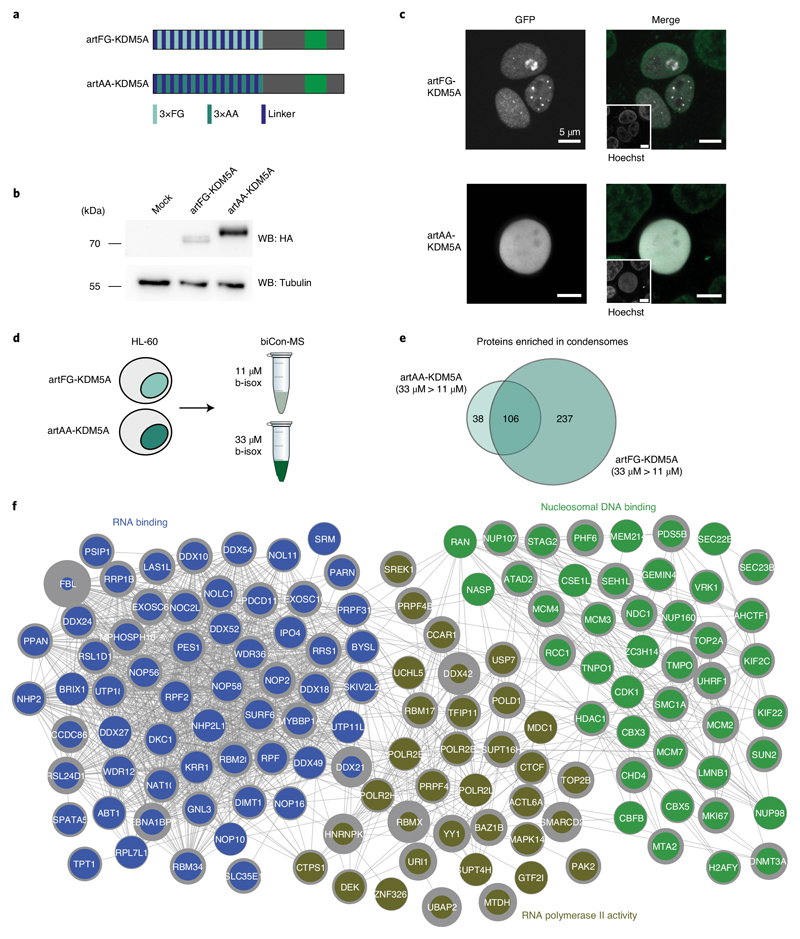
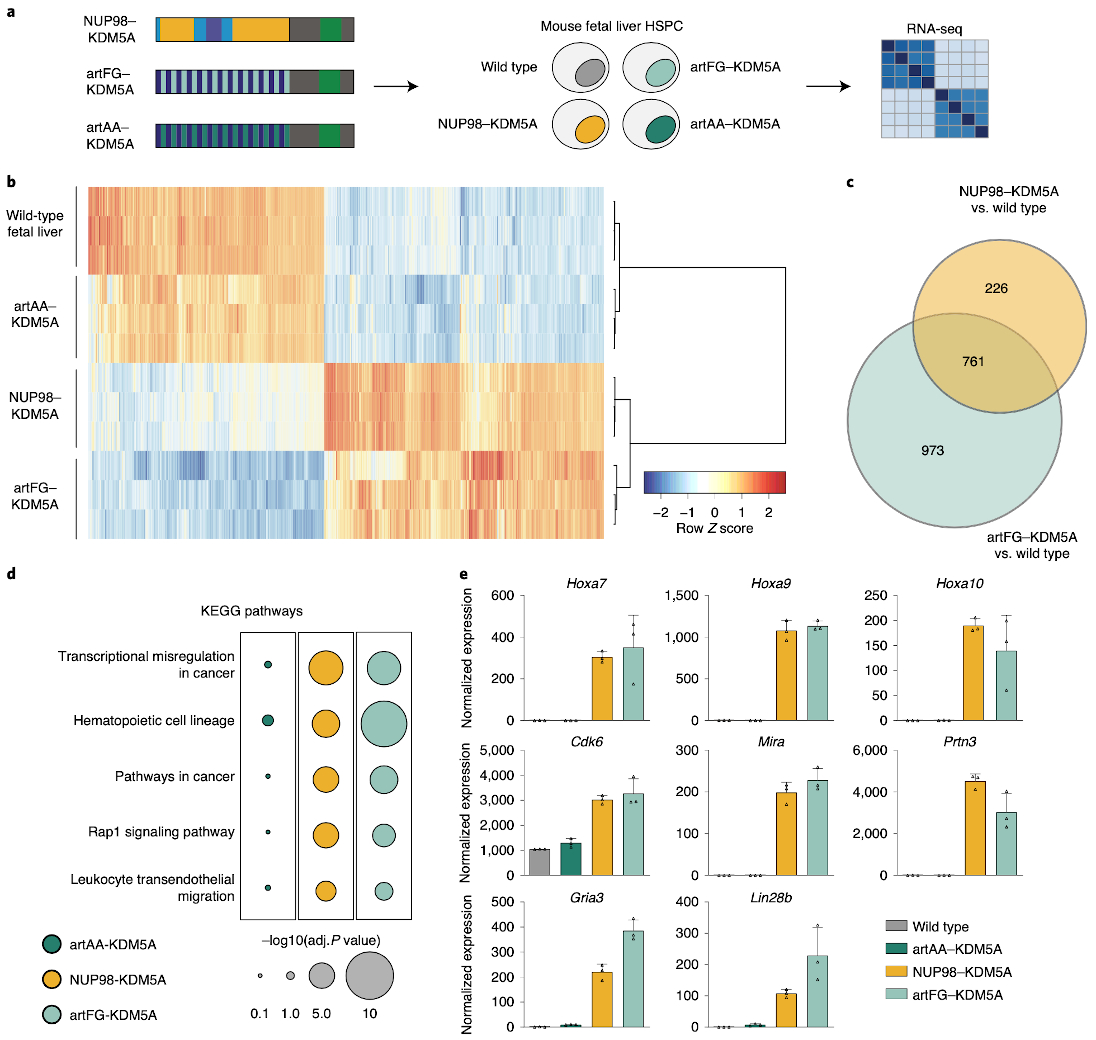
NUP98 fusion proteins cause leukemia via unknown molecular mechanisms. All NUP98 fusion proteins share an intrinsically disordered region (IDR) in the NUP98 N terminus, featuring repeats of phenylalanine-glycine (FG), and C-terminal fusion partners often function in gene control. We investigated whether mechanisms of oncogenic transformation by NUP98 fusion proteins are hardwired in their protein interactomes. Affinity purification coupled to mass spectrometry (MS) and confocal imaging of five NUP98 fusion proteins expressed in human leukemia cells revealed that shared interactors were enriched for proteins involved in biomolecular condensation and that they colocalized with NUP98 fusion proteins in nuclear puncta. We developed biotinylated isoxazole-mediated condensome MS (biCon-MS) to show that NUP98 fusion proteins alter the global composition of biomolecular condensates. An artificial FG-repeat-containing fusion protein phenocopied the nuclear localization patterns of NUP98 fusion proteins and their capability to drive oncogenic gene expression programs. Thus, we propose that IDR-containing fusion proteins combine biomolecular condensation with transcriptional control to induce cancer.


Conflict of interest statement

Competing interests

The authors declare no competing interests.

Figures

Extended Data Fig. 1
Extended Data Fig. 1. Immunoprecipitation of endogenous NUP98 and affinity purification of NUP98–KDM5A coupled to LC–MS/MS, Related to Fig. 1.
a, mRNA expression of NUP98-KDM5A in HL-60 cells and mouse AML cells expressing NUP98-KDM5A (paired, two-sided t-test, p-value: 0.33, three biological replicates). ddCt values were calculated using GAPDH/Gapdh expression for HL-60 cells and mouse leukemia cells, respectively. Graph shows individual data points, mean and s.d. n = 3 (biological replicates of the same experiment) (b) Western blot analysis of mock-transduced- and NUP98-KDM5A-expressing HL-60 cells. Control lysates were incubated with NUP98 antibody conjugated to magnetic beads and NUP98-KDM5A lysates were incubated with magnetic Strep-Tactin beads for 1 hour. Input, supernatant (sup) and pull down fractions were loaded and membranes were probed with anti-NUP98, anti-HA and anti-Tubulin antibodies. A representative blot of three independent experiments is shown. Uncropped images are available in Supplementary Fig. 1. c, String database networks of individual subcomplexes identified by Gene Ontology for Biological Processes (Fig. 1d). Identified interactors for respective GO terms were clustered using String database (cutoff 0.4). Individual proteins are highlighted (yellow to green) according to abundance in MS datasets. d, Confocal microscopy images of N-NUP98-expressing HL-60 cells stained with DAPI (green in merge) and anti-HA antibody (white in merge) for exogenous fusion proteins. Scale bar: 5μm. Six independent experiments were performed with similar results. e, Venn diagram of identified proteins from three different affinity purifications in HL-60 cells. Protein lists from immuno-affinity purification experiments with an anti-NUP98 antibody in mock transduced cells or N-NUP98-expressing cells were intersected with each other and with proteins identified in Strep-Tactin purifications from N-NUP98-expressing cells. The overlap shows N-terminal NUP98 interactors that are conserved between different pull-down approaches.
Extended Data Fig. 2
Extended Data Fig. 2. AP-MS analysis of NUP98-fusion proteins and validation of selected interaction partners, Related to Fig. 2.
a, Schematic representation of the experimental strategy. HL-60 cells were transduced with retroviral constructs encoding NUP98 fusion proteins and protein complex pulldowns were performed using Strep-Tactin followed by LC-MS/MS analysis. b, Immunofluorescence of mock transduced (top) HL-60 cells or cells expressing NUP98-KDM5A (bottom) stained with DAPI, anti-HA (background-fluorescence corrected) and anti-RAE1. Co-localization (co-loc) was determined with the ImageJ plugin ‘Colocalization’ Six independent experiments were performed with similar results. (c) Manders’ coefficient showing the co-occurrence of NUP98-KDM5A with RAE1. **** p-value < 0.0001, n = 12 cells examined over 2 independent experiments (6 mock vs. 6 NUP98-KDM5A) Two sided, paired t-test, t = -10.277, df = 5, **** p-value = 0.0001499. The box plot centre line defines the median, the box limits indicate upper and lower quartiles, whiskers indicate minima and maxima among all data points. Data behind graph are available as Source Data. d, Western blot analysis of protein lysates from control HEK293T cells or cells transfected with NUP98-KDM5A after Strep-Tactin affinity purification. Blot is representative of three independent experiments. Uncropped images are available in Supplementary Fig. 1. (e) CORUM analysis of 157 NUP98-fusion protein core interactors. Complexes are illustrated as a network highlighting top terms ranked by p-value. The network was generated with ClueGo v3.5.4. f, GO analysis (Biological Process) was performed for 157 NUP98-fusion protein core interactors. GO terms were ranked by combined score using Enrichr.
Extended Data Fig. 3
Extended Data Fig. 3. PScore analysis of different protein lists, Related to Fig. 3.
a, GSDTS was performed for the Gene Ontology list ‘Nuclear Membrane’. The mean PScore was compared to a set of lists of equal length that were randomly subsampled from the human proteome. b, GSDTS was performed for the human proteome. p-values were calculated using the Kolmogorov-Smirnov test. c, 100 μM b-isox precipitation of HEK293T cells transfected with mock, flag-tagged NUP98-KDM5A or untagged NUP98-KDM5A. Endogenous NUP98 and NUP98-KDM5A proteins were detected with anti-NUP98 antibodies in input, supernatant (sup) and precipitated (b-isox) fractions. Blot is representative of three independent experiments. Uncropped images are available in Supplementary Fig. 1.
Extended Data Fig. 4
Extended Data Fig. 4. b-isox precipitation of N-NUP98, related to Fig. 4.
a, Western blot analysis of protein lysates from HEK293T cells expressing N-NUP98 treated with 11 μM, 33 μM or 100 μM b-isox. N-NUP98 was detected using anti-HA antibodies. Total input, supernatant and b-isox fractions (pellet) are shown. Blot is representative of three independent experiments. Uncropped images are available in Supplementary Fig. 1.
Extended Data Fig. 5
Extended Data Fig. 5. biCon-MS for NUP98-KDM5A and NUP98-NSD1, Related to Fig. 5.
a, Normalized and scaled protein abundances for selected proteins previously implicated in the formation of biomolecular condensates identified by biCon-MS from lysates of HL-60 cells expressing NUP98-KDM5A. Graph shows individual data points, mean and s.d. for n = 4 (2 biological, 2 technical replicates). b, Normalized and scaled protein abundances for selected proteins previously implicated in the formation of biomolecular condensates identified by biCon-MS within lysates of HL-60 cells expressing NUP98-NSD1. Graph shows individual data points, mean and s.d. for n = 4 (2 biological, 2 technical replicates). c, Western blot analysis of NUP98-KDM5A-expressing NIH-3T3 cell lysates treated with 11 μM, 33 μM or 100 μM b-isox. Dose-dependent precipitation was investigated for NUP98-KDM5A and HSC70 as loading control. One representative blot of three independent experiments is shown. d, Western blot analysis of NIH-3T3 cell lysates treated with 11 μM, 33 μM or 100 μM b-isox. Dose-dependent precipitation was investigated for HSC70. One representative blot of three independent experiments is shown. Blot is representative of three independent experiments. Uncropped images for panels c and d are available in Supplementary Fig. 1. e, Schematic illustration of enriched/depleted proteins identified in fusion protein biCon-MS compared to mock-transduced HL-60 cells. f, Enrichment of proteins that exhibit dose-dependent precipitation upon expression of NUP98-KDM5A and NUP98-NSD1 as compared to mock-transduced HL-60 cells based on abundances in biCon-MS analysis. Enriched/depleted proteins in NUP98-fusion protein condensates are illustrated as nodes and are colored according to calculated fold change values. Depletion cutoff: log2(fc) < −1.5 and p-value < 0.01 Enrichment cutoff: log2(fc) > 1.5 and p-value < 0.01. P-value was calculated using a two-sided ANOVA test. g, Normalized and scaled abundances of significantly enriched (MED31) or depleted (MED15) proteins in NUP98-fusion protein condensomes as identified by biCon-MS. Graph shows individual data points, mean and s.d. for n = 4 (2 biological, 2 technical replicates).
Extended Data Fig. 6
Extended Data Fig. 6. biCon-MS for artAA-KDM5A and artFG-KDM5A, Related to Fig. 6.
Volcano plot of (a) artAA-KDM5A and (b) artFG-KDM5A for 11 μM and 33 μM condensomes, generated from normalized protein abundances obtained by biCon-MS. The significance cutoff was log2(fc) < -1 or > 1 and p-value < 0.01. (c) GO (Molecular Function) analysis for 237 proteins precipitated by b-isox in artFG-KDM5A-vs. artAA-KDM5A-expressing cells. (d) Normalized and scaled abundances of selected enriched proteins in the artFG-KDM5A-induced condensome as identified by biCon-MS. Graph shows individual data points, mean and s.d. for n = 4 (2 biological and 2 technical replicates).
Extended Data Fig. 7
Extended Data Fig. 7. RNA-seq of mouse fetal liver cells, Related to Fig. 7.
a, Principal component analysis based on normalized expression profiles of RNA-seq from murine wild type fetal liver cells and cells expressing NUP98-KDM5A, artAA-KDM5A or artFG-KDM5A. b, 761 genes that are differentially regulated upon expression of NUP98-KDM5A and artFG-KDM5A were grouped using DisGeNET according to related diseases. Most significant disease terms are illustrated as hexagons sized according to their p-value. Corresponding disease classes are shown as diamonds connected by edges to diseases, defined by DiGeNET. c, The mean PScore for all proteins involved in cancer gene fusions listed in COSMIC was compared to a list of 10,000 randomly subsampled lists of the human proteome with the same size. The p-value was calculated using the two-sided, two-sample Kolmogorov-Smirnov test, D = 0.26114, p-value < 2.2e-16.
Fig. 1
Fig. 1. NUP98–KDM5A does not operate in the context of the nuclear pore complex.
a, Domain architecture of endogenous NUP98 and KDM5A proteins and the oncogenic NUP98–KDM5A fusion protein. GBD, Gle2-binding domain; JMJ, Jumonji domain. b, Confocal microscopy images showing a representative HL-60 cell expressing NUP98–KDM5A, stained with DAPI (green in the merged image) and anti-HA antibody for fusion proteins (white in the merged image). Scale bar, 5μm. Six independent experiments were performed with similar results. c, Schematic representation of the experimental setup. HL-60 cells were transduced with a retroviral vector expressing tagged NUP98–KDM5A (left). Endogenous NUP98 complexes were pulled down from mock-transduced HL-60 cells with a NUP98-specific antibody, whereas tagged NUP98–KDM5A complexes were purified using Strep-Tactin (middle). Data on purified protein complexes were acquired by LC–MS/MS and subsequently analyzed (right). d, Interactome analysis was performed by CRaPome (antibody IP) or mock pull-down (Strep-Tactin AP) subtraction for NUP98 and NUP98–KDM5A, respectively. Individual protein complexes within the interactomes were obtained by K-means clustering (K=7) based on String db interactions, assigned using Gene Ontology Biological Processes and illustrated as hexagons (green for NUP98 and blue for NUP98–KDM5A complexes). Hexagon sizes and numbers represent the identified proteins associated with respective subcomplexes. Red nodes show shared proteins between the interactomes. Detailed string db networks (cutoff 0.4) are shown for subcomplexes of ‘RNA helicases’ and ‘RNA binding,’ and individual proteins are highlighted (yellow to green) according to abundance in MS acquisition.
Fig. 2
Fig. 2. Functional proteomic identification of conserved interactors of diverse NUP98 fusion proteins.
a, Western blot analysis of mock-transfected, N-NUP98- or NUP98 fusion protein–expressing HEK293T cells. Exogenous proteins were detected with anti-HA antibodies, and β-actin was used as a loading control. Blot is representative of three independent experiments. Uncropped images are available in Supplementary Fig. 1. b, Confocal microscopy images showing representative HL-60 cells expressing different NUP98 fusion proteins, stained with DAPI (green in the merged image) and anti-HA antibody for fusion protein detection (white in the merged image). Scale bar, 5μm. Six independent experiments were performed with similar results. c, Interactome analysis of five NUP98 fusion proteins. Light blue nodes represent proteins interacting with less than three baits. Proteins that interact with three or more baits are illustrated as ovals. MS analysis was performed in two biological and two technical replicates. d, Immunofluorescence of mock-transduced HL-60 cells (top) or cells expressing NUP98–KDM5A (bottom) stained with DAPI, anti-HA (background fluorescence corrected) and anti-DDX24. Colocalization was determined using the ImageJ plugin ‘Colocalization’. Images shown are representative of six independent experiments. e, Manders’ coefficient showing the co-occurrence of NUP98–KDM5A with DDX24. The box plot center line defines the median, the box limits indicate upper and lower quartiles, and whiskers indicate minima and maxima among all data points. n = 6 cells, ****P < 0.0001, two-sided paired t test, t = -14.895, df = 5, P = 2.468 × 10⁻⁵. Data behind the graph are available as source data.
Fig. 3
Fig. 3. The NUP98 fusion protein interactome is enriched for proteins with roles in biomolecular condensation.
a, Observed over expected (O/E) ratios of binned PScores for proteins of significantly enriched Gene Ontologies from Extended Data Fig. 2f were calculated by the observed PScore distribution of the 157 NUP98 fusion core interactors as compared to the expected distribution of the proteome. Gene Ontology terms were ranked by O/E ratio of the bin with the highest PScores. b, The mean PScore for 157 NUP98 fusion core interactors was compared to a set of lists of equal length randomly subsampled from the human proteome. The P value was calculated using a two-sided, two-sample Kolmogorov–Smirnov test, D = 0.11288, P = 0.03598. Data behind the graph are available as source data. c, Schematic illustration of the b-isox-mediated precipitation assay. IDR-containing proteins form β-sheets upon b-isox treatment and can be collected by centrifugation. d, Western blot analysis of HL-60 cell lysates expressing different NUP98-fusion proteins treated with 100 μM b-isox. Fusion proteins were detected with anti-HA antibody, RAE1 was detected with anti-RAE1 antibody, and HSC70 was detected with anti-HSC70 antibody. Total input, supernatant (sup) and b-isox fractions are shown. Uncropped images are available in Supplementary Fig. 1. e, Live-cell confocal microscopy images of HEK293T cells expressing GFP or GFP-tagged NUP98–KDM5A, before and after treatment with 5% 1,6-hexanediol for the indicated time. Cells were plated on polymer-coated chamber slides and imaged 24 h after transfection. Scale bar, 5 μm. Images shown are representative of six independent experiments.
Fig. 4
Fig. 4. biCon-MS globally charts the cellular condensome.
a, Schematic illustration of the biCon-MS approach. MS analysis was performed in two biological and two technical replicates. b, Western blot analysis of HL-60 cell lysates treated with 11 μM, 33 μM or 100 μM b-isox. Dose-dependent precipitation was investigated for RAE1 and HSC70. Total input, supernatant (sup) and b-isox fractions (pellet) are shown. Blot is representative of three independent experiments. Uncropped images are available in Supplementary Fig. 1. c, Normalized and scaled protein abundance for selected proteins previously implicated in the formation of biomolecular condensates identified by biCon-MS of mock HL-60 cells. Graphs show individual data points, mean and s.d. for n = 4 (2 biological, 2 technical replicates). d, Mean PScore for proteins significantly enriched (P < 0.05, log2(fold change) > 0.5) in 33μM b-isox precipitates as compared to 11 μM b-isox precipitates was compared to a set of lists of equal length that were randomly subsampled from the human proteome. P value was calculated using a two-sided, two-sample Kolmogorov-Smirnov test, D = 0.23547, P = 2.424 × 10⁻⁹. e, Gene Ontology analysis of proteins significantly enriched (P < 0.05, log2(fold change) > 0.5) in 33 μM b-isox precipitates compared to 11 μM b-isox precipitates. Edges connect terms with overlapping protein lists. The protein list of the most significant Gene Ontology term (‘gene expression’) is represented by interactions from the String database. The network of annotated interactions was clustered using Reactome FI in Cytoscape. Gray border thickness indicates PScores for individual proteins. Proteins without any annotated PScore are indicated by black borders. Size of the hexagons scale with significance of Gene Ontology term analysis. Data behind the graphs in c,d are available as source data.
Fig. 5
Fig. 5. Expression of NUP98 fusion proteins dynamically alters the cellular condensome.
a, Schematic illustration of biCon-MS for HL-60 cells expressing NUP98–KDM5A or NUP98-NSD1. MS analysis was performed in two biological and two technical replicates. b, Normalized and scaled protein abundance for Strep-HA-tag-derived peptides identified by biCon-MS in lysates of NUP98 fusion protein-expressing HL-60 cells. Graph shows individual data points, mean and s.d. for n = 4 (2 biological, 2 technical replicates). c, Heat map of proteins that were more abundant in 33 μM than in 11 μM precipitates of mock-transduced HL-60 cells. Each row represents Z scores of mean abundances for individual proteins for each condition (mock, NUP98–KDM5A and NUP98-NSD1 with 11 μM and 33 μM b-isox). Rows and columns were clustered using Pearson correlation as a distance measure and ward.D clustering. d, Venn diagram of enriched proteins (log2(fold change) > 1.0) in condensomes of NUP98–KDM5A- and NUP98-NSD1-expressing cells compared to mock-transduced HL-60 cells. e, Reactome FI clustering of all proteins that were precipitated by b-isox in a dose-dependent manner upon expression of NUP98–KDM5A and NUP98-NSD1, compared to mock-transduced HL-60 cells. Proteins representative of the three most significant protein complexes are shown in groups and connected via annotated String db interactions. The size of the nodes represents mean log2(fold change). f, Scaled abundance of selected significantly enriched proteins in both NUP98 fusion protein condensomes as identified by biCon-MS. Graphs show individual data points, mean and s.d. for n = 4 (2 biological, 2 technical replicates). Data behind graphs for b,f are available as source data.
Fig. 6
Fig. 6. An artificial IDR-containing KDM5A fusion protein phenocopies NUP98-fusion-induced changes in the condensome.
a, Schematic illustration of artificial (art) KDM5A fusion proteins. Thirteen triple repeats of phenylalanine-glycine (FG) or alanine-alanine (AA), connected by 18-amino-acid linkers, were fused to the C-terminal part of KDM5A found in patients with NUP98–KDM5A-driven AML. b, Western blot analysis of HEK293T cells transfected with mock, artFG–KDM5A or artAA–KDM5A. Fusion proteins were detected with anti-HA antibodies, and tubulin was used as a loading control. Blot is representative of three independent experiments. Uncropped images are available in Supplementary Fig. 1. c, Live cell imaging of HEK293T cells expressing GFP-tagged variants of artFG–KDM5A and artAA–KDM5A. Fusion proteins are shown in white, and Hoechst staining is shown in green. Scale bar, 5μm. Images are representative of six independent experiments. d, Schematic illustration of biCon-MS for HL-60 cells expressing artFG–KDM5A or artAA–KDM5A. MS analysis was performed in two biological and two technical replicates. e, Venn diagram of proteins enriched in 33μM precipitates compared to 11 μM precipitates for artAA–KDM5A (Extended Data Fig. 6a) and artFG–KDM5A (Extended Data Fig. 6b). f, Reactome FI clustering for 237 proteins uniquely enriched in artFG–KDM5A compared to artAA–KDM5A. The three most significant nuclear clusters are shown with String db interactions (cutoff 0.4) for individual proteins. Gray border thickness indicates PScores for individual proteins.
Fig. 7
Fig. 7. Artificial FG-containing fusion proteins induce leukemogenic gene expression programs in hematopoietic progenitor cells.
a, Schematic illustration of fusion protein expression in murine fetal liver hematopoietic stem and progenitor cells, followed by RNA-seq. b, Heat map of significantly deregulated genes in NUP98–KDM5A- and artFG–KDM5A-expressing cells compared to control fetal liver cells. Rows and columns were clustered using Pearson correlation as a distance measure and ward.D clustering. Each row represents Z scores of scaled expression levels for each replicate. Only genes with P < 0.01 are shown. c, Venn diagram of differentially regulated genes in NUP98–KDM5A and artFG–KDM5A-expressing cells compared to mock-transduced cells. P < 0.001 and log2(fold change) <–2 or > 2. P values and fold changes were obtained using DESeq2 for normalization and differential gene expression analysis (Methods). d, KEGG pathway analysis for differentially regulated genes of artAA–KDM5A-, NUP98–KDM5A- and artFG–KDM5A-expressing fetal liver cells. Most significant pathways induced by NUP98–KDM5A are shown. e, Gene expression of known direct NUP98 fusion protein targets, shared between NUP98–KDM5A and artFG–KDM5A. Data are mean and s.d. of n = 3 independent biological replicates.

Comment in

References

    1. Mitelman F, Johansson B, Mertens F. The impact of translocations and gene fusions on cancer causation. Nat Rev Cancer. 2007;7:233–245. - PubMed
    1. Mertens F, Johansson B, Fioretos T, Mitelman F. The emerging complexity of gene fusions in cancer. Nat Rev Cancer. 2015;15:371–381. - PubMed
    1. Zhao J, Lee SH, Huss M, Holme P. The network organization of cancer-associated protein complexes in human tissues. Sci Rep. 2013;3:1583. - PMC - PubMed
    1. Reckel S, et al. Differential signaling networks of Bcr–Abl p210 and p190 kinases in leukemia cells defined by functional proteomics. Leukemia. 2017;31:1502–1512. - PMC - PubMed
    1. Skucha A, et al. MLL-fusion-driven leukemia requires SETD2 to safeguard genomic integrity. Nat Commun. 2018;9:1983. - PMC - PubMed

Publication types