

Modeling autosomal dominant Alzheimer's disease with machine learning
- PMID: 33480178
- PMCID: PMC8195816
- DOI: 10.1002/alz.12259
Modeling autosomal dominant Alzheimer's disease with machine learning
Abstract
Introduction: Machine learning models were used to discover novel disease trajectories for autosomal dominant Alzheimer's disease.
Methods: Longitudinal structural magnetic resonance imaging, amyloid positron emission tomography (PET), and fluorodeoxyglucose PET were acquired in 131 mutation carriers and 74 non-carriers from the Dominantly Inherited Alzheimer Network; the groups were matched for age, education, sex, and apolipoprotein ε4 (APOE ε4). A deep neural network was trained to predict disease progression for each modality. Relief algorithms identified the strongest predictors of mutation status.
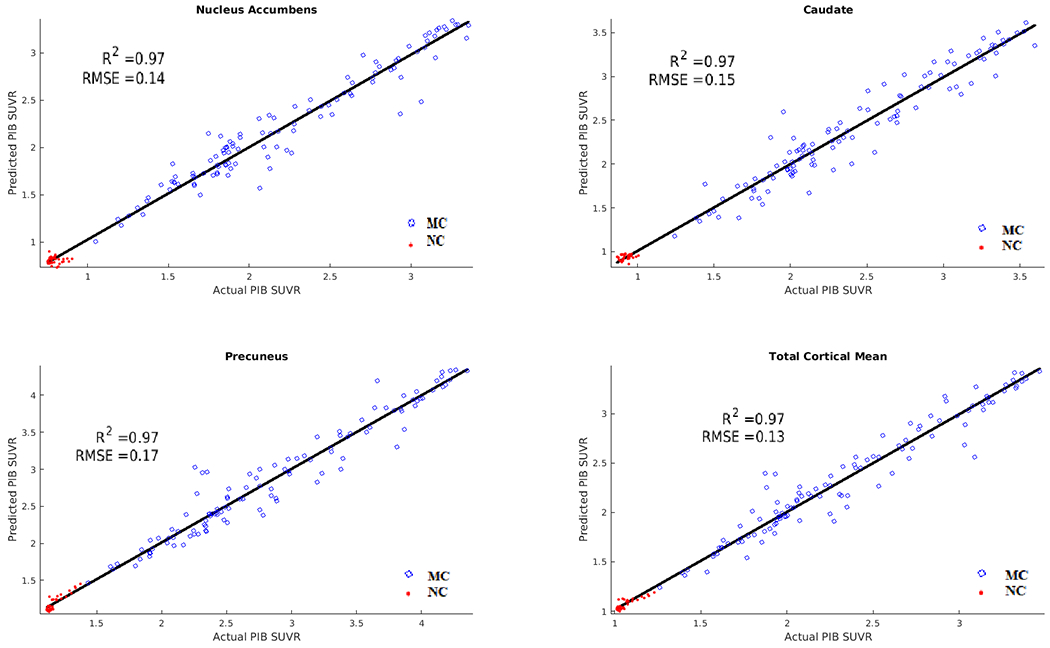
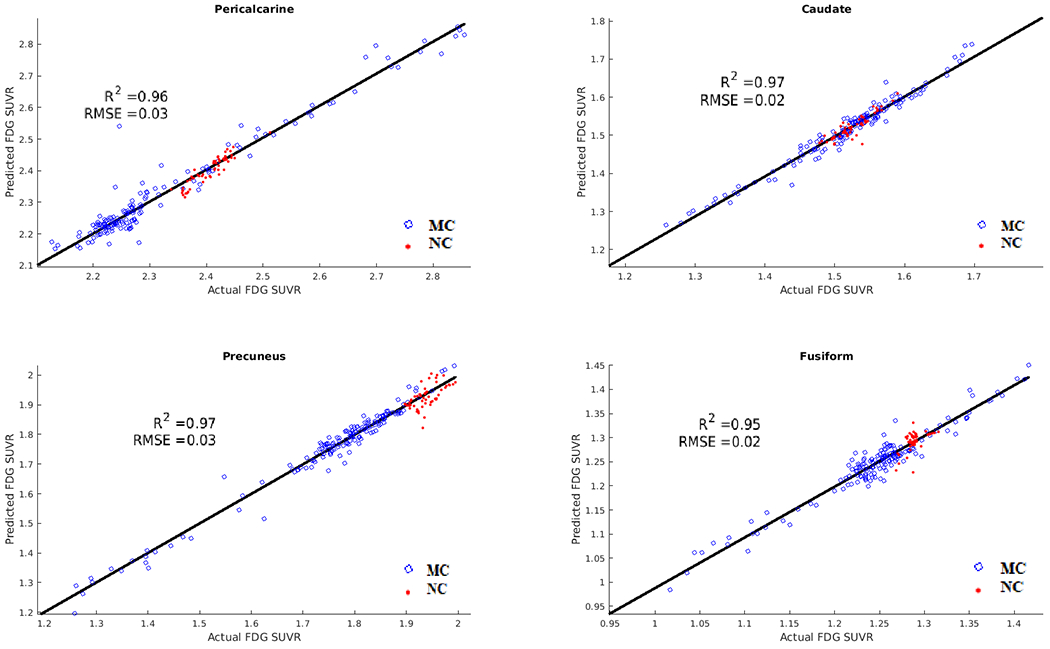
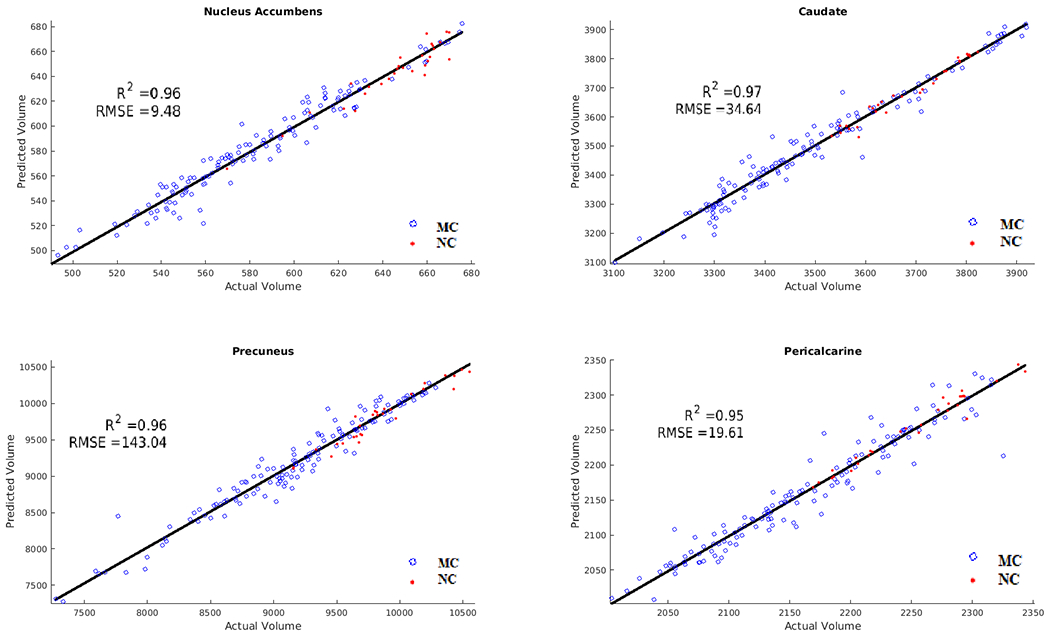
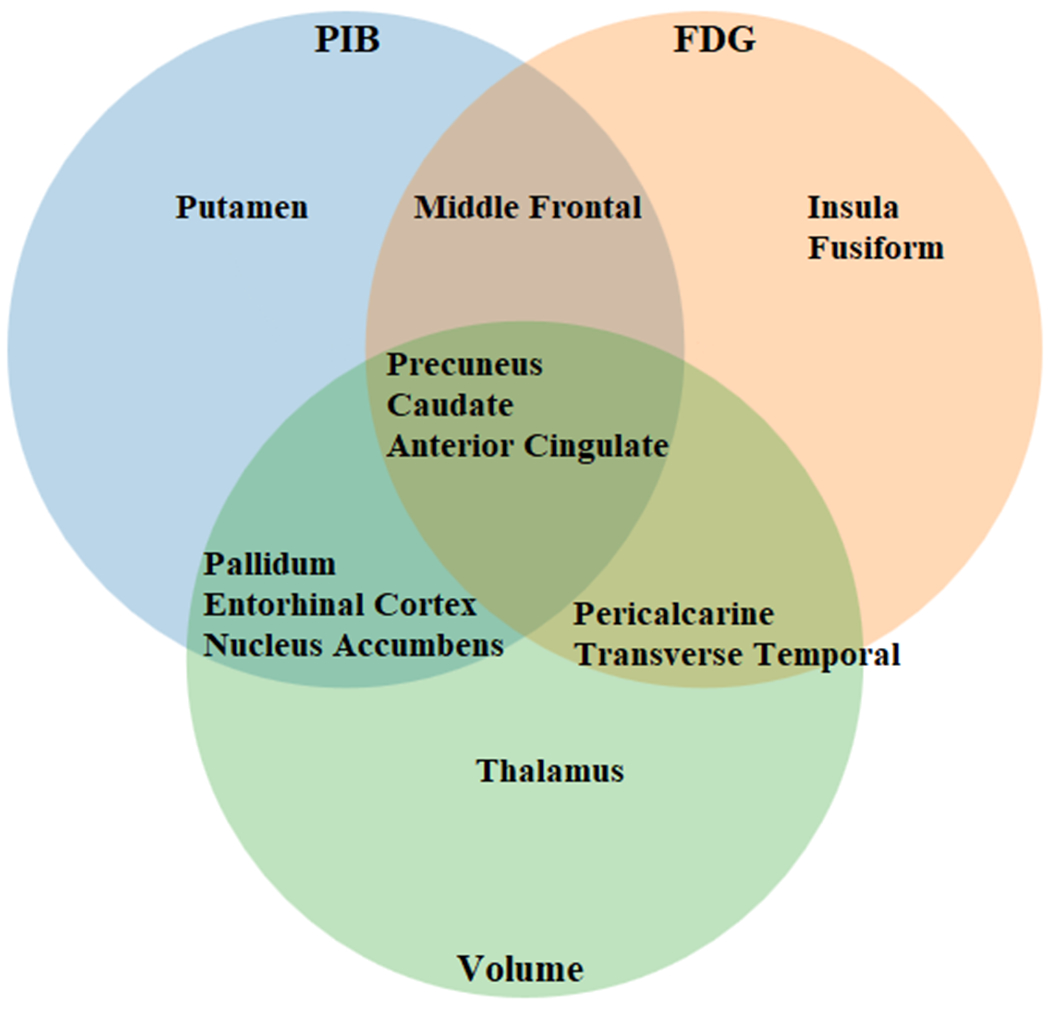
Results: The Relief algorithm identified the caudate, cingulate, and precuneus as the strongest predictors among all modalities. The model yielded accurate results for predicting future Pittsburgh compound B (R2 = 0.95), fluorodeoxyglucose (R2 = 0.93), and atrophy (R2 = 0.95) in mutation carriers compared to non-carriers.
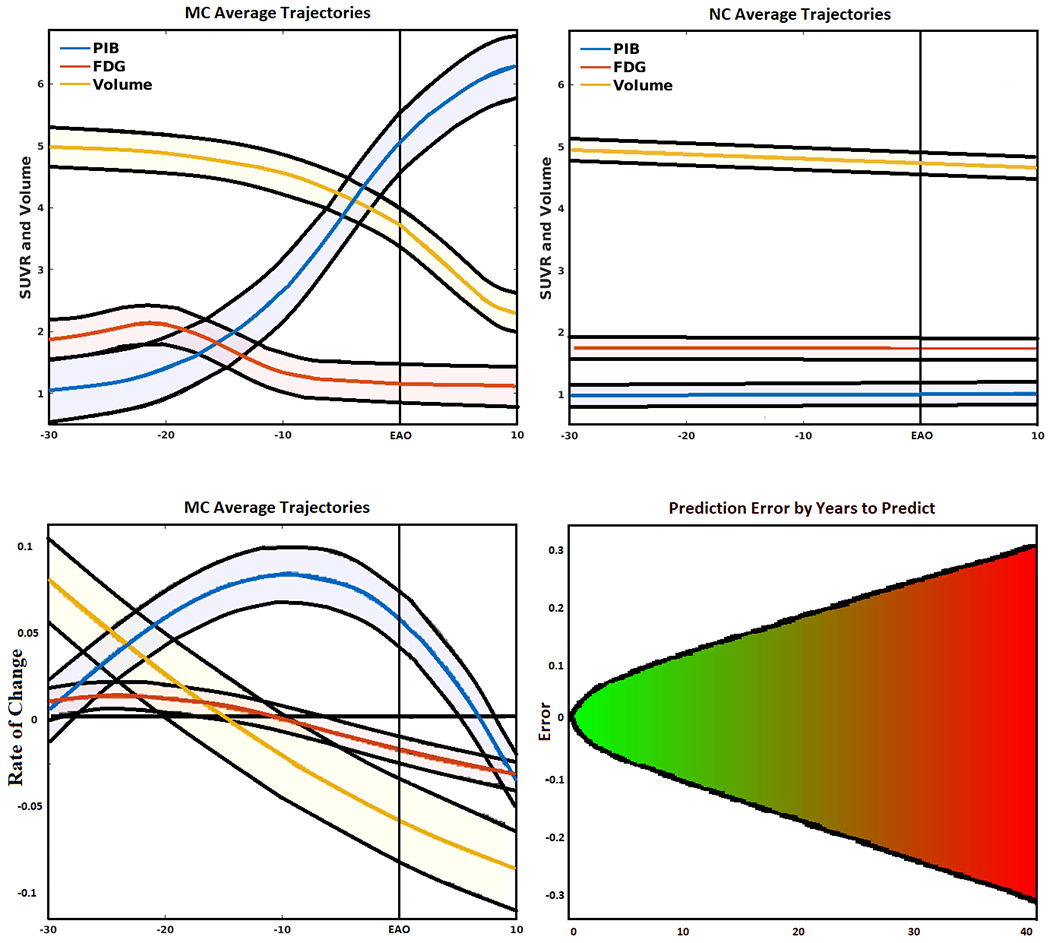
Discussion: Results suggest a sigmoidal trajectory for amyloid, a biphasic response for metabolism, and a gradual decrease in volume, with disease progression primarily in subcortical, middle frontal, and posterior parietal regions.
Keywords: Pittsburgh compound B (PiB); autosomal dominant Alzheimer's disease (ADAD); fluorodeoxyglucose (FDG); machine learning; magnetic resonance imaging (MRI).
© 2021 the Alzheimer's Association.
Figures
References
-
- World Health Organization. Dementia Fact sheet. WHO; 2017;17:751–60. 10.1063/1.3590158. - DOI
Publication types
MeSH terms
Substances
Grants and funding
- P30 AG066444/AG/NIA NIH HHS/United States
- P50 AG005131/AG/NIA NIH HHS/United States
- K01 AG053474/AG/NIA NIH HHS/United States
- P01 AG026276/AG/NIA NIH HHS/United States
- R01 AG046179/AG/NIA NIH HHS/United States
- UF1 AG032438/AG/NIA NIH HHS/United States
- UL1 TR000448/TR/NCATS NIH HHS/United States
- UL1 TR002345/TR/NCATS NIH HHS/United States
- U19 AG032438/AG/NIA NIH HHS/United States
- U01 AG042791/AG/NIA NIH HHS/United States
- S10 OD018091/OD/NIH HHS/United States
- P01 AG003991/AG/NIA NIH HHS/United States
- P50 AG005681/AG/NIA NIH HHS/United States
- T32 AG058518/AG/NIA NIH HHS/United States
- S10 RR022984/RR/NCRR NIH HHS/United States
- R01 EB009352/EB/NIBIB NIH HHS/United States
- P30 NS098577/NS/NINDS NIH HHS/United States
- P30 AG066462/AG/NIA NIH HHS/United States
- S10 OD025214/OD/NIH HHS/United States
- R01 AG052550/AG/NIA NIH HHS/United States
LinkOut - more resources
Full Text Sources
Other Literature Sources
Medical
Miscellaneous
