

Integrating Linguistics, Social Structure, and Geography to Model Genetic Diversity within India
- PMID: 33481022
- PMCID: PMC8097304
- DOI: 10.1093/molbev/msaa321
Integrating Linguistics, Social Structure, and Geography to Model Genetic Diversity within India
Abstract
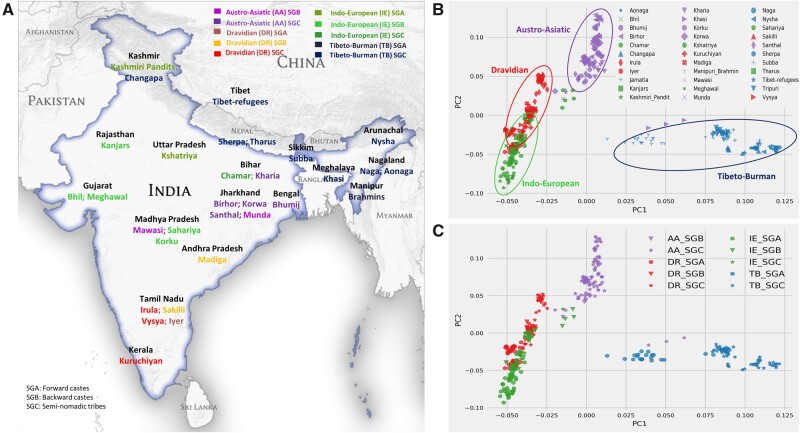
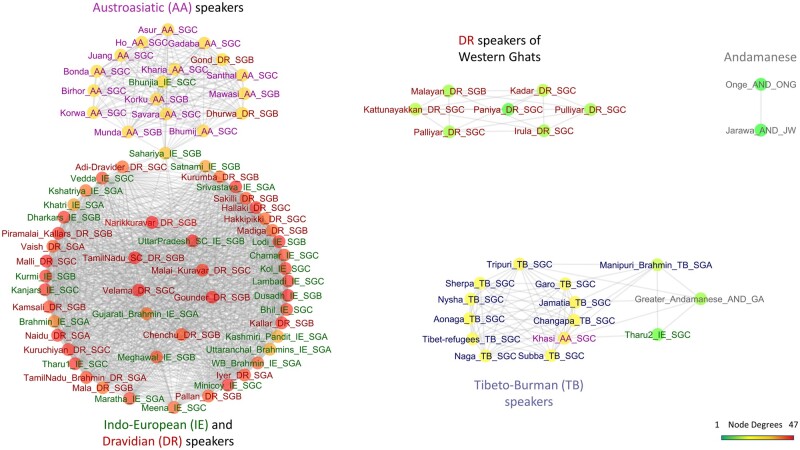
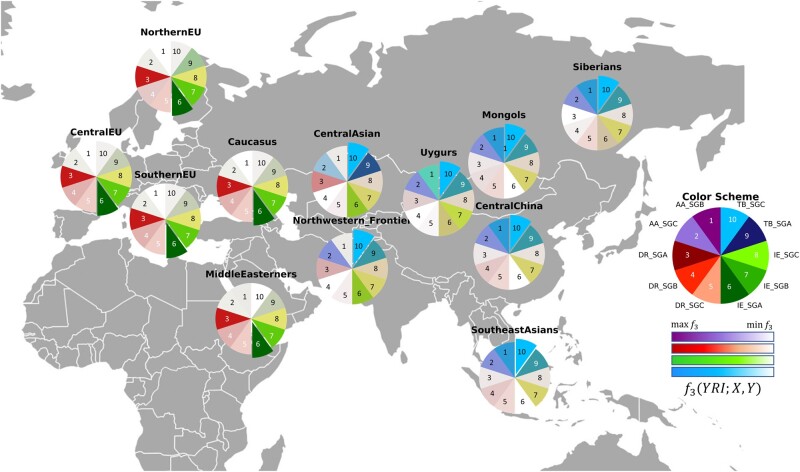
India represents an intricate tapestry of population substructure shaped by geography, language, culture, and social stratification. Although geography closely correlates with genetic structure in other parts of the world, the strict endogamy imposed by the Indian caste system and the large number of spoken languages add further levels of complexity to understand Indian population structure. To date, no study has attempted to model and evaluate how these factors have interacted to shape the patterns of genetic diversity within India. We merged all publicly available data from the Indian subcontinent into a data set of 891 individuals from 90 well-defined groups. Bringing together geography, genetics, and demographic factors, we developed Correlation Optimization of Genetics and Geodemographics to build a model that explains the observed population genetic substructure. We show that shared language along with social structure have been the most powerful forces in creating paths of gene flow in the subcontinent. Furthermore, we discover the ethnic groups that best capture the diverse genetic substructure using a ridge leverage score statistic. Integrating data from India with a data set of additional 1,323 individuals from 50 Eurasian populations, we find that Indo-European and Dravidian speakers of India show shared genetic drift with Europeans, whereas the Tibeto-Burman speaking tribal groups have maximum shared genetic drift with East Asians.
Keywords: India; South Asia; algorithms; data mining; genomics; population structure.
© The Author(s) 2021. Published by Oxford University Press on behalf of the Society for Molecular Biology and Evolution.
Figures
References
-
- Abbi A. 2009. Is great Andamanese genealogically and typologically distinct from Onge and Jarawa? Lang Sci. 31(6):791–812.
-
- Alaoui AE, Mahoney MW.. 2015. Fast randomized kernel ridge regression with statistical guarantees. Proceedings of the 28th International Conference on Neural Information Processing Systems. Vol. 1. Cambridge (MA: ): MIT Press, NIPS’15. p. 775–783.
-
- ArunKumar G, Soria-Hernanz DF, Kavitha VJ, Arun VS, Syama A, Ashokan KS, Gandhirajan KT, Vijayakumar K, Narayanan M, Jayalakshmi M, et al. 2012. Population differentiation of southern Indian male lineages correlates with agricultural expansions predating the caste system. PLoS One 7(11):e50269. - PMC - PubMed
Publication types
MeSH terms
LinkOut - more resources
Full Text Sources
Other Literature Sources
Research Materials
