

Temporal Trends in Incidence Rates of Lower Extremity Amputation and Associated Risk Factors Among Patients Using Veterans Health Administration Services From 2008 to 2018
- PMID: 33481033
- PMCID: PMC7823225
- DOI: 10.1001/jamanetworkopen.2020.33953
Temporal Trends in Incidence Rates of Lower Extremity Amputation and Associated Risk Factors Among Patients Using Veterans Health Administration Services From 2008 to 2018
Abstract
Importance: Lower extremity amputation (LEA) is associated with significant morbidity and mortality. However, national temporal trends of LEA incidence rates among US veterans and associated factors have not been well characterized.
Objective: To describe the temporal trends of LEA, characterize associated risk factors, and decompose the associations of these risk factors with changes in temporal trends of LEA among US veterans using Department of Veteran Affairs (VA) services between 2008 and 2018.
Design, setting, and participants: This cohort study used VA data from 2008 to 2018 to estimate incidence rates of LEA among veterans using VA services. Cox regression models were used to identify risk factors associated with LEA. Decomposition analyses estimated the associations of changes in prevalence of risk factors with changes in LEA rates. Data were analyzed from October 1, 2007, to September 30, 2018.
Main outcomes and measures: Toe, transmetatarsal, below-knee, or above-knee LEA.
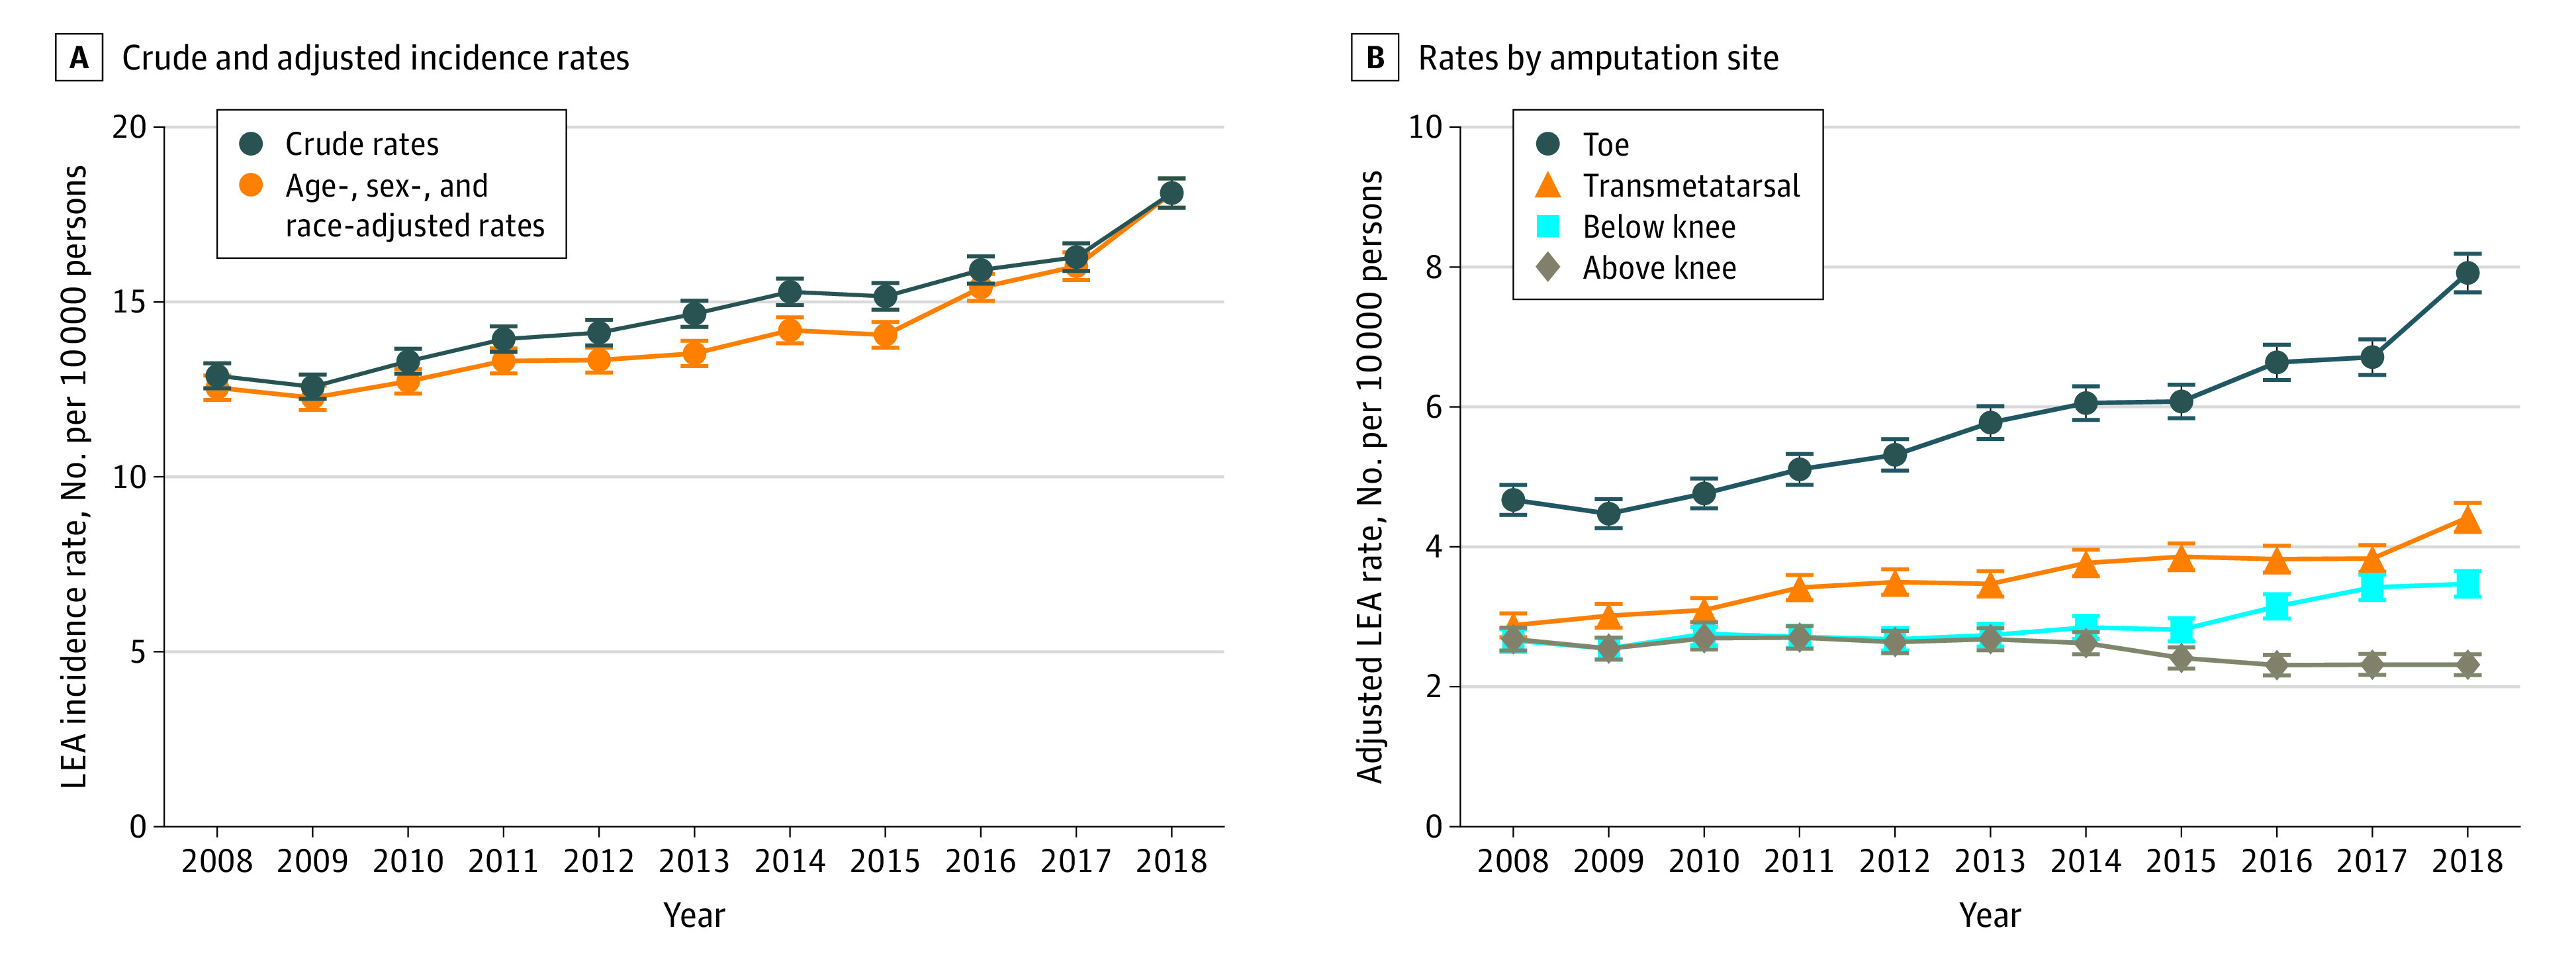
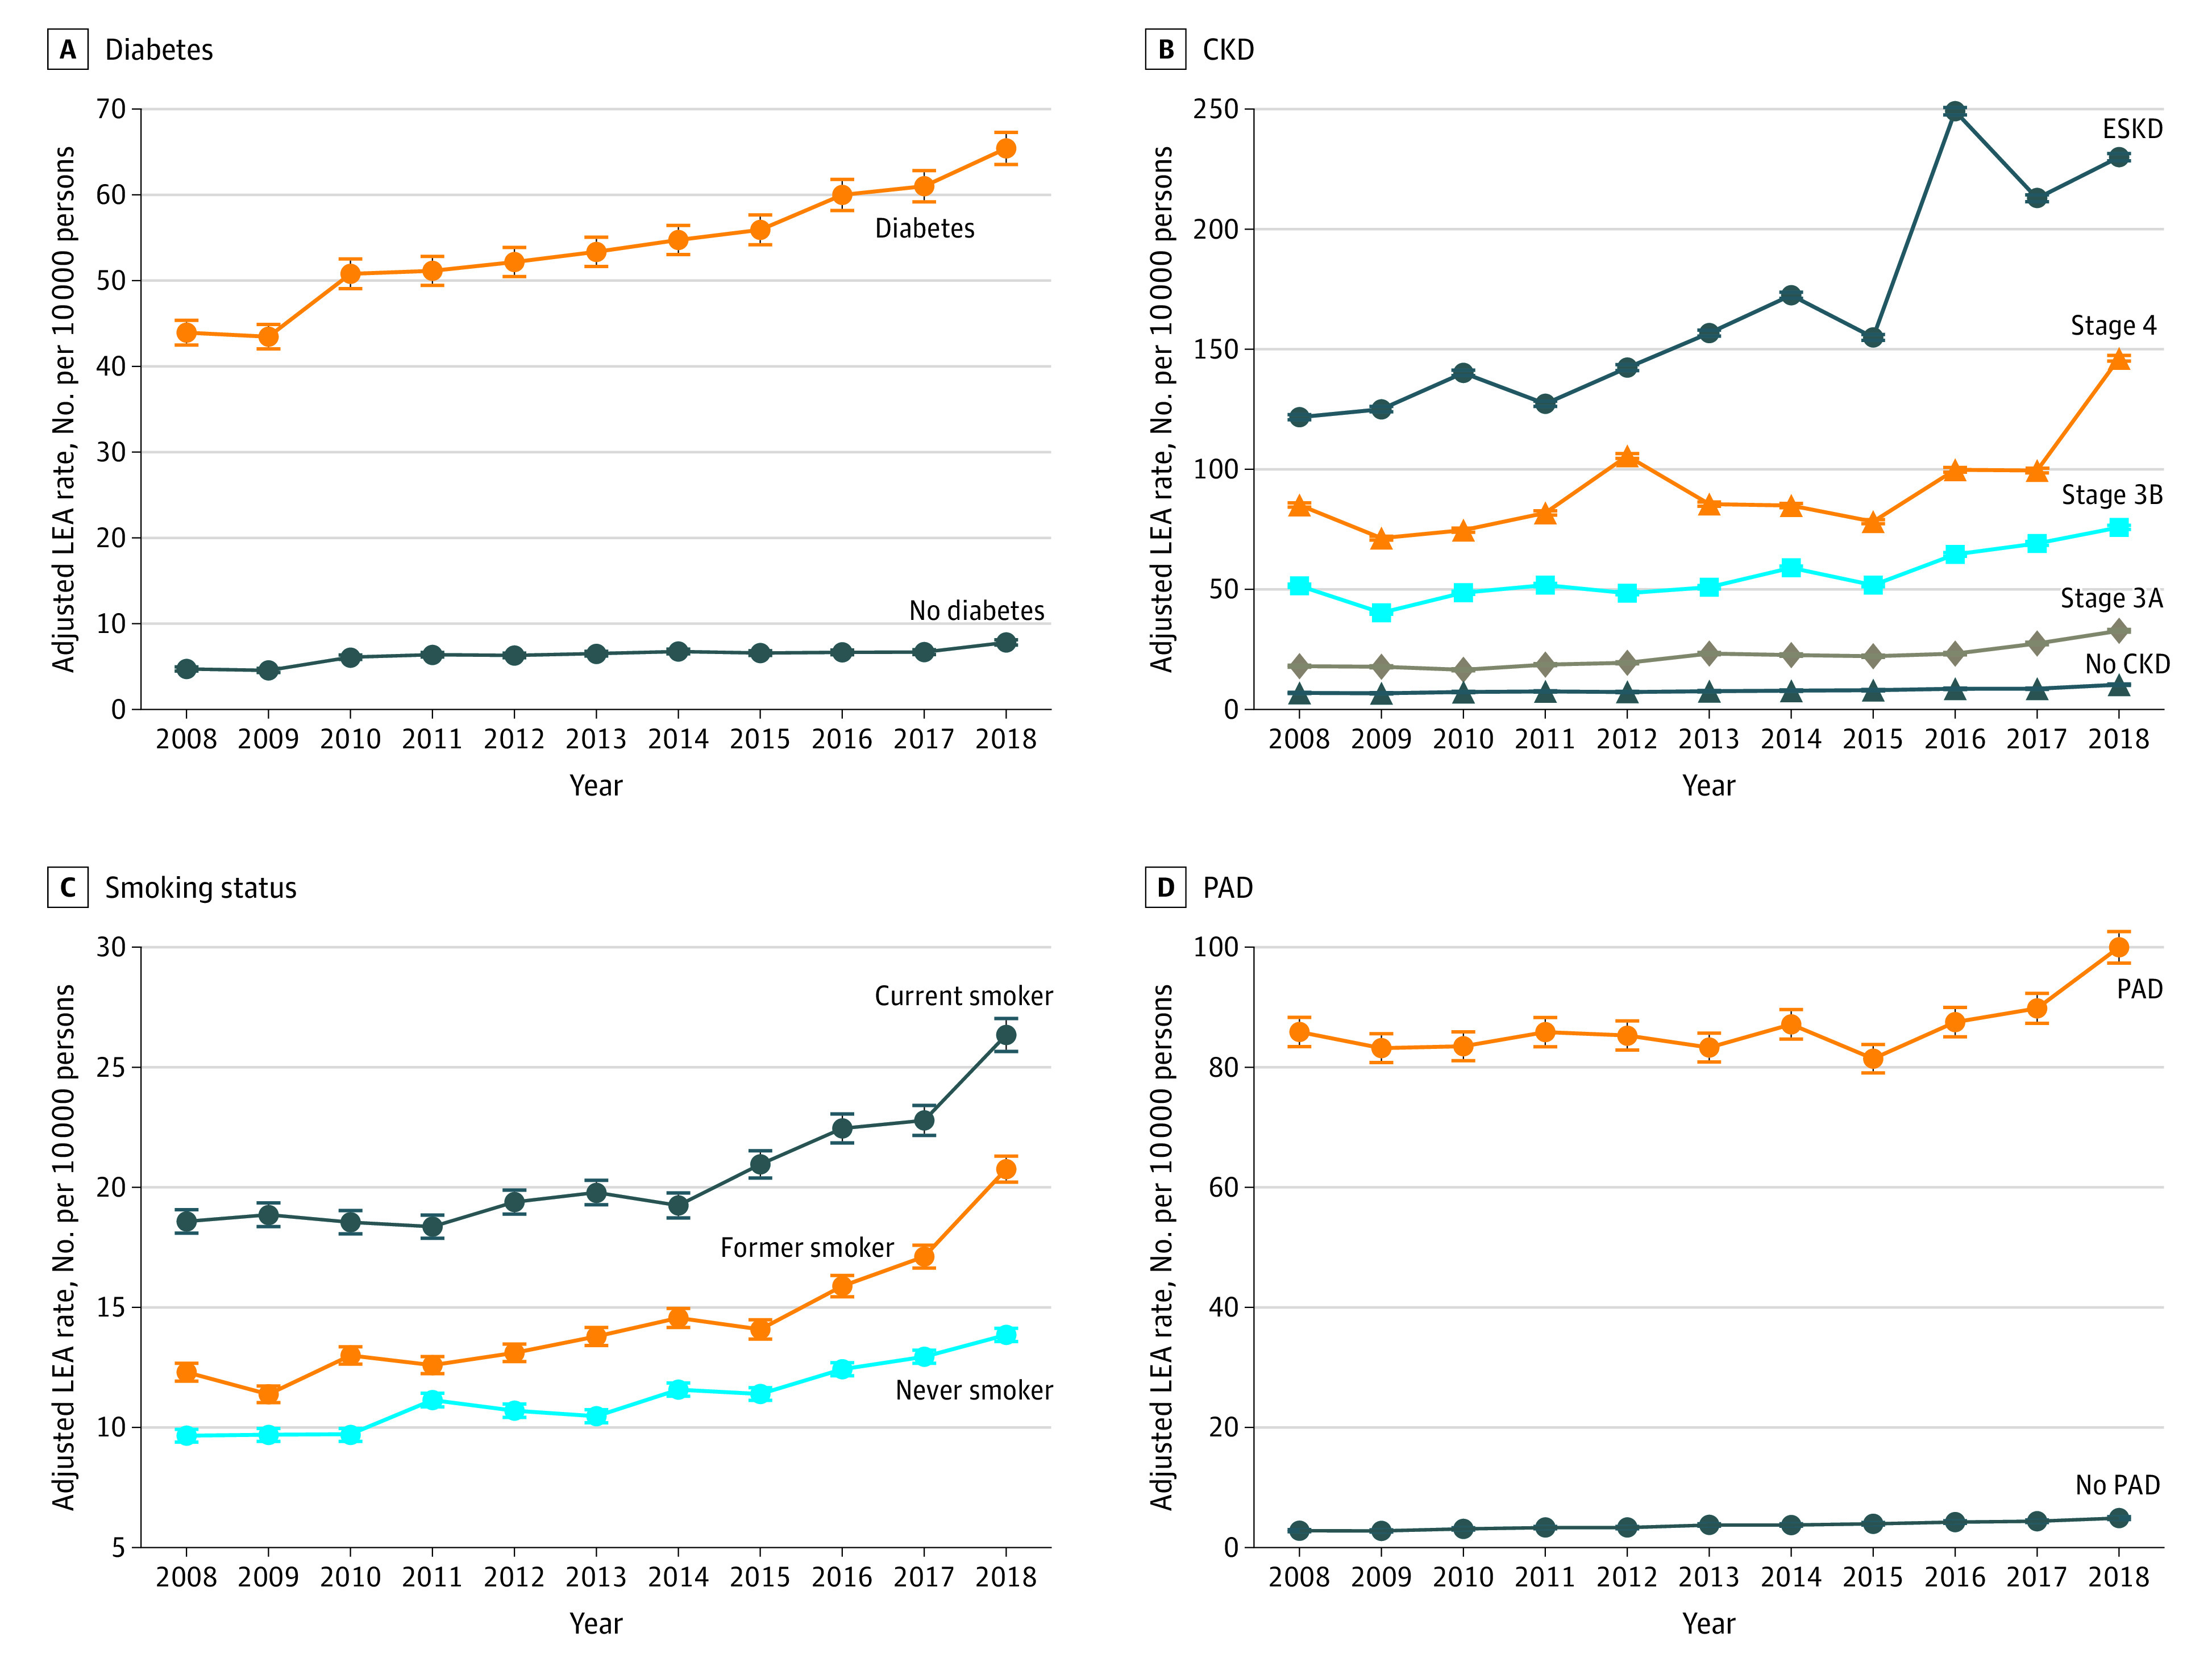
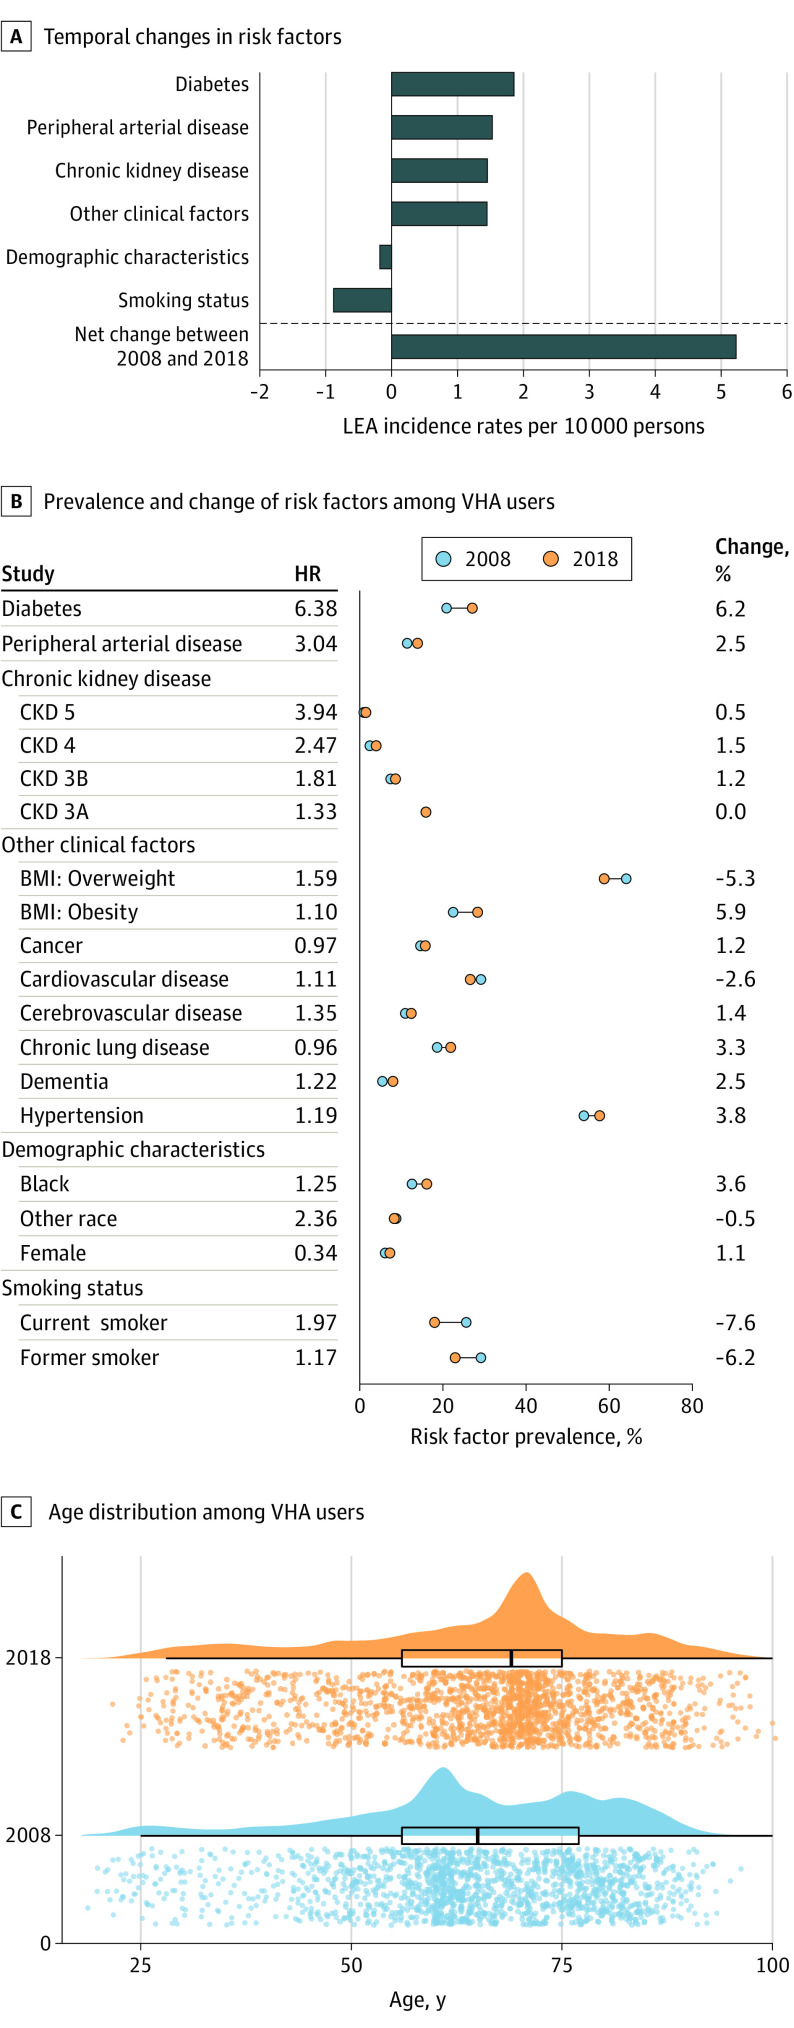
Results: A total of 6 493 141 veterans were included (median [interquartile range] age, 64 [54-76] years; 6 060 390 [93.4%] men). Veterans were studied for a median (interquartile range) of 10.9 (5.6-11.0) years. Between 2008 and 2018, rates of LEA increased from 12.89 (95% CI, 12.53-13.25) LEA per 10 000 persons to 18.12 (95% CI, 17.70-18.54) LEA per 10 000 persons, representing a net increase of 5.23 (95% CI, 4.68-5.78) LEA per 10 000 persons. Between 2008 and 2018, toe amputation rates increased by 3.24 (2.89-3.59) amputations per 10 000 persons, accounting for 62.0% of the total increase in LEA rates. Transmetatarsal amputations increased by 1.54 (95% CI, 1.27-1.81) amputations per 10 000 persons; below-knee amputation rates increased by 0.81 (95% CI, 0.56-1.05) amputations per 10 000 persons; and above-knee amputation rates decreased by 0.37 (95% CI, 0.14-0.59) amputations per 10 000 persons. Compared with men, women had decreased risk of any LEA (hazard ratio [HR], 0.34 [95% CI, 0.31-0.37]). Factors associated with increased risk of any LEA included Black race (HR, 1.25 [95% CI, 1.21-1.28]) or another non-White race (ie, Asian, Latino, or other; HR, 2.36 [95% CI, 2.30-2.42]), obesity (HR, 1.59 [95% CI, 1.55-1.63]), diabetes (HR, 6.38 [95% CI, 6.22-6.54]), chronic kidney disease (CKD; eg, CKD stage 5: HR, 3.94 [95% CI, 3.22-4.83]), and smoking status (eg, current smoking: HR, 1.97 [95% CI, 1.92-2.03]). Decomposition analyses suggested that while changes in demographic composition, primarily driven by increased proportion of women veterans, associated with a decrease of 0.18 (95% CI, 0.14-0.22) LEA per 10 000 persons, and decreases in smoking rates, associated with a decrease of 0.88 (95% CI, 0.79-0.97) LEA per 10 000 persons. However, these were overwhelmed by increased rates of diabetes, associated with an increase of 1.86 (95% CI, 1.72-1.99) LEA per 10 000 persons; peripheral arterial disease, associated with an increase of 1.53 (95% CI, 1.41-1.65) LEA per 10 000 persons; CKD, associated with an increase of 1.45 (95% CI, 1.33-1.57) LEA per 10 000 persons; and other clinical factors, including body mass index, cancer, cardiovascular disease, cerebrovascular disease, chronic lung disease, dementia, and hypertension, associated with an increase of 1.45 (95% CI, 1.33-1.57) LEA per 10 000 persons.
Conclusions and relevance: This cohort study found that incidence rates of LEA among veterans using VA services increased between 2008 and 2018. Efforts aimed at reducing burden of LEA should target the reduction of diabetes, peripheral arterial disease, and CKD at the individual and population levels.
Conflict of interest statement
Figures
References
-
- Norgren L, Hiatt WR, Dormandy JA, Nehler MR, Harris KA, Fowkes FG; TASC II Working Group . Inter-society consensus for the management of peripheral arterial disease (TASC II). J Vasc Surg. 2007;45(suppl S):S5-S67. - PubMed
Publication types
MeSH terms
Grants and funding
LinkOut - more resources
Full Text Sources
Other Literature Sources
