Visualization of the Oncolytic Alphavirus M1 Life Cycle in Cancer Cells
- PMID: 33481190
- PMCID: PMC8379316
- DOI: 10.1007/s12250-020-00339-7
Visualization of the Oncolytic Alphavirus M1 Life Cycle in Cancer Cells
Erratum in
-
Correction to: Visualization of the Oncolytic Alphavirus M1 Life Cycle in Cancer Cells.Virol Sin. 2021 Aug;36(4):830-831. doi: 10.1007/s12250-021-00429-0. Virol Sin. 2021. PMID: 34264508 Free PMC article. No abstract available.
Abstract
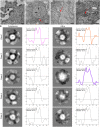
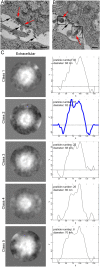
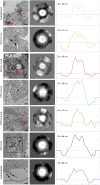
Oncolytic alphavirus M1 has been shown to selectively target and kill cancer cells, but cytopathic morphologies induced by M1 virus and the life cycle of the M1 strain in cancer cells remain unclear. Here, we study the key stages of M1 virus infection and replication in the M1 virus-sensitive HepG2 liver cancer cell line by transmission electron microscopy, specifically examining viral entry, assembly, maturation and release. We found that M1 virus induces vacuolization of cancer cells during infection and ultimately nuclear marginalization, a typical indicator of apoptosis. Specifically, our results suggest that the endoplasmic reticulum participates in the assembly of nucleocapsids. In the early and late stage of infection, three kinds of special cytopathic vacuoles are formed and appear to be involved in the replication, maturation and release of the virus. Taken together, our data displayed the process of M1 virus infection of tumor cells and provide the structural basis for the study of M1 virus-host interactions.
Keywords: Alphavirus; Electron microscopy; Life cycle of virus; M1; Oncolytic virus.
© 2021. Wuhan Institute of Virology, CAS.
Conflict of interest statement
The authors declare that they have no conflict of interest.
Figures


Similar articles
-
Real-Time Visualization and Quantification of Oncolytic M1 Virus In Vitro and In Vivo.Hum Gene Ther. 2021 Feb;32(3-4):158-165. doi: 10.1089/hum.2020.273. Hum Gene Ther. 2021. PMID: 33504253
-
The Identification and Development of a Novel Oncolytic Virus: Alphavirus M1.Hum Gene Ther. 2021 Feb;32(3-4):138-149. doi: 10.1089/hum.2020.271. Epub 2021 Jan 22. Hum Gene Ther. 2021. PMID: 33261513 Review.
-
Identification and characterization of alphavirus M1 as a selective oncolytic virus targeting ZAP-defective human cancers.Proc Natl Acad Sci U S A. 2014 Oct 21;111(42):E4504-12. doi: 10.1073/pnas.1408759111. Epub 2014 Oct 6. Proc Natl Acad Sci U S A. 2014. PMID: 25288727 Free PMC article.
-
A classical PKA inhibitor increases the oncolytic effect of M1 virus via activation of exchange protein directly activated by cAMP 1.Oncotarget. 2016 Jul 26;7(30):48443-48455. doi: 10.18632/oncotarget.10305. Oncotarget. 2016. PMID: 27374176 Free PMC article.
-
Crosstalk between oncolytic viruses and autophagy in cancer therapy.Biomed Pharmacother. 2021 Feb;134:110932. doi: 10.1016/j.biopha.2020.110932. Epub 2020 Dec 25. Biomed Pharmacother. 2021. PMID: 33370632 Review.
Cited by
-
Alphaviruses in Immunotherapy and Anticancer Therapy.Biomedicines. 2022 Sep 13;10(9):2263. doi: 10.3390/biomedicines10092263. Biomedicines. 2022. PMID: 36140364 Free PMC article. Review.
-
Nervous necrosis virus induced vacuolization is a Rab5- and actin-dependent process.Virulence. 2024 Dec;15(1):2301244. doi: 10.1080/21505594.2023.2301244. Epub 2024 Jan 17. Virulence. 2024. PMID: 38230744 Free PMC article.
References
MeSH terms
LinkOut - more resources
Full Text Sources
Other Literature Sources
Medical

