. 2022 Dec;37(10):893-906.
doi: 10.1089/cbr.2020.4242. Epub 2021 Jan 21.

Identification of a Prognostic Colorectal Cancer Model Including LncRNA FOXP4-AS1 and LncRNA BBOX1-AS1 Based on Bioinformatics Analysis

Affiliations

Identification of a Prognostic Colorectal Cancer Model Including LncRNA FOXP4-AS1 and LncRNA BBOX1-AS1 Based on Bioinformatics Analysis

Zhi-Liang Shi et al. Cancer Biother Radiopharm. 2022 Dec.

Abstract

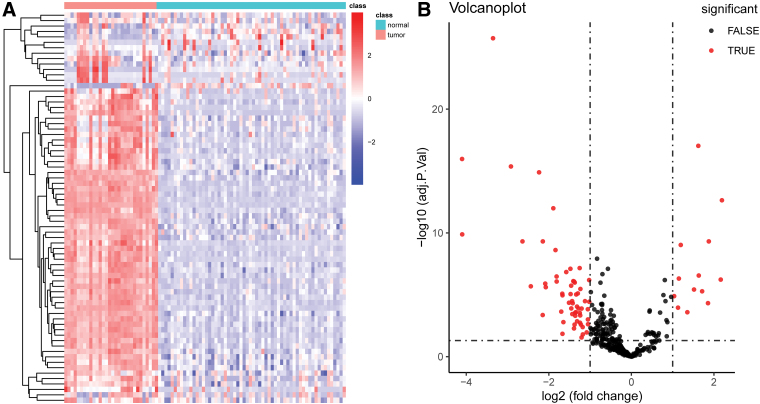
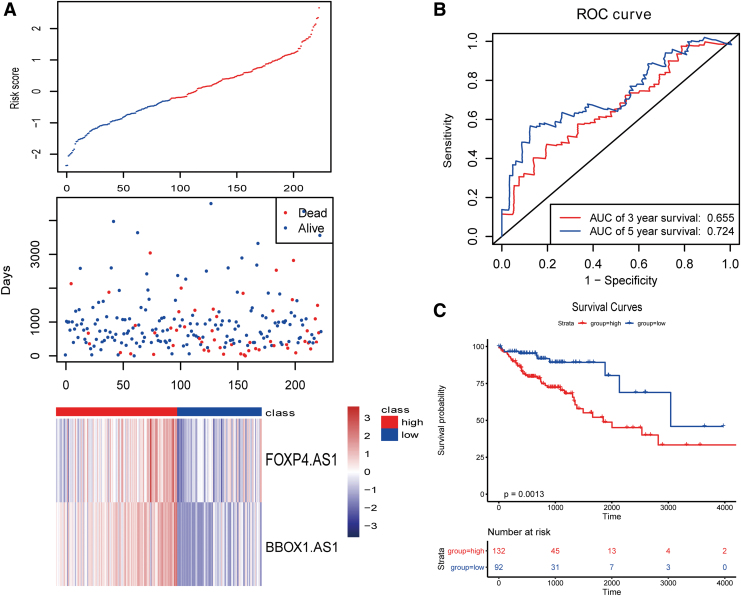
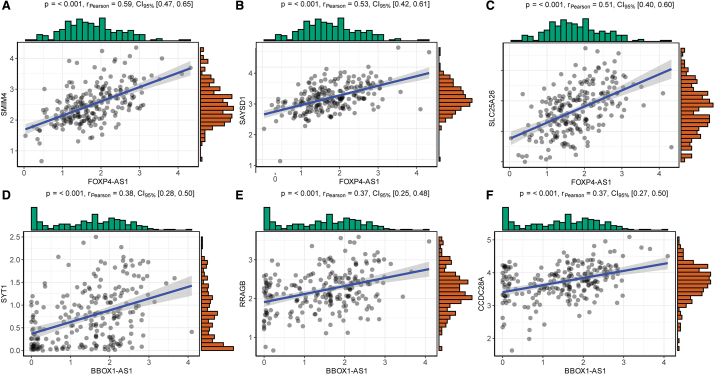
Background: Knowledge about the prognostic role of long noncoding RNA (lncRNA) in colorectal cancer (CRC) is limited. Therefore, we constructed a lncRNA-related prognostic model based on data from the Gene Expression Omnibus (GEO) and The Cancer Genome Atlas (TCGA). Materials and Methods: CRC transcriptome and clinical data were downloaded from the GSE20916 dataset and the TCGA database, respectively. R software was used for data processing and analysis. The differential lncRNA expression within the two datasets was first screened, and then intersections were measured. Cox regression and the Kaplan-Meier method were used to evaluate the effects of various factors on prognosis. The area under the curve (AUC) of the receiver operating characteristic curve and a nomogram based on multivariate Cox analysis were used to estimate the prognostic value of the lncRNA-related model. Gene Ontology (GO) and Kyoto Encyclopedia of Genes and Genomes (KEGG) enrichment analyses were applied to elucidate the significantly involved biological functions and pathways. Results: A total of 11 lncRNAs were crossed. The univariate Cox analysis screened out two lncRNAs, which were analyzed in the multivariate Cox analysis. A nomogram based on the two lncRNAs and other clinicopathological risk factors was constructed. The AUC of the nomogram was 0.56 at 3 years and 0.71 at 5 years. The 3-year nomogram model was compared with the ideal model, which showed that some indices of the 3-year model were consistent with the ideal model, suggesting that our model was highly accurate. The GO and KEGG enrichment analyses showed that positive regulation of secretion by cells, positive regulation of secretion, positive regulation of exocytosis, endocytosis, and the calcium signaling pathway were differentially enriched in the two-lncRNA-associated phenotype. Conclusions: A two-lncRNA prognostic model of CRC was constructed by bioinformatics analysis. The model had moderate prediction accuracy. LncRNA BBOX1-AS1 and lncRNA FOXP4-AS1 were identified as prognostic biomarkers.

Keywords: bioinformatics analysis; colorectal cancer; lncRNA; prognostic model.


Conflict of interest statement

No competing financial interests exist.

Figures

FIG. 1.
FIG. 1.
(A) Heatmap of the DElncRNAs in GSE20916. (B) Volcano diagram of the DElncRNAs in GSE20916. DElncRNAs, differentially expressed long noncoding RNAs. Color images are available online.
FIG. 2.
FIG. 2.
(A) Heatmap of the DElncRNAs in the TCGA dataset. (B) Volcano diagram of the DElncRNAs in TCGA dataset. TCGA, The Cancer Genome Atlas. Color images are available online.
FIG. 3.
FIG. 3.
Venn diagram of the GSE20916 and TCGA datasets. Color images are available online.
FIG. 4.
FIG. 4.
(A) The risk score diagram in the training dataset and heatmap of the screened lncRNAs expression. (B) The ROC curve of the model for 3 and 5 years in the training dataset. (C) Survival curve of the training dataset. ROC, receiver operating characteristic. Color images are available online.
FIG. 5.
FIG. 5.
(A) The risk score diagram in the validation set and heatmap of the screened lncRNAs expression. (B) The model in the test dataset for 3 and 5 years of ROC curves. (C) Survival curve of the validation set. Color images are available online.
FIG. 6.
FIG. 6.
(A) The risk score diagram in the total dataset and heatmap of the screened lncRNAs expression. (B) The 3- and 5-year ROC curve of the model in the total dataset. (C) Survival curve of the total dataset. Color images are available online.
FIG. 7.
FIG. 7.
(A) The survival curves of the pT stage. (B) The survival curves of the pN stage. (C) The survival curves of the pM stage. Color images are available online.
FIG. 8.
FIG. 8.
(A) Line diagram. (B) ROC curve of line diagram. (C) The calibration plots for predicting 3- and 5-year OS nomogram-predicted probability of survival is plotted on the x-axis; actual survival is plotted on the y-axis. (D–E) DCA curves of 3 and 5 years. OS, overall survival. Color images are available online.
FIG. 9.
FIG. 9.
LncRNA coexpressed regulatory network with mRNA Green represents target genes, and red represents lncRNA. mRNA, messenger RNA. Color images are available online.
FIG. 10.
FIG. 10.
Functional analysis of coexpressed mRNA (A). GO functional enrichment analysis (B). KEGG pathway enrichment analysis. GO, Gene Ontology; KEGG, Kyoto Encyclopedia of Genes and Genomes. Color images are available online.
FIG. 11.
FIG. 11.
(A) Correlation scatterplot of lncRNA FOXP4-AS1 and SMIM4. (B) Correlation scatterplot of lncRNA FOXP4-AS1 and SAYSD1. (C) Correlation scatterplot of lncRNA FOXP4-AS1 and SLC25A26. (D) Correlation scatterplot of lncRNA BBOX1-AS1 and SYT1. (E) Correlation scatterplot of lncRNA BBOX1-AS1 and RRAGB. (F) Correlation scatterplot of lncRNA BBOX1-AS1 and CCDC28A. Color images are available online.

Similar articles

Cited by

References

    1. Siegel RL, Miller KD, Jemal A. Cancer statistics, 2020. CA Cancer J Clin 2020;70:7. - PubMed
    1. Siegel RL, Miller KD, Goding Sauer A, et al. . Colorectal cancer statistics, 2020. CA Cancer J Clin 2020;70:145. - PubMed
    1. Zhu Z, Dong W. Overexpression of HHLA2, a member of the B7 family, is associated with worse survival in human colorectal carcinoma. Onco Targets Ther 2018;11:1563. - PMC - PubMed
    1. Lee SJ, Lee J, Park SH, et al. . c-MET overexpression in colorectal cancer: A poor prognostic factor for survival. Clin Colorectal Cancer 2018;17:165. - PubMed
    1. Kang S, Na Y, Joung SY, et al. . The significance of microsatellite instability in colorectal cancer after controlling for clinicopathological factors. Medicine (Baltimore) 2018;97:e0019. - PMC - PubMed

MeSH terms

LinkOut - more resources