. 2021 Jan 22;17(1):e1008499.
doi: 10.1371/journal.pcbi.1008499. eCollection 2021 Jan.

Contrasting mechanisms for hidden hearing loss: Synaptopathy vs myelin defects

Affiliations

Contrasting mechanisms for hidden hearing loss: Synaptopathy vs myelin defects

Maral Budak et al. PLoS Comput Biol. .

Erratum in

Abstract

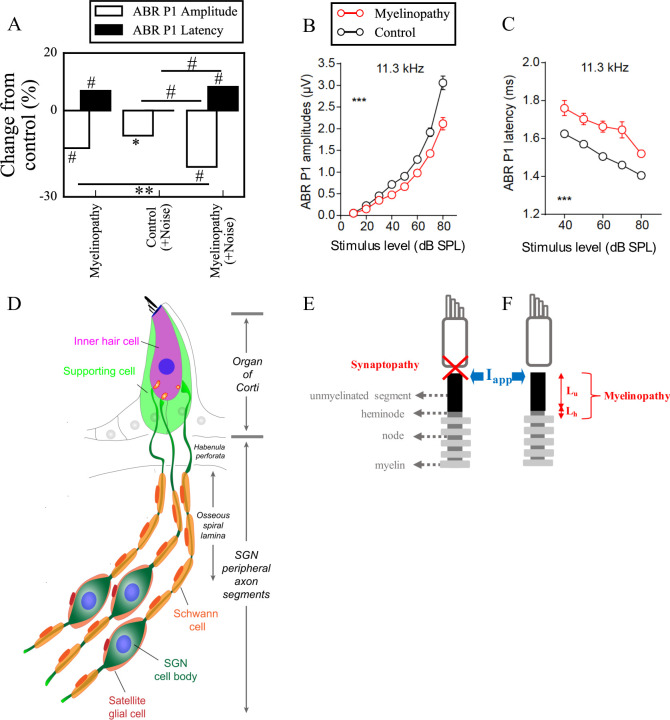
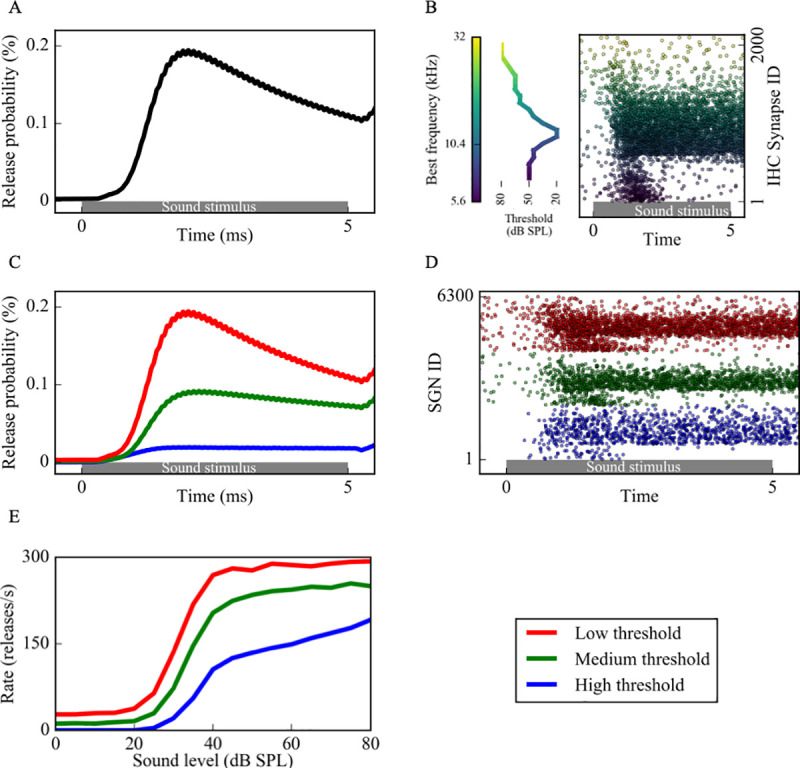
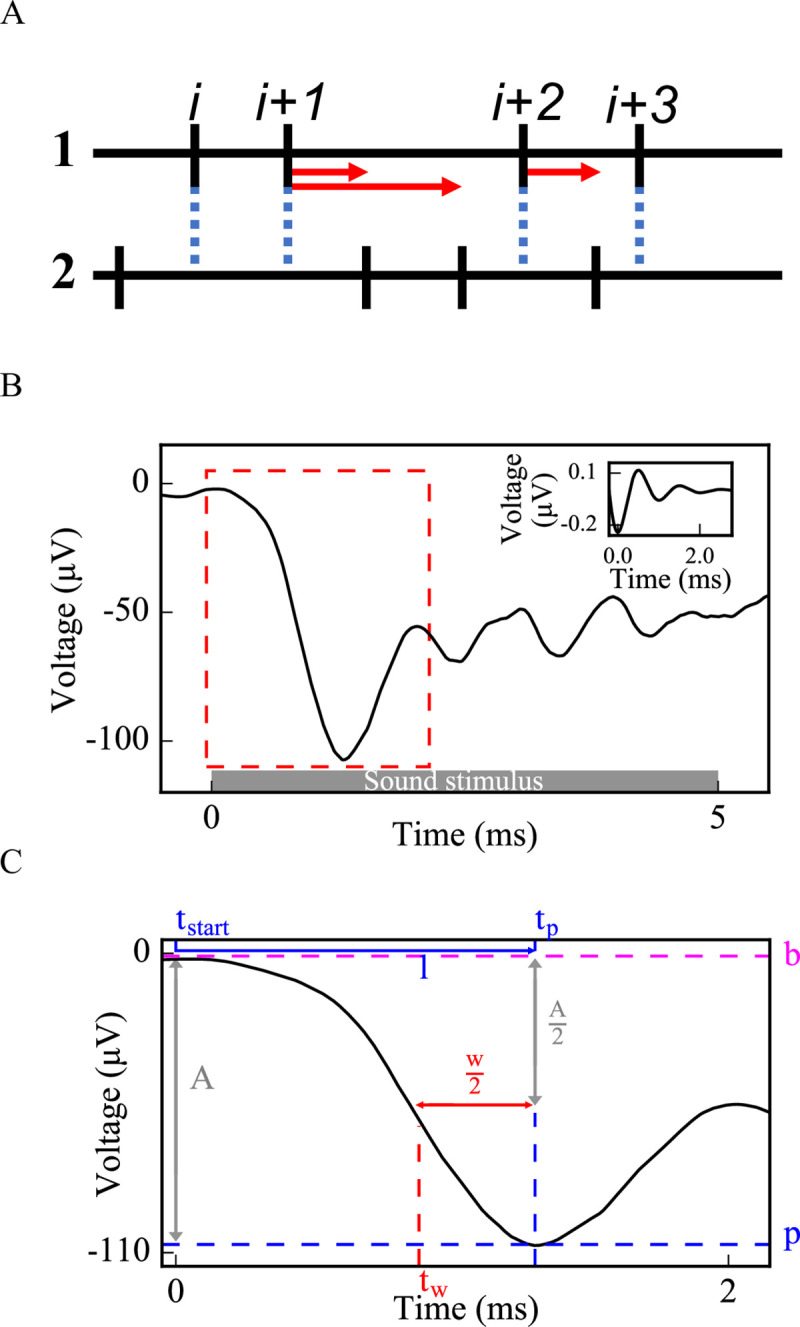
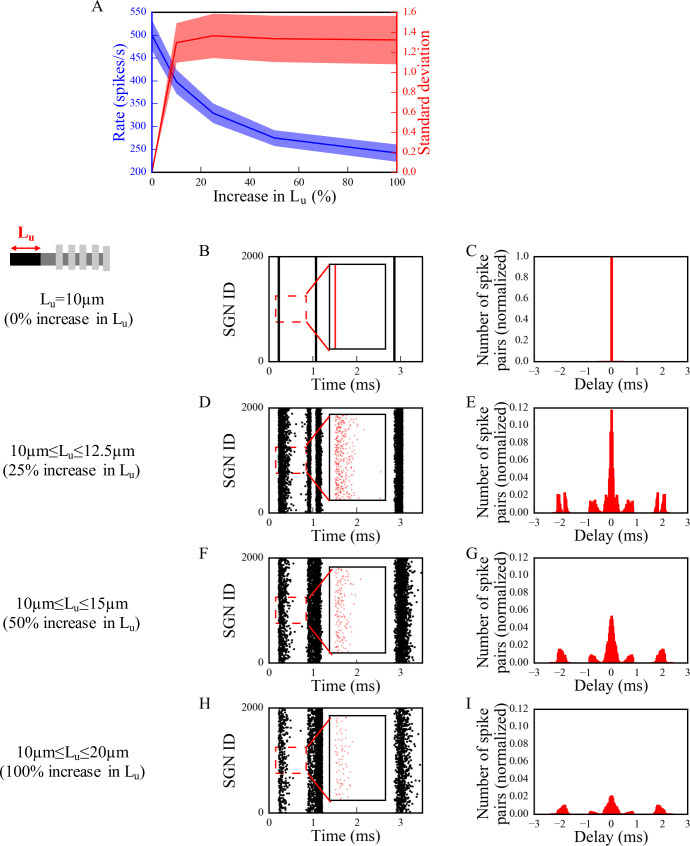
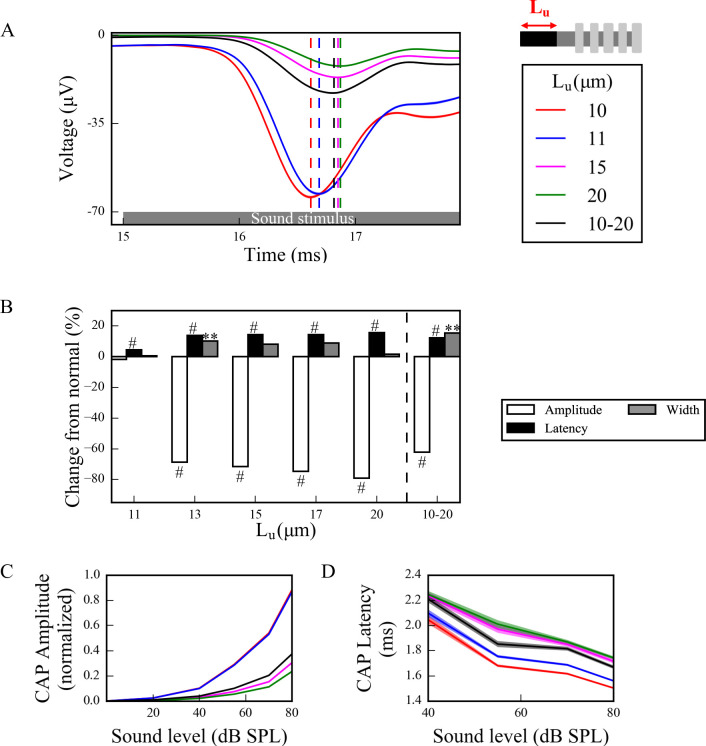
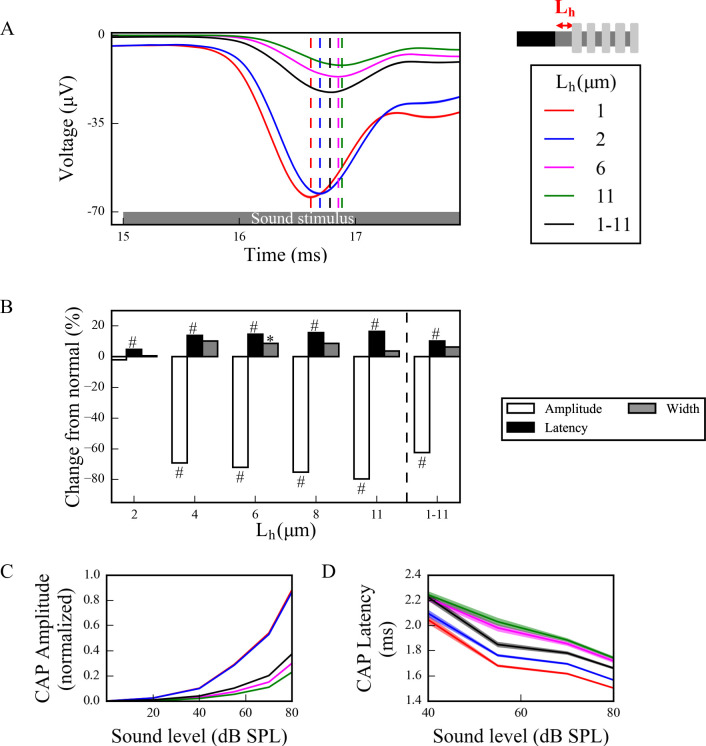
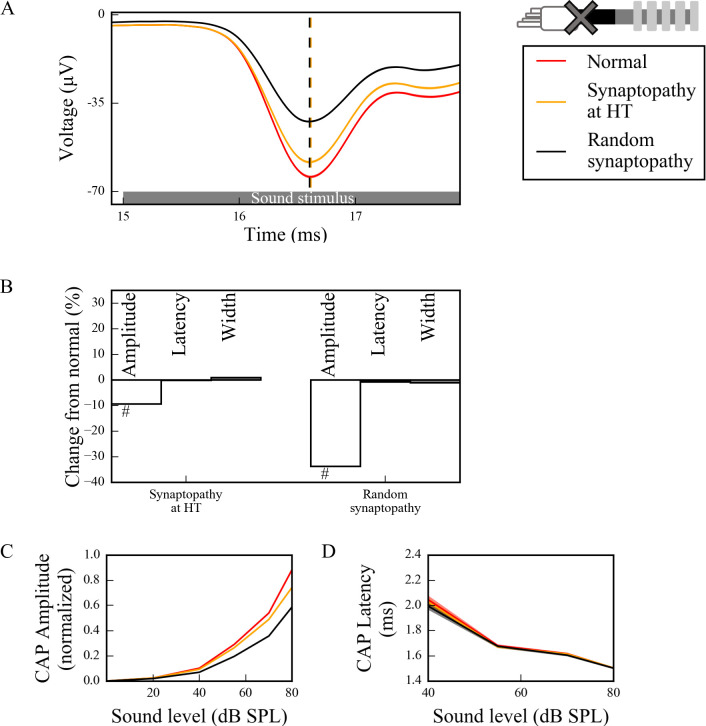
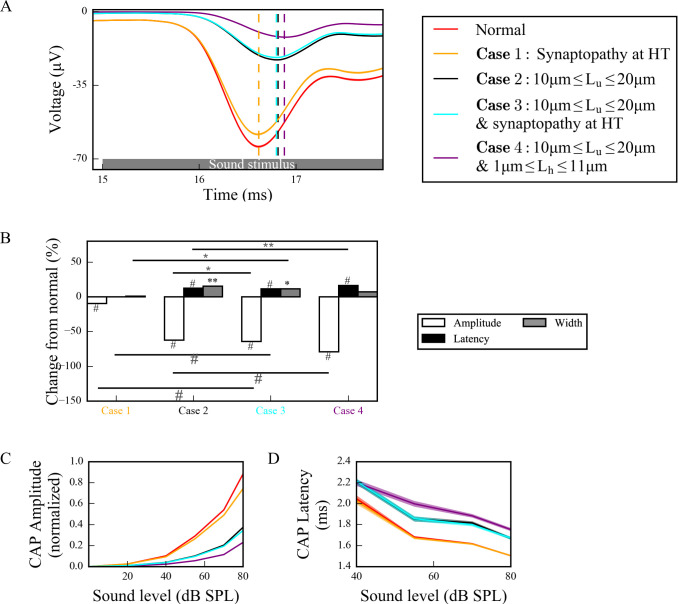
Hidden hearing loss (HHL) is an auditory neuropathy characterized by normal hearing thresholds but reduced amplitudes of the sound-evoked auditory nerve compound action potential (CAP). In animal models, HHL can be caused by moderate noise exposure or aging, which induces loss of inner hair cell (IHC) synapses. In contrast, recent evidence has shown that transient loss of cochlear Schwann cells also causes permanent auditory deficits in mice with similarities to HHL. Histological analysis of the cochlea after auditory nerve remyelination showed a permanent disruption of the myelination patterns at the heminode of type I spiral ganglion neuron (SGN) peripheral terminals, suggesting that this defect could be contributing to HHL. To shed light on the mechanisms of different HHL scenarios observed in animals and to test their impact on type I SGN activity, we constructed a reduced biophysical model for a population of SGN peripheral axons whose activity is driven by a well-accepted model of cochlear sound processing. We found that the amplitudes of simulated sound-evoked SGN CAPs are lower and have greater latencies when heminodes are disorganized, i.e. they occur at different distances from the hair cell rather than at the same distance as in the normal cochlea. These results confirm that disruption of heminode positions causes desynchronization of SGN spikes leading to a loss of temporal resolution and reduction of the sound-evoked SGN CAP. Another mechanism resulting in HHL is loss of IHC synapses, i.e., synaptopathy. For comparison, we simulated synaptopathy by removing high threshold IHC-SGN synapses and found that the amplitude of simulated sound-evoked SGN CAPs decreases while latencies remain unchanged, as has been observed in noise exposed animals. Thus, model results illuminate diverse disruptions caused by synaptopathy and demyelination on neural activity in auditory processing that contribute to HHL as observed in animal models and that can contribute to perceptual deficits induced by nerve damage in humans.


Conflict of interest statement

The authors have declared that no competing interests exist.

Figures

Fig 1
Fig 1. Mechanisms of hidden hearing loss.
(A) Experimental results suggest that different mechanisms of HHL, myelinopathy (left) and noise exposure resulting in synaptopathy (middle), affects ABR peak 1 (P1) in distinct ways: Myelinopathy increases ABR P1 latency and decreases ABR P1 amplitude, while synaptopathy induced by noise exposure decreases ABR P1 amplitude only, without any change in latency. Combined myelinopathy and synaptopathy induced by noise exposure show additive effects (right, data taken from [8]; *p<0.05, **p<0.01, #p<0.001). Figures in panels (B) and (C) taken from [8] show ABR P1 measures evoked by 11.3kHz sound stimuli at various sound levels for control and myelinopathy cases (*** p < 0.001 by two-way ANOVA). The decrease in ABR P1 amplitude (B) in case of myelinopathy is more pronounced for higher sound levels, whereas ABR P1 latencies (C) are increased for all sound levels. (D) Schematic illustration of type I SGNs, bipolar neurons innervating IHCs via myelinated peripheral projections. (E, F) Simulated peripheral fibers of type I SGNs (SGN fiber) consist of an unmyelinated segment at the peripheral end adjacent to the site of IHC synapses, followed by a heminode and 5 myelin sheaths with 4 nodes between them. Two mechanisms of hidden hearing loss are simulated: (E) synaptopathy, modeled by removing IHC-AN synapses, and (F) myelinopathy, modeled by varying the lengths of the unmyelinated segment (Lu) or the heminode (Lh).
Fig 2
Fig 2. Sound-evoked activity of low, medium and high threshold SGN fibers resulting from increased vesicle release probabilities from corresponding IHC-SGN synapses.
(A) Sound stimuli increased vesicle release probability from IHCs (as computed using the coupled (Eqs 12–22)) and release times were determined by a Poisson process. (B) Cumulative release events of an IHC synapse population with best frequencies (BFs) between 5.6kHz-32kHz in response to a 10kHz sound stimulus (right). The dots, color coded based on the BFs of the synapses, represent release times at each IHC synapse in a population of 2000. Since the thresholds of IHCs depend on their BFs (left), each synapse has a different release pattern. For each release event, the associated SGN fiber is stimulated with a brief external current pulse, resulting in spiking activity. (C) Three groups of SGN fibers, low (LT), medium (MT) and high (HT) threshold, were simulated based on their spontaneous firing rates and saturation profiles in response to sound. (D) Based on the release probabilities, different fiber types exhibit different cumulative responses (red dots: low threshold, green dots: medium threshold, blue dots: high threshold). Panels A-D are example simulations for simulated 80dB SPL 10kHz sound stimuli. (E) The increase in spike rates of simulated fiber type in response to increasing sound levels is comparable to Fig 3 of [12].
Fig 3
Fig 3
Methods used to evaluate cumulative activity of SGN fiber populations: pairwise spike time differences (A) and simulated CAP (B,C). (A) For each non-identical pair of spike trains (1 and 2) from an SGN fiber population, forward time intervals were measured between each spike i of spike train 1 and all spikes of spike train 2 falling between times of spikes i and i+1. Standard deviations of the distributions of these time intervals were calculated to evaluate synchronous spike timing in the SGN fiber population. (B) Each spike in Fig 2D was convolved with the unitary response of a CAP [the inset of (B)] and convolutions from each spike were summed up to obtain a simulated CAP of the SGN fiber population. (C) Amplitude, latency and width were measured from the first peak of the simulated CAP [dashed rectangle in (B) is zoomed in for (C)] (b: baseline, p: peak, A: amplitude of the peak, tp: peak time, l: latency, w: width, tw: half amplitude time before tp).
Fig 4
Fig 4. The synchronous activity of SGN fiber populations is disrupted and their response to sound is decreased with increasing levels of Lu heterogeneity.
SGN fiber populations with different heterogeneity levels of Lu were stimulated with 80dB sound stimulus at 0ms. We assumed release events from all IHCs for the population occurred simultaneously. Firing rate and standard deviations of time intervals are averaged for all populations in (A), shaded area represents the standard error of the mean. Raster plots [(B), (D), (F) and (H), insets: the first bursts of the raster plots] and corresponding histograms of time intervals between non-identical pairs of spike trains within a population normalized to the total number of spike pairs in panel B [(C), (E), (G) and (I)] are shown for populations of SGN fibers with Lu = 10μm (0% increase in Lu) [(B) and (C)], 10μm≤Lu≤12.5μm (25% increase in Lu) [(D) and (E)], 10μm≤Lu≤15μm (50% increase in Lu) [(F) and (G)] and 10μm≤ Lu≤20μm (100% increase in Lu) [(H) and (I)]. The ordinates of the histograms are normalized over the number of spike pairs with 0ms delay for the population where all fibers have Lu = 10μm (C). Simulations were done 10 times.
Fig 5
Fig 5. Longer Lu significantly decreases and delays the peak of the sound-evoked CAPs of SGN fibers.
(A) Sound-evoked CAPs of SGN fiber populations with varying unmyelinated segment length Lu at 70dB SPL, averaged over 50 simulations. Shaded regions correspond to the standard error of the mean and dashed lines correspond to the peaks of each CAP, labeled with the same colors as the CAPs. The decrease and delay of peak CAPs were significant for populations with Lu > 11 μm. (B) Comparison of CAP measures of each population relative to normal Lu (Lu = 10 μm) at 70 dB SPL. Latencies were significantly higher for populations with Lu>10 μm and peaks were significantly lower for populations with Lu>11 μm. The increases in widths were only minimal, however significant for the heterogeneous population, where 10 μm ≤ Lu ≤ 20 μm (*p<0.05, **p<0.01, #p<0.001). (C) Normalized CAP amplitudes for various sound levels exhibited an exponential increase and the decreases in CAP amplitudes for populations with Lu>11 μm were more pronounced for higher sound levels. (D) The latencies of CAP peaks increased with higher Lu for all sound levels and decreased along the sound levels.
Fig 6
Fig 6. Longer Lh significantly decreases and delays the peak of the sound-evoked CAPs of SGN fibers.
(A) Sound-evoked CAPs of SGN fiber populations of varying heminode length Lh at 70dB SPL, averaged over 50 simulations. Shaded regions correspond to the standard error of the mean and dashed lines correspond to the peaks of each CAP, labeled with the same colors as the CAPs. The decreased peak amplitude and increased latency of CAP peak were significant for populations with Lh > 2 μm. (B) Comparison of CAP measures of each population relative to the normal Lh (Lh = 1 μm) at 70 dB SPL. CAP latencies were significantly higher for populations with Lh>1 μm and peak amplitudes were significantly lower for populations with Lh>2 μm. The increases in widths were only minimal (*p<0.05, **p<0.01, #p<0.001). (C) Normalized CAP amplitudes exhibited an exponential increase and the decreases in CAP amplitudes of populations with Lh>2 μm were more pronounced for higher sound levels. (D) The latencies of CAP peaks increased with higher Lh for all sound levels and decreased along the sound levels.
Fig 7
Fig 7. Synaptopathy at IHC-SGN synapses decreases the peak of the CAP significantly, without changes to peak latency and width.
(A) Sound-evoked CAPs of SGN fiber populations with different synaptopathy scenarios at 70dB SPL, averaged over 50 simulations. Shaded regions correspond to the standard error of the mean and dashed lines correspond to the peaks of each CAP, labeled with the same colors as the CAPs. Synaptopathy had smaller effects on CAP peak amplitude and latency when it affected only HT fiber synapses compared to affecting all fiber types randomly. (B) Comparison of CAP measures of synaptopathy cases relative to normal (no synaptopathy) at 70 dB SPL (*p<0.05, **p<0.01, #p<0.001). (C) Normalized CAP amplitudes exhibited an exponential increase and the decreases in CAP amplitudes of populations with both synaptopathy scenarios were more pronounced for higher sound levels. The latencies of the CAP peaks did not exhibit any significant difference between different populations for all sound levels.
Fig 8
Fig 8. Different scenarios of hidden hearing loss have additive effects on SGN activity.
(A) Sound-evoked CAPs of SGN fiber populations with different myelinopathy and synaptopathy scenarios at 70dB SPL, averaged over 50 simulations (dashed lines correspond to the peaks of each CAP, labeled with the same colors as the CAPs). Combined synaptopathy and myelinopathy (Case 3) showed additive effects on the decrease in CAP peak amplitude, but not on the increase in CAP peak latency (compare to Cases 1 and 2). Combined different myelinopathies showed additive effects on both CAP peak amplitude and latency (compare Cases 2 and 4). (B) Comparison of average CAP measures for different myelinopathy and synaptopathy cases relative to normal, and between cases at 70 dB SPL (*p<0.05, **p<0.01, #p<0.001). Normalized CAP amplitudes (C) and CAP latencies (D) for different myelinopathy and synaptopathy cases for various sound levels, averaged over 50 simulations. Shaded areas correspond to the standard error of the mean.

Similar articles

Cited by

References

    1. Kohrman DC, Wan G, Cassinotti L, Corfas G. Hidden Hearing Loss: A Disorder with Multiple Etiologies and Mechanisms. Cold Spring Harb Perspect Med. 2019. Epub 2019/01/07. 10.1101/cshperspect.a035493 . - DOI - PMC - PubMed
    1. Prendergast G, Millman RE, Guest H, Munro KJ, Kluk K, Dewey RS, et al. Effects of noise exposure on young adults with normal audiograms II: Behavioral measures. Hear Res. 2017;356:74–86. Epub 2017/10/25. 10.1016/j.heares.2017.10.007 - DOI - PMC - PubMed
    1. Prendergast G, Guest H, Munro KJ, Kluk K, Léger A, Hall DA, et al. Effects of noise exposure on young adults with normal audiograms I: Electrophysiology. Hear Res. 2017;344:68–81. Epub 2016/11/02. 10.1016/j.heares.2016.10.028 - DOI - PMC - PubMed
    1. Liberman MC, Epstein MJ, Cleveland SS, Wang H, Maison SF. Toward a Differential Diagnosis of Hidden Hearing Loss in Humans. PLoS One. 2016;11(9):e0162726 Epub 2016/09/12. 10.1371/journal.pone.0162726 - DOI - PMC - PubMed
    1. Valderrama JT, Beach EF, Yeend I, Sharma M, Van Dun B, Dillon H. Effects of lifetime noise exposure on the middle-age human auditory brainstem response, tinnitus and speech-in-noise intelligibility. Hear Res. 2018;365:36–48. Epub 2018/06/12. 10.1016/j.heares.2018.06.003 . - DOI - PubMed

Publication types

LinkOut - more resources