. 2021 Jan 22;19(1):e3000998.
doi: 10.1371/journal.pbio.3000998. eCollection 2021 Jan.

Seipin traps triacylglycerols to facilitate their nanoscale clustering in the endoplasmic reticulum membrane

Affiliations

Seipin traps triacylglycerols to facilitate their nanoscale clustering in the endoplasmic reticulum membrane

Xavier Prasanna et al. PLoS Biol. .

Abstract

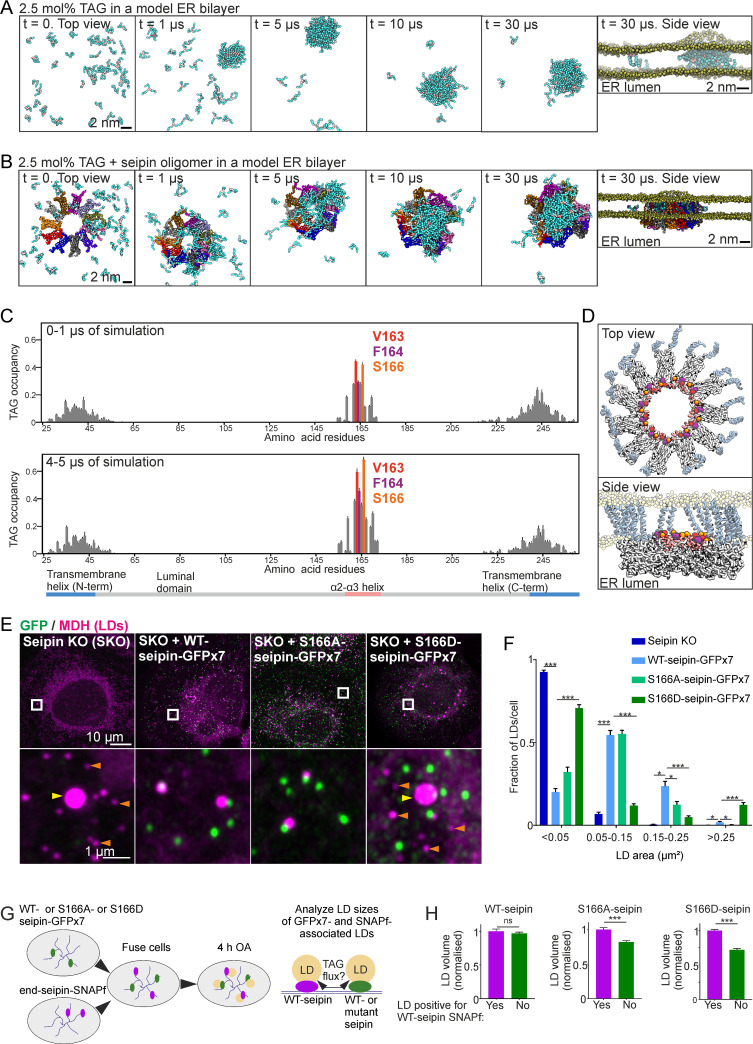
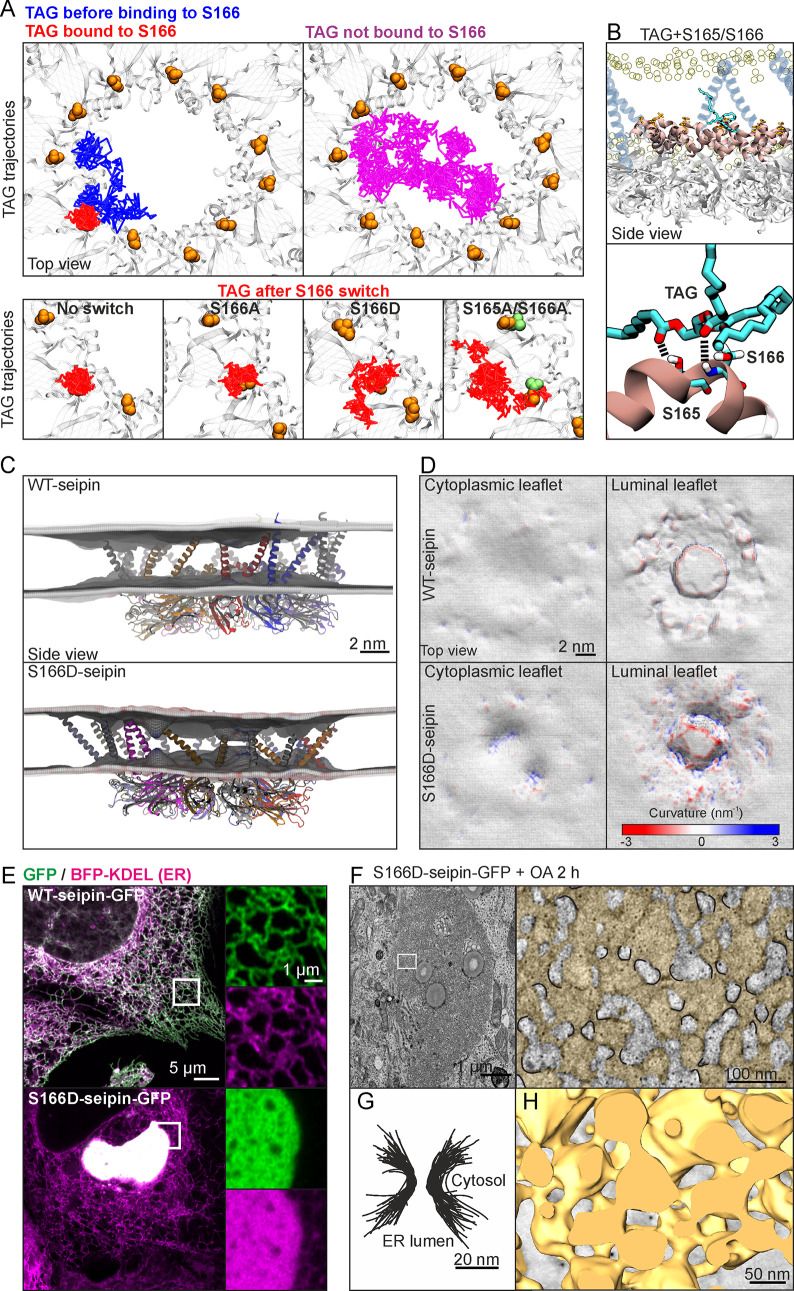
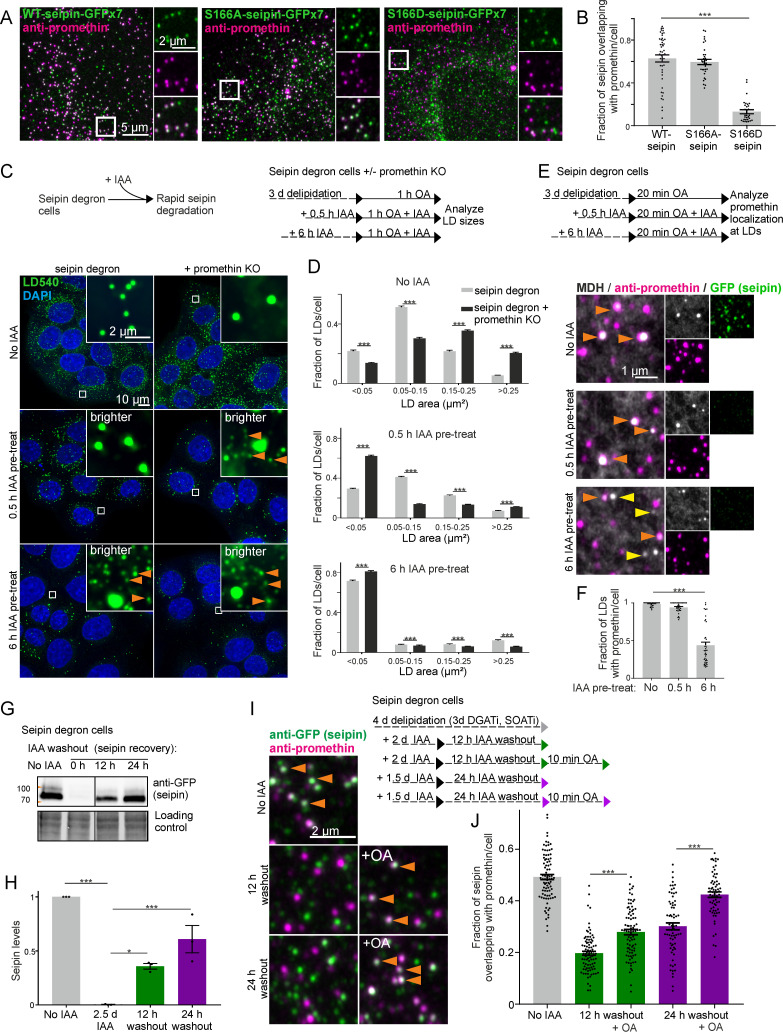
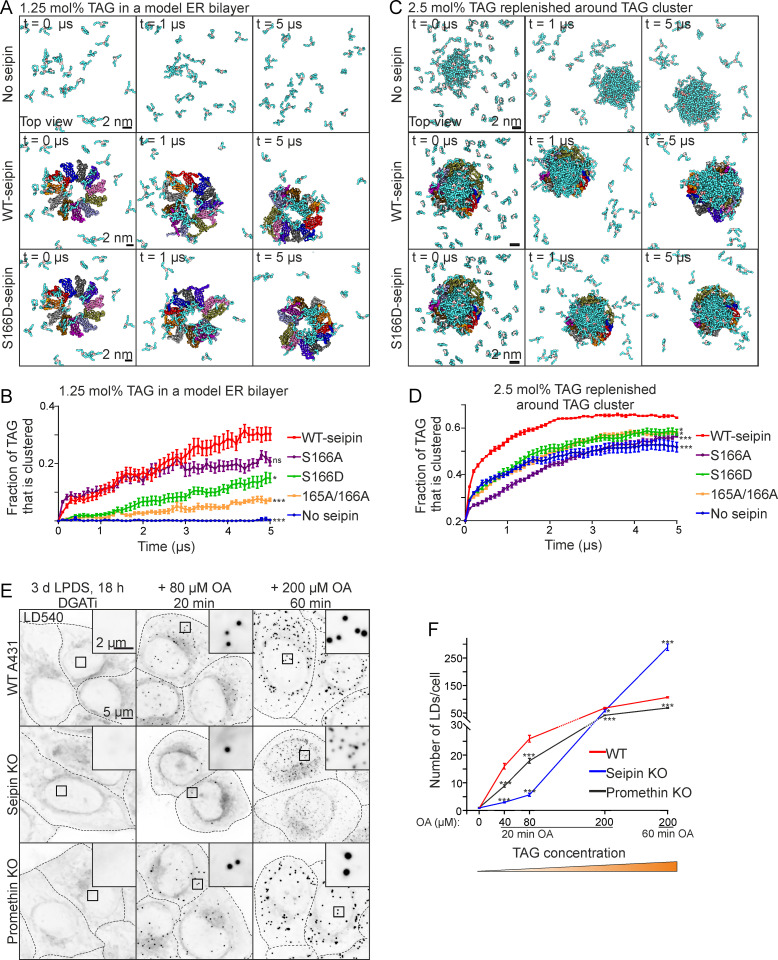
Seipin is a disk-like oligomeric endoplasmic reticulum (ER) protein important for lipid droplet (LD) biogenesis and triacylglycerol (TAG) delivery to growing LDs. Here we show through biomolecular simulations bridged to experiments that seipin can trap TAGs in the ER bilayer via the luminal hydrophobic helices of the protomers delineating the inner opening of the seipin disk. This promotes the nanoscale sequestration of TAGs at a concentration that by itself is insufficient to induce TAG clustering in a lipid membrane. We identify Ser166 in the α3 helix as a favored TAG occupancy site and show that mutating it compromises the ability of seipin complexes to sequester TAG in silico and to promote TAG transfer to LDs in cells. While the S166D-seipin mutant colocalizes poorly with promethin, the association of nascent wild-type seipin complexes with promethin is promoted by TAGs. Together, these results suggest that seipin traps TAGs via its luminal hydrophobic helices, serving as a catalyst for seeding the TAG cluster from dissolved monomers inside the seipin ring, thereby generating a favorable promethin binding interface.


Conflict of interest statement

The authors have declared that no competing interests exist.

Figures

Fig 1
Fig 1. The luminal hydrophobic helix is important for TAG clustering within the seipin disk.
(A) Snapshots of coarse-grained simulations in the absence of seipin with 2.5 mol% TAG in an ER bilayer. For clarity, PL head groups (yellow) are only shown in the side view, and water is not shown. The acyl chains of TAGs are shown in cyan; glycerol moiety is in light brown. (B) Snapshots of simulations as in (A), but in the presence of seipin. (C) TAG occupancy data of simulations demonstrated in (B). TAG occupancy for each amino acid residue is defined as the probability that the residue has a TAG molecule within 0.5 nm distance from its surface. The TAG occupancies for the initial (0–1 μs) and later (4–5 μs) stages of the simulation are plotted separately. Bars: mean ± SEM, n = 10 replicates. (D) Key residues from (C) are highlighted. (E) A431 SKO cells stably expressing indicated plasmids were delipidated for 3 d and treated with 200 μM OA for 1 h. Cells were fixed, LDs stained, and cells imaged by Airyscan microscopy. Maximum intensity projections of z-stacks. Orange arrowheads: tiny LDs; yellow arrowheads: supersized LDs. (F) Analysis of (E). Bars: mean ± SEM, n ≥ 60 cells/group, 3–4 experiments. Statistics: Kruskal–Wallis test followed by Dunn’s test, comparing against WT-seipin-GFPx7. (G) End-seipin-SNAPf cells and SKO cells stably expressing WT-, S166A-, or S166D-seipin-GFPx7 were co-plated for 2 d in delipidation conditions. Cells were fused with polyethylene glycol, and 12–14 h later 200 μM OA and SNAP-Cell 647-SiR were added to the cells. Four hours after this, LDs were stained with MDH, and fused cells were imaged live. (H) Analysis of (G). The sizes of end-seipin-SNAPf-associated LDs were compared to LDs within the same cell not positive for SNAPf. Bars: mean ± SEM, n = 152–659 LDs/group, 4–20 fused cells/group, 2 experiments. Statistics: Mann–Whitney test. Exemplary micrographs are shown in S1D Fig. Numerical values for the graphs in (C), (F), and (H) can be found in S1 Data. ER, endoplasmic reticulum; KO, knockout; LD, lipid droplet, MDH, monodansylpentane; mol%, mole percent; OA, oleic acid; SKO, seipin knockout; TAG, triacylglycerol; WT, wild-type.
Fig 2
Fig 2. S166D-seipin impairs TAG interaction and induces ER membrane deformation.
(A) Exemplary TAG trajectories from an atomistic simulation with a TAG cluster within the seipin disk. Blue indicates TAG trajectory prior to S166 binding (0–590 ns), red shows its trajectory upon S166 binding (591–960 ns). Magenta indicates the trajectory of TAG not interacting with S166 (0–960 ns). Lower row, left: higher magnification of S166-binding TAG trajectory. Lower row, other insets: TAG trajectories after indicated amino acid changes (trajectory lengths are 370 ns for all insets). Each line represents a series of in-plane 1-ns displacements. (B) Snapshot of the interface between a TAG molecule and S165 and S166. Hydrogen bonds between the carbonyl groups of the TAG molecule and S165 and S166 are represented by black dashed parallel lines. The α2–α3 helix is shown in beige. (C) Snapshots of atomistic simulations of WT- or S166-seipin, performed with 2.5 mol% TAG in the membrane. The time-averaged (>1 μs) mean curvature of bilayer leaflets from the plane of phospholipid head groups is shown. (D) Topologies and the mean curvature of the bilayer leaflets from (C) are shown. (E) A431 cells stably expressing BFP-KDEL were transfected with WT- or S166D-seipin-GFP for 3 d and imaged live by Airyscan microscopy. (F) HEK293A cells were transfected with S166D-seipin-GFP for 3 d in delipidation conditions and treated with 200 μM OA for 2 h. Transmission electron microscopy images of the membranous aggregates display periodical ER constrictions (indicated with black in the zoom-in; ER is colored with yellow). (G) Segmented membrane constrictions from (F) are overlaid. (H) Cells were treated as in (F) and imaged by electron tomography. A 3D model of the ER sacs (yellow) induced by S166D-seipin-GFP is shown. ER, endoplasmic reticulum; mol%, mole percent; OA, oleic acid; TAG, triacylglycerol; WT, wild-type.
Fig 3
Fig 3. Promethin sensitizes cells to seipin depletion, and TAG facilitates nascent seipin association with promethin.
(A) A431 seipin KO cells stably expressing indicated plasmids were fixed and stained with anti-promethin antibodies. (B) Analysis of (A). Bars: mean ± SEM, n ≥ 30 cells/group, 3–4 experiments. Statistics: Kruskal–Wallis test followed by Dunn’s test, comparing to WT-seipin. (C) Seipin degron cells with or without promethin KO were delipidated for 3 d, treated with IAA and 200 μM OA as indicated, fixed, stained, and imaged by widefield microscopy. Deconvolved maximum intensity projections of z-stacks. Orange arrowheads: tiny LDs. Note that 0.5-h IAA pretreatment is sufficient to induce generation of tiny LDs in promethin KO cells. (D) Analysis of (C). Bars: mean ± SEM, n > 500 cells/group, 3 experiments. Promethin KO data are pooled from 2 KO pools. Statistics: Mann–Whitney test. (E) Seipin degron cells were delipidated for 3 d, including the last 18 h in the presence of DGAT inhibitors. Cells were treated with IAA as indicated. The inhibitors were washed out, and cells were treated with 200 μM OA, fixed, stained with anti-promethin antibodies and MDH, and imaged by Airyscan microscopy. Crops of maximum intensity projections of Airyscan z-stacks. Orange arrowheads: LDs with promethin signal; yellow arrowheads: LDs without promethin signal. (F) Analysis of (E). Bars: mean ± SEM, n ≥ 29 cells/group, 2 experiments. Statistics: Kruskal–Wallis test followed by Dunn’s test, comparing to no IAA treatment. (G) Immunoblot of seipin levels in seipin degron cells after IAA washout as indicated. Note the recovery of seipin levels upon IAA washout. (H) Analysis of (G). Bars: mean ± SEM, n = 3 biological replicates from 2 experiments. Statistics: 1-way ANOVA followed by Tukey’s post hoc test. (I) Seipin degron cells were delipidated and treated with IAA and OA as indicated. DGAT and SOAT inhibitors were washed out prior to OA addition. Cells were fixed, stained with antibodies, and imaged. Crops from maximum projections of Airyscan z-stacks. Orange arrowheads: seipin foci overlapping with promethin. (J) Analysis of (I). Bars: mean ± SEM, n > 60 cells/group. Data are pooled from 4 experiments, 2 using anti-GFP and 2 using anti-degron tag antibodies for seipin detection. Statistics: Kruskal–Wallis test followed by Dunn’s test. Numerical values for the graphs in (B), (D), (F), (H), and (J) can be found in S1 Data. DGATi, DGAT inhibitor; ER, endoplasmic reticulum; IAA, indole-3-acetic acid; KO, knockout; LD, lipid droplet; MDH, monodansylpentane; mol%, mole percent; OA, oleic acid; SOATi, SOAT inhibitor; TAG, triacylglycerol; WT, wild-type.
Fig 4
Fig 4. Seipin promotes the nanoscale clustering of TAGs and LD biogenesis at low TAG concentration.
(A) Snapshots of coarse-grained simulations with 1.25 mol% TAG in the bilayer. Same color coding as in Fig 1A. (B) Analysis of simulations carried out as in (A). Data points: mean ± SEM, n = 10 simulations/system. Statistics are based on the final time points of analysis using Kruskal–Wallis test followed by Dunn’s test, comparing to WT-seipin. (C) Snapshots of coarse-grained simulations with an initial TAG cluster and the rest of the model bilayer replenished with 2.5 mol% TAG (total TAG concentration 4.85 mol%). (D) Analysis of simulations carried out as in (C). Data points: mean ± SEM, n = 10 simulations/system. Kruskal–Wallis test followed by Dunn’s test; statistics based on the final time points of analysis, comparing to WT-seipin. (E) Cells were delipidated for 3 d, including 18 h in the presence of DGAT inhibitors. The inhibitors were washed out, and cells were treated with OA as indicated, fixed, stained, and imaged by widefield microscopy. Deconvolved maximum intensity projections of z-stacks. (F) Analysis of (E). Data points: mean ± SEM, n > 250 cells/group, 2 experiments. Statistics: 1-way ANOVA followed by Tukey’s post hoc test, comparison to WT cells. Note that the y-axis is discontinuous. Numerical values for the graphs in (B), (D), and (F) can be found in S1 Data. DGATi, DGAT inhibitor; ER, endoplasmic reticulum; KO, knockout; LD, lipid droplet; LPDS, lipoprotein deficient serum; mol%, mole percent; OA, oleic acid; TAG, triacylglycerol; WT, wild-type.

References

    1. Olzmann JA, Carvalho P (2019) Dynamics and functions of lipid droplets. Nat Rev Mol Cell Biol. 20:137–55. 10.1038/s41580-018-0085-z - DOI - PMC - PubMed
    1. Henne WM, Reese ML, Goodman JM (2018) The assembly of lipid droplets and their roles in challenged cells. EMBO J. 37:e98947 10.15252/embj.201898947 - DOI - PMC - PubMed
    1. Jackson CL (2019) Lipid droplet biogenesis. Curr Opin Cell Biol. 59:88–96. 10.1016/j.ceb.2019.03.018 - DOI - PubMed
    1. Henne M, Goodman JM, Hariri H (2020) Spatial compartmentalization of lipid droplet biogenesis. Biochim Biophys Acta Mol Cell Biol Lipids. 1865:158499 10.1016/j.bbalip.2019.07.008 - DOI - PMC - PubMed
    1. Walther T, Chung J, Farese RV Jr (2017) Lipid droplet biogenesis. Annu Rev Cell Dev Biol. 33:491–510. 10.1146/annurev-cellbio-100616-060608 - DOI - PMC - PubMed

Publication types

MeSH terms