

Transmission dynamics and control of COVID-19 in Chile, March-October, 2020
- PMID: 33481804
- PMCID: PMC7857594
- DOI: 10.1371/journal.pntd.0009070
Transmission dynamics and control of COVID-19 in Chile, March-October, 2020
Abstract
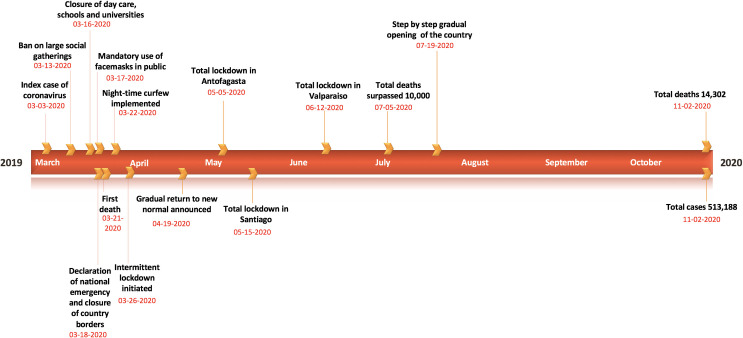
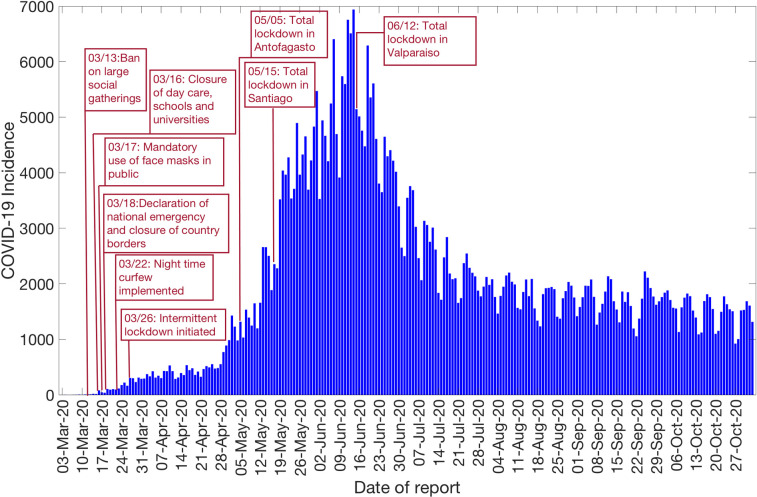
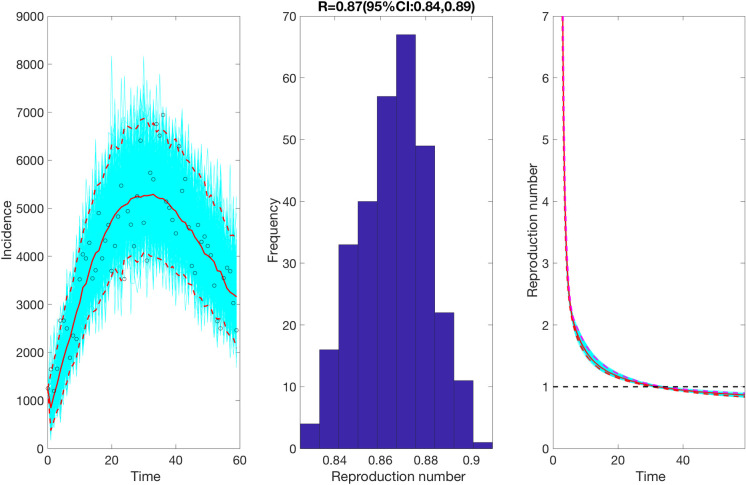
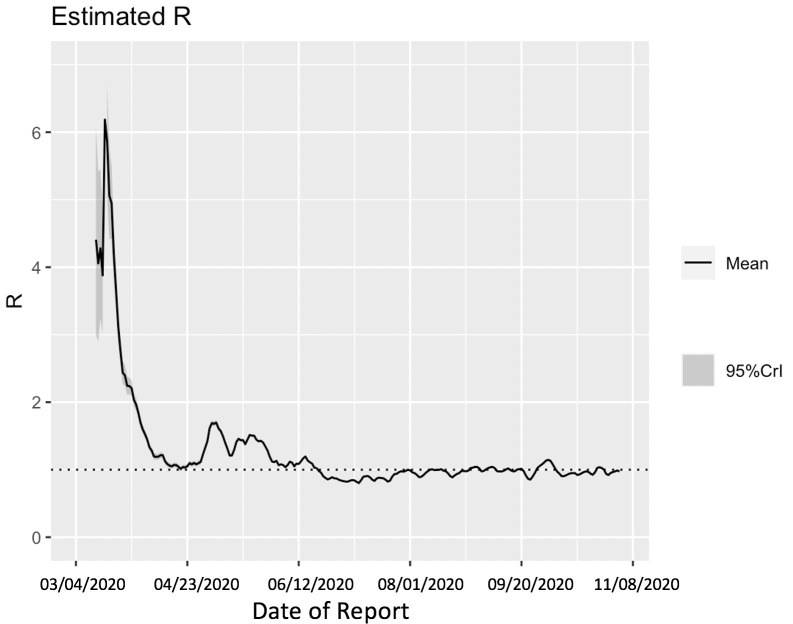
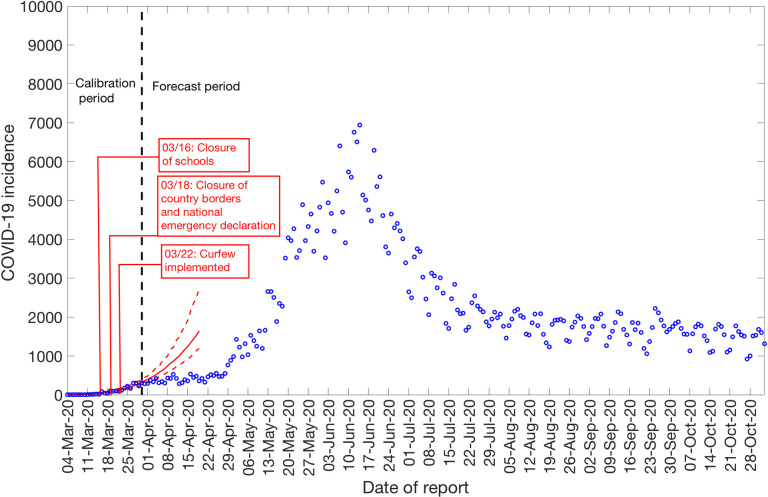
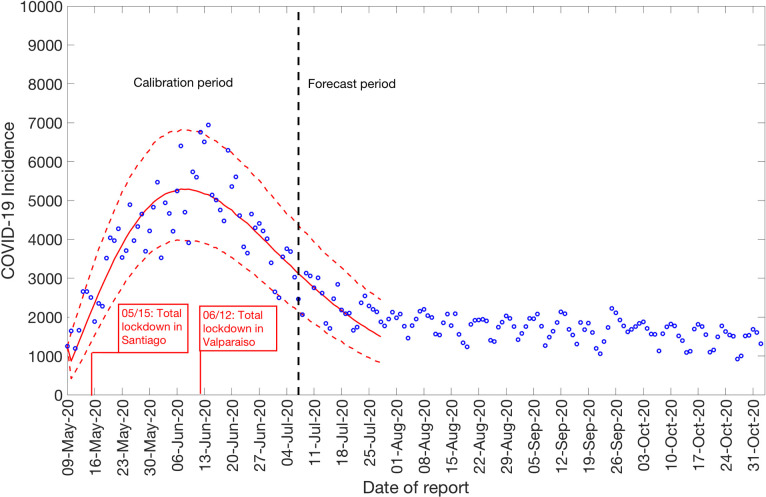
Since the detection of the first case of COVID-19 in Chile on March 3rd, 2020, a total of 513,188 cases, including ~14,302 deaths have been reported in Chile as of November 2nd, 2020. Here, we estimate the reproduction number throughout the epidemic in Chile and study the effectiveness of control interventions especially the effectiveness of lockdowns by conducting short-term forecasts based on the early transmission dynamics of COVID-19. Chile's incidence curve displays early sub-exponential growth dynamics with the deceleration of growth parameter, p, estimated at 0.8 (95% CI: 0.7, 0.8) and the reproduction number, R, estimated at 1.8 (95% CI: 1.6, 1.9). Our findings indicate that the control measures at the start of the epidemic significantly slowed down the spread of the virus. However, the relaxation of restrictions and spread of the virus in low-income neighborhoods in May led to a new surge of infections, followed by the reimposition of lockdowns in Greater Santiago and other municipalities. These measures have decelerated the virus spread with R estimated at ~0.96 (95% CI: 0.95, 0.98) as of November 2nd, 2020. The early sub-exponential growth trend (p ~0.8) of the COVID-19 epidemic transformed into a linear growth trend (p ~0.5) as of July 7th, 2020, after the reimposition of lockdowns. While the broad scale social distancing interventions have slowed the virus spread, the number of new COVID-19 cases continue to accrue, underscoring the need for persistent social distancing and active case detection and isolation efforts to maintain the epidemic under control.
Conflict of interest statement
The authors have declared that no competing interests exist.
Figures

Update of
-
Transmission dynamics and control of COVID-19 in Chile, March-October, 2020.medRxiv [Preprint]. 2020 Dec 15:2020.05.15.20103069. doi: 10.1101/2020.05.15.20103069. medRxiv. 2020. Update in: PLoS Negl Trop Dis. 2021 Jan 22;15(1):e0009070. doi: 10.1371/journal.pntd.0009070. PMID: 33354684 Free PMC article. Updated. Preprint.
Similar articles
-
Transmission dynamics and control of COVID-19 in Chile, March-October, 2020.medRxiv [Preprint]. 2020 Dec 15:2020.05.15.20103069. doi: 10.1101/2020.05.15.20103069. medRxiv. 2020. Update in: PLoS Negl Trop Dis. 2021 Jan 22;15(1):e0009070. doi: 10.1371/journal.pntd.0009070. PMID: 33354684 Free PMC article. Updated. Preprint.
-
Early transmission dynamics of COVID-19 in a southern hemisphere setting: Lima-Peru: February 29th-March 30th, 2020.medRxiv [Preprint]. 2020 May 8:2020.04.30.20077594. doi: 10.1101/2020.04.30.20077594. medRxiv. 2020. Update in: Infect Dis Model. 2020 May 12;5:338-345. doi: 10.1016/j.idm.2020.05.001. PMID: 32511517 Free PMC article. Updated. Preprint.
-
Early transmission dynamics of COVID-19 in a southern hemisphere setting: Lima-Peru: February 29th-March 30th, 2020.Infect Dis Model. 2020 May 12;5:338-345. doi: 10.1016/j.idm.2020.05.001. eCollection 2020. Infect Dis Model. 2020. PMID: 32399507 Free PMC article.
-
Effect of national and local lockdowns on the control of COVID-19 pandemic: a rapid review.Epidemiol Prev. 2020 Sep-Dec;44(5-6 Suppl 2):60-68. doi: 10.19191/EP20.5-6.S2.104. Epidemiol Prev. 2020. PMID: 33412795 Review. English.
-
Effectiveness of non-pharmaceutical public health interventions against COVID-19: A systematic review and meta-analysis.PLoS One. 2021 Nov 23;16(11):e0260371. doi: 10.1371/journal.pone.0260371. eCollection 2021. PLoS One. 2021. PMID: 34813628 Free PMC article.
Cited by
-
Implementation of a Teledentistry Platform for Dental Emergencies for the Elderly in the Context of the COVID-19 Pandemic in Chile.Biomed Res Int. 2022 Mar 22;2022:6889285. doi: 10.1155/2022/6889285. eCollection 2022. Biomed Res Int. 2022. PMID: 35330690 Free PMC article.
-
Antibiotic Consumption During the Coronavirus Disease 2019 Pandemic and Emergence of Carbapenemase-Producing Klebsiella pneumoniae Lineages Among Inpatients in a Chilean Hospital: A Time-Series Study and Phylogenomic Analysis.Clin Infect Dis. 2023 Jul 5;77(Suppl 1):S20-S28. doi: 10.1093/cid/ciad151. Clin Infect Dis. 2023. PMID: 37406053 Free PMC article.
-
Impact of the COVID-19 pandemic on osteoporotic hip fractures in Chile.Arch Osteoporos. 2022 Sep 30;17(1):130. doi: 10.1007/s11657-022-01165-y. Arch Osteoporos. 2022. PMID: 36178593 Free PMC article.
-
An investigation of spatial-temporal patterns and predictions of the coronavirus 2019 pandemic in Colombia, 2020-2021.PLoS Negl Trop Dis. 2022 Mar 4;16(3):e0010228. doi: 10.1371/journal.pntd.0010228. eCollection 2022 Mar. PLoS Negl Trop Dis. 2022. PMID: 35245285 Free PMC article.
-
The job of public transport, ride-hailing and delivery drivers: Conditions during the COVID-19 pandemic and implications for a post-pandemic future.Travel Behav Soc. 2023 Apr;31:63-77. doi: 10.1016/j.tbs.2022.11.004. Epub 2022 Nov 11. Travel Behav Soc. 2023. PMID: 36405769 Free PMC article.
References
-
- World Health Organization. WHO Director-General's opening remarks at the media briefing on COVID-19-11 March 2020 World Health Organization; 2020. [April 23]. Available from: https://bit.ly/2A8aCIO.
-
- Li Y, Campbell H, Kulkarni D, Harpur A, Nundy M, Wang X, et al. The temporal association of introducing and lifting non-pharmaceutical interventions with the time-varying reproduction number (R) of SARS-CoV-2: a modelling study across 131 countries. Lancet Infect Dis. 2020. Epub October 22. 10.1016/S1473-3099(20)30785-4. - DOI - PMC - PubMed
Publication types
MeSH terms
Grants and funding
LinkOut - more resources
Full Text Sources
Other Literature Sources
Medical
