. 2021 Jan 22;16(1):e0245669.
doi: 10.1371/journal.pone.0245669. eCollection 2021.

Forecasting hospital demand in metropolitan areas during the current COVID-19 pandemic and estimates of lockdown-induced 2nd waves

Affiliations

Forecasting hospital demand in metropolitan areas during the current COVID-19 pandemic and estimates of lockdown-induced 2nd waves

Marcos A Capistran et al. PLoS One. .

Abstract

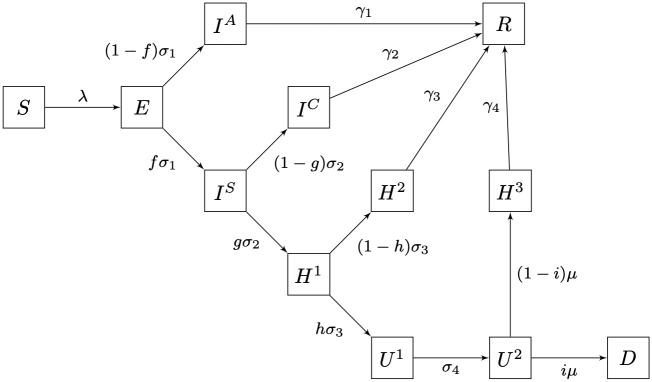
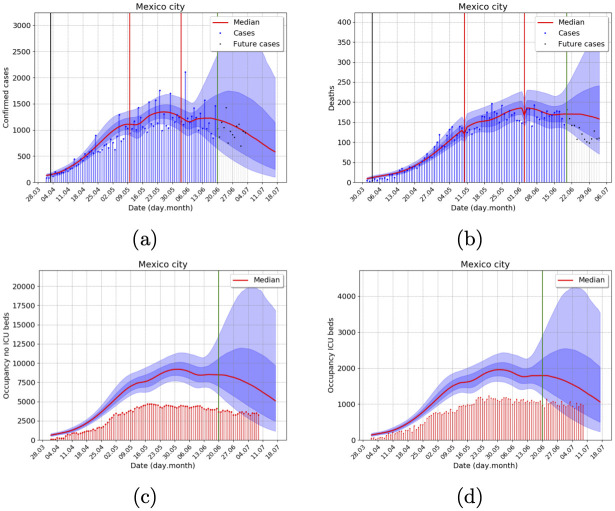
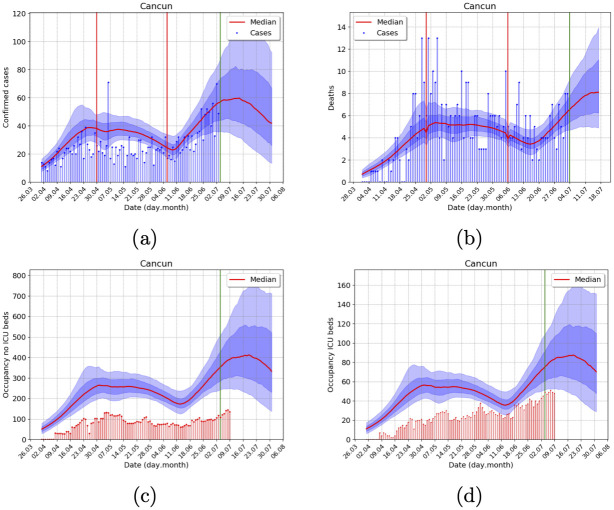
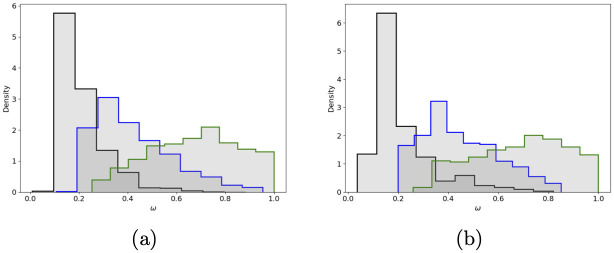
We present a forecasting model aim to predict hospital occupancy in metropolitan areas during the current COVID-19 pandemic. Our SEIRD type model features asymptomatic and symptomatic infections with detailed hospital dynamics. We model explicitly branching probabilities and non-exponential residence times in each latent and infected compartments. Using both hospital admittance confirmed cases and deaths, we infer the contact rate and the initial conditions of the dynamical system, considering breakpoints to model lockdown interventions and the increase in effective population size due to lockdown relaxation. The latter features let us model lockdown-induced 2nd waves. Our Bayesian approach allows us to produce timely probabilistic forecasts of hospital demand. We have applied the model to analyze more than 70 metropolitan areas and 32 states in Mexico.


Conflict of interest statement

No authors have competing interests.

Figures

Fig 1
Fig 1. Schematic diagram of the dynamical model.
Erlang sub-compartments not shown. For a precise definition of parameters, see S1 File.
Fig 2
Fig 2. Retrospective outbreak analysis for Mexico city metropolitan area, considering data until 9 July 2020, with the -11+4 data correction for reporting delays explained in the observational model and data section.
Posterior uncertainty is illustrated with the blue shadow areas, as explained in the Displaying Results section. Gray bars and dots correspond to two weeks of trimmed data, and the inference was done with blue data (blue bars and dots) only. The green vertical line shows the corresponding start date of forecasts. (A) Incidence of confirmed cases, (B) Incidence of deaths (C) No ICU, and (D) ICU demand of hospital beds. Actual hospital occupancy (red) is not used in the inference and does run until 9 July 2020. Total population 21, 942, 666 inhabitants.
Fig 3
Fig 3. Outbreak analysis for Cancun metropolitan area, using data from 9 July 2020, with the -11+4 data correction for reporting delays.
Posterior uncertainty is illustrated with the blue shadow areas, as explained in the Displaying Results section. The green vertical line shows the corresponding start date of forecasts. (A) Incidence of confirmed cases, (B) Incidence of deaths (C) No ICU, and (D) ICU demand of hospital beds. Total population 891, 843 inhabitants.
Fig 4
Fig 4
Posterior distribution for ω0 (black), ω1 (blue) and ω2 (green, Neff = i, f = 0.4) (A) Mexico city (B) Cancun.
Fig 5
Fig 5. Daily Rt’s calculated as in [40] for Cancun metropolitan area.
Two relaxation days, marked with red vertical lines, were included at local minima, allowing for a minimum gap of 3 weeks. Blue shadow areas also represent the 10%—90% and 25%—75% quantile ranges, here for the daily Rt posterior distribution calculated as in [40].
Fig 6
Fig 6
Posterior distribution of f × ω for (A) Mexico city and (B) Cancun metropolitan areas. With f = 0.4, the maximum a posterior of f × ω is close to 0.05 as proposed for the early forecast.

References

    1. Ferguson NM, Laydon D, Nedjati-Gilani G, Imai N, Ainslie K, Baguelin M, et al. Impact of non-pharmaceutical interventions (NPIs) to reduce COVID-19 mortality and healthcare demand. London: Imperial College COVID-19 Response Team, March. 2020;16.
    1. Verity R, Okell LC, Dorigatti I, Winskill P, Whittaker C, Imai N, et al. Estimates of the severity of COVID-19 disease. medRxiv. 2020.
    1. Novel CPERE, et al. The epidemiological characteristics of an outbreak of 2019 novel coronavirus diseases (COVID-19) in China. Zhonghua liu xing bing xue za zhi = Zhonghua liuxingbingxue zazhi. 2020;41(2):145. - PubMed
    1. Zhou X, Li Y, Li T, Zhang W. Follow-up of asymptomatic patients with SARS-CoV-2 infection. Clinical Microbiology and Infection. 2020. 10.1016/j.cmi.2020.03.024 - DOI - PMC - PubMed
    1. Gandhi M, Yokoe DS, Havlir DV. Asymptomatic Transmission, the Achilles’ Heel of Current Strategies to Control Covid-19. The New England Journal of Medicine. 2020. 10.1056/NEJMe2009758 - DOI - PMC - PubMed

Publication types