. 2021 Feb 4;184(3):689-708.e20.
doi: 10.1016/j.cell.2020.12.025. Epub 2021 Jan 21.

p53 is a central regulator driving neurodegeneration caused by C9orf72 poly(PR)

Affiliations

p53 is a central regulator driving neurodegeneration caused by C9orf72 poly(PR)

Maya Maor-Nof et al. Cell. .

Abstract

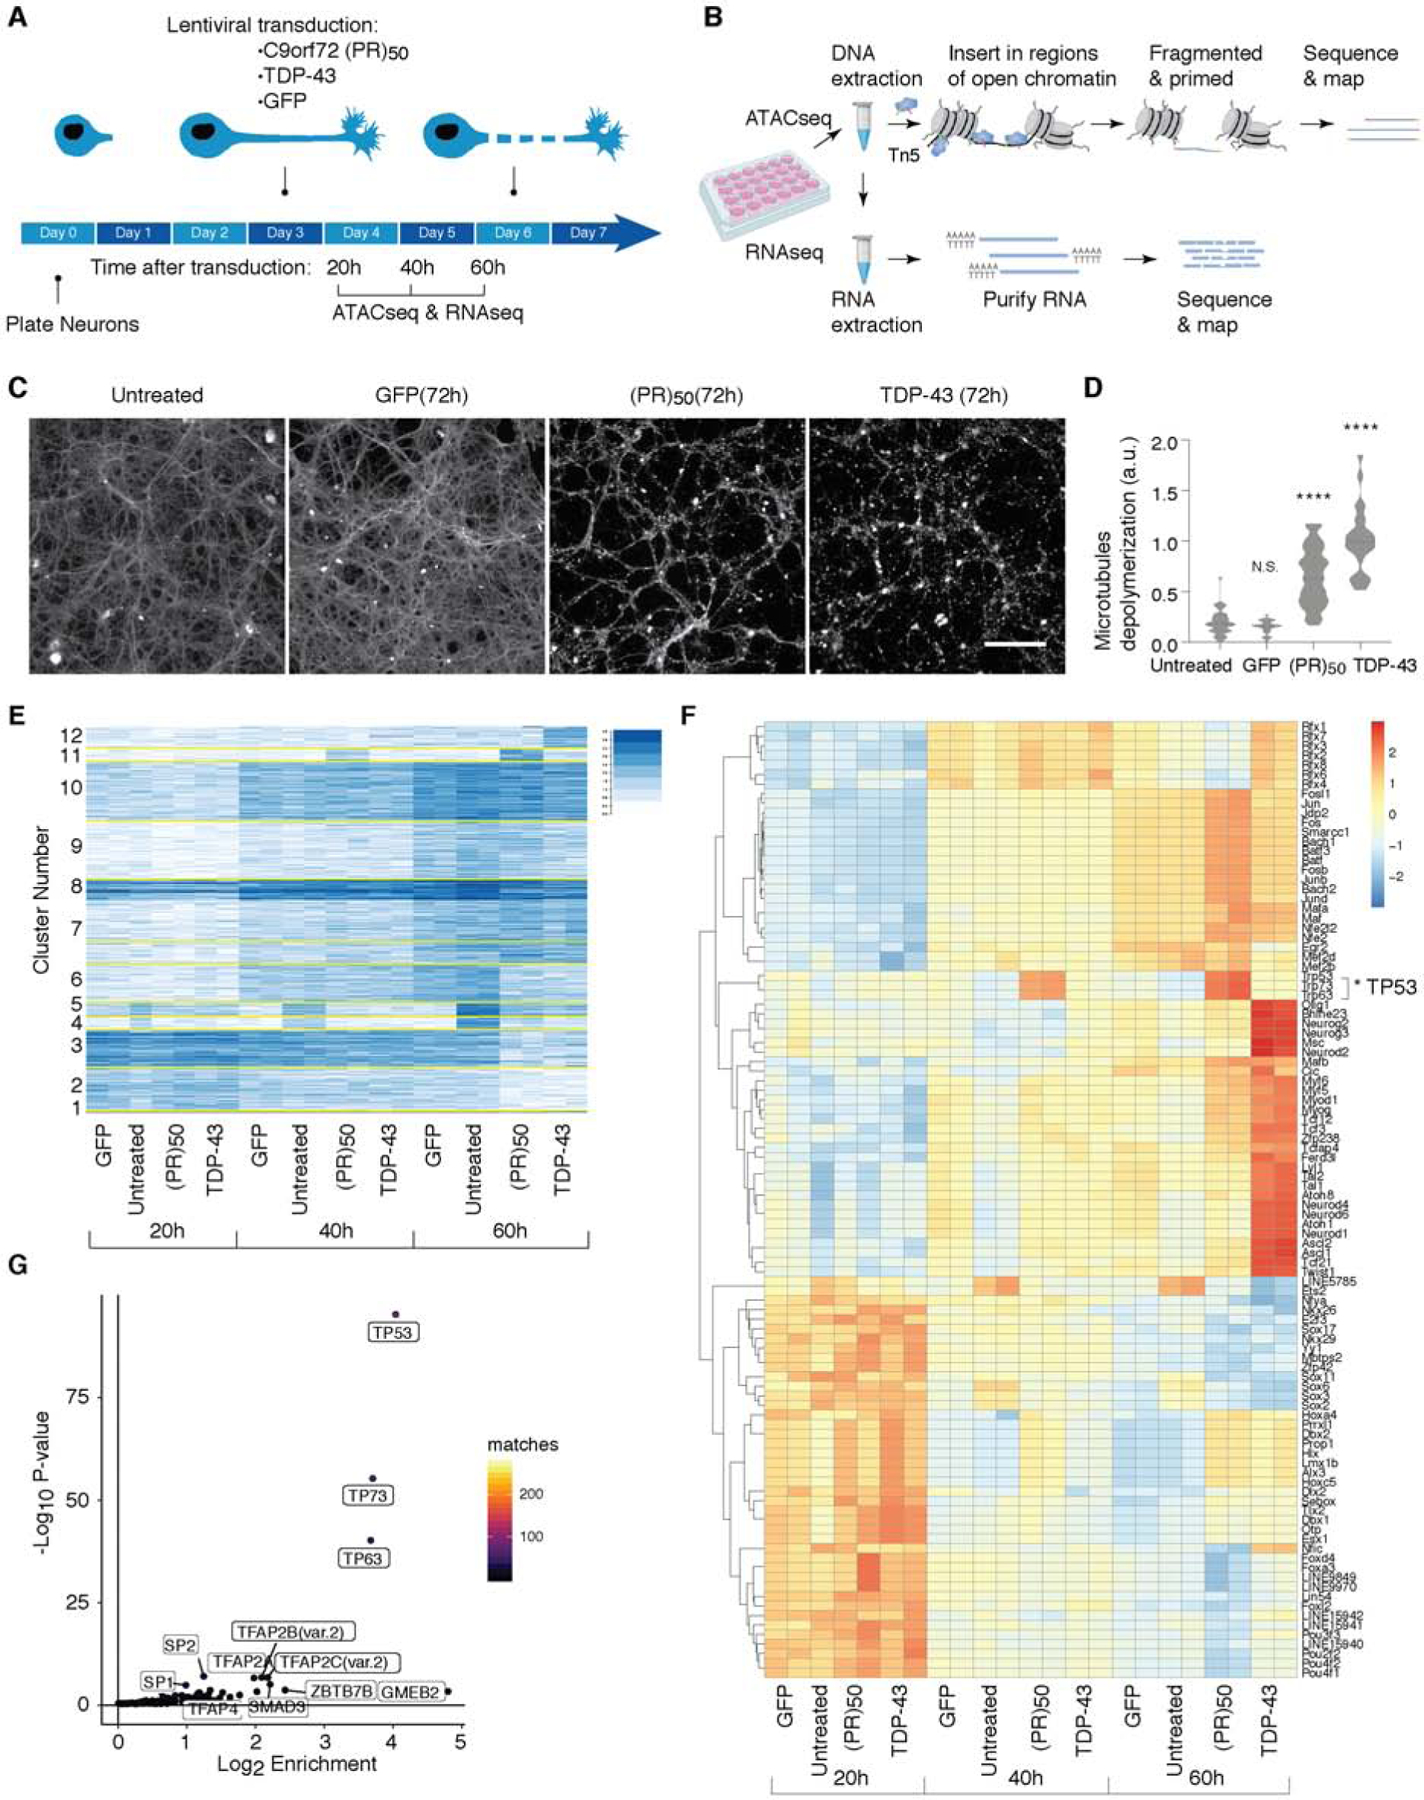
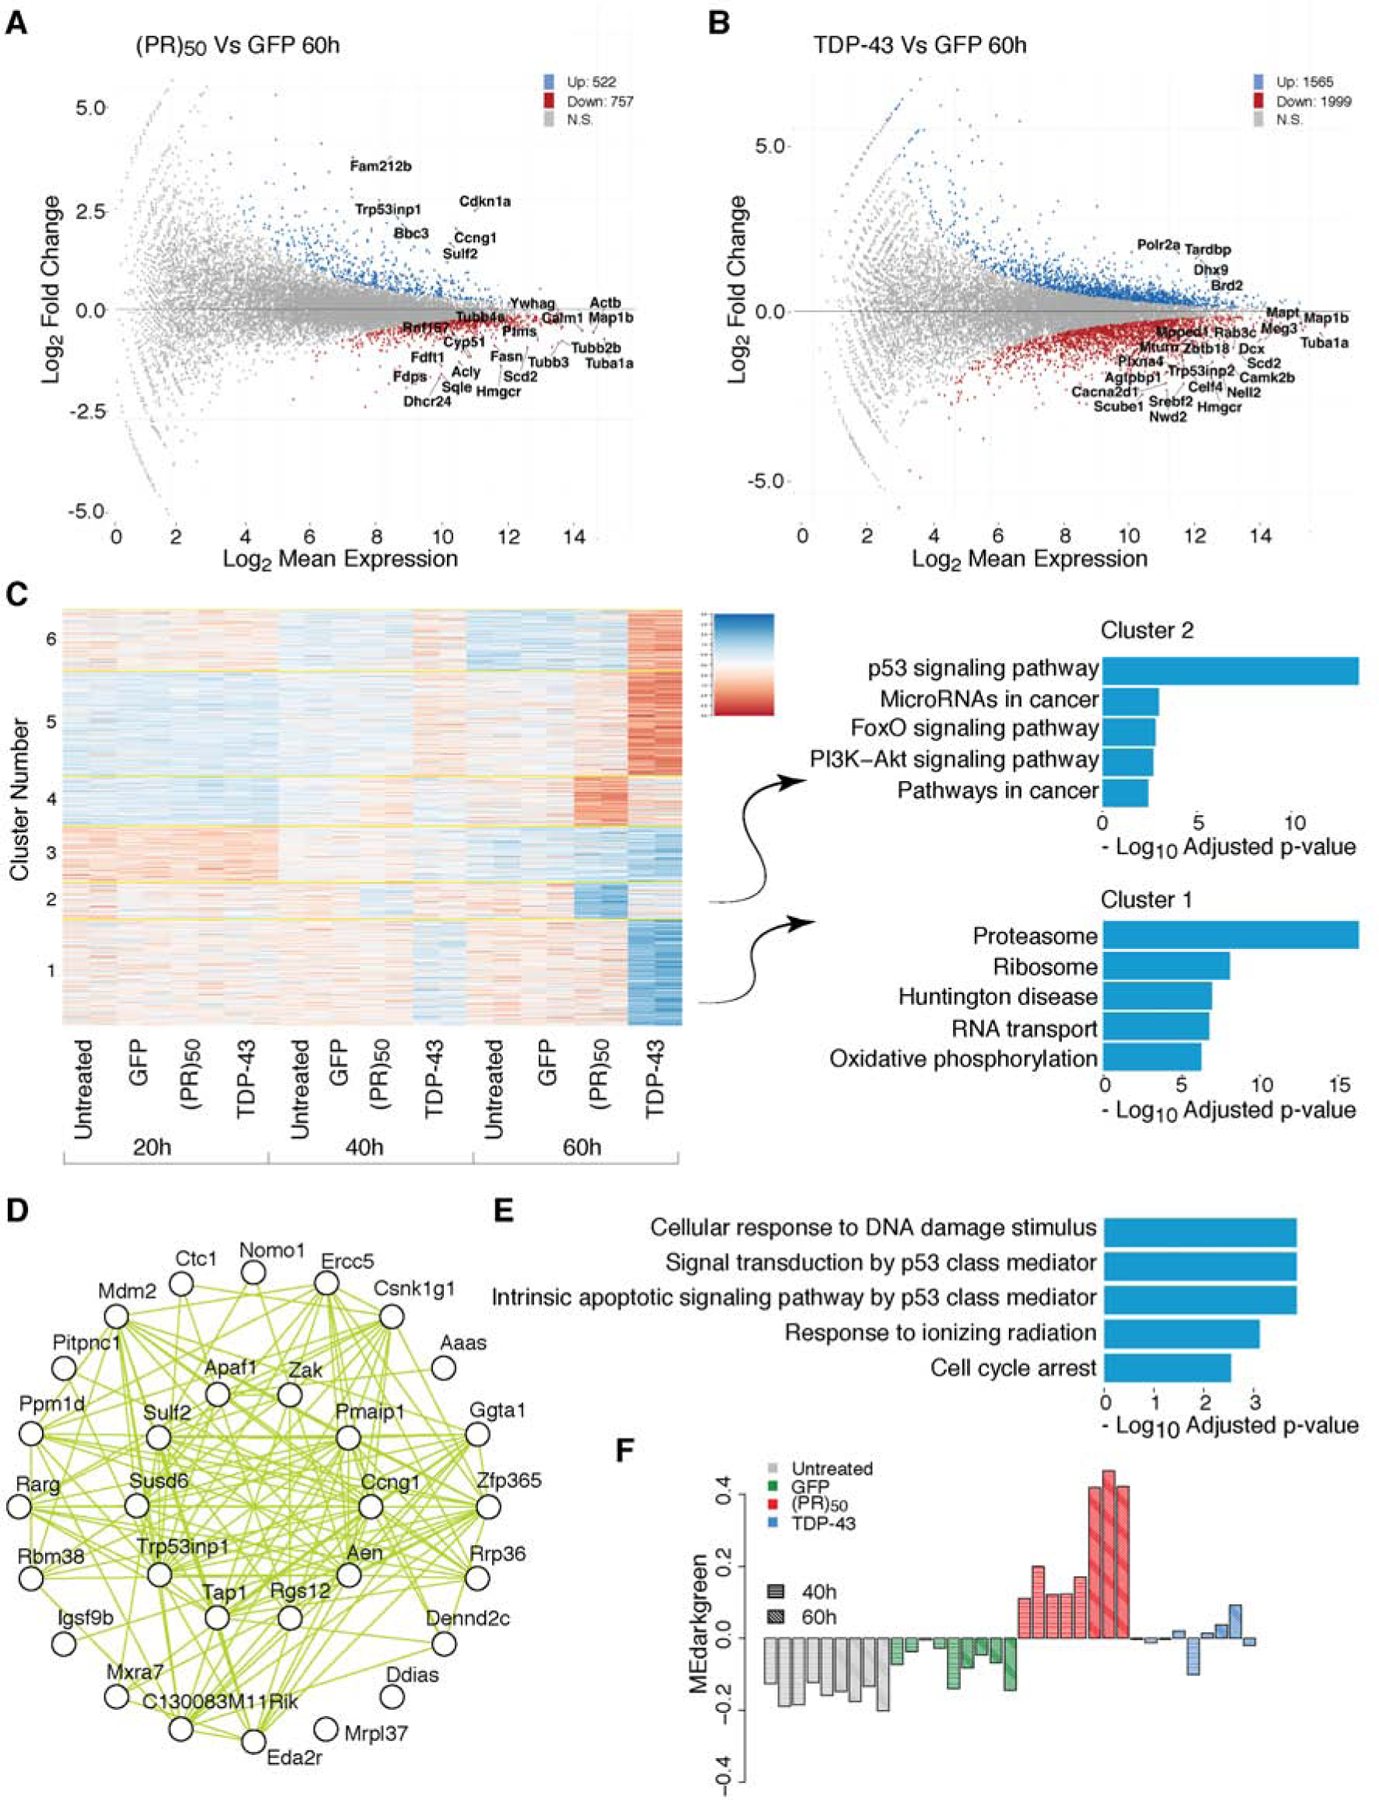
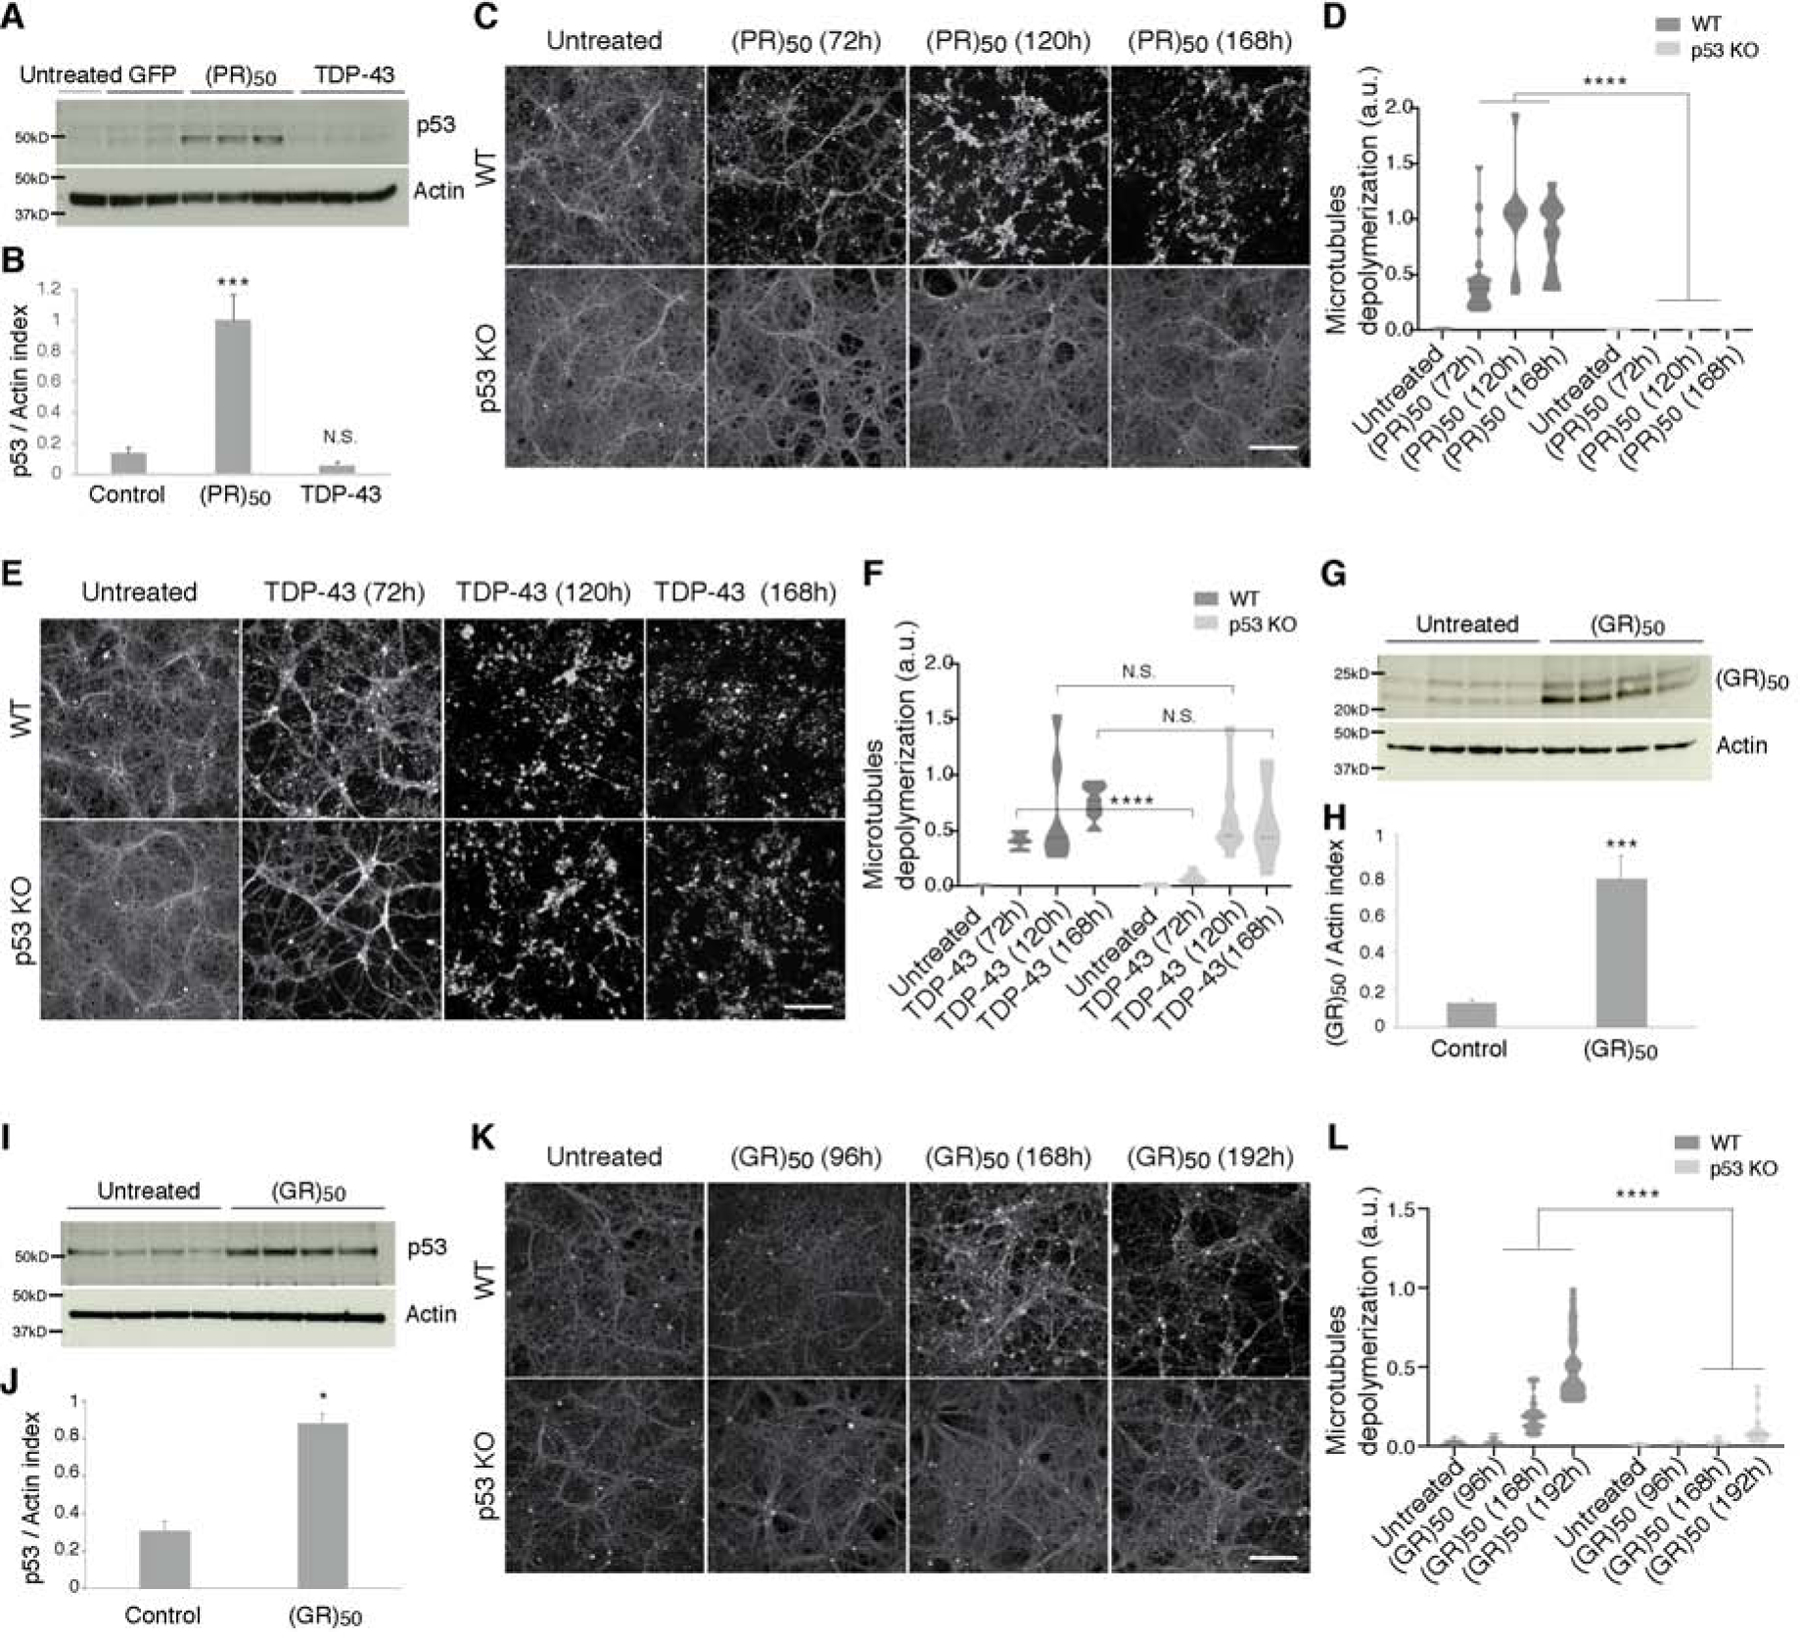
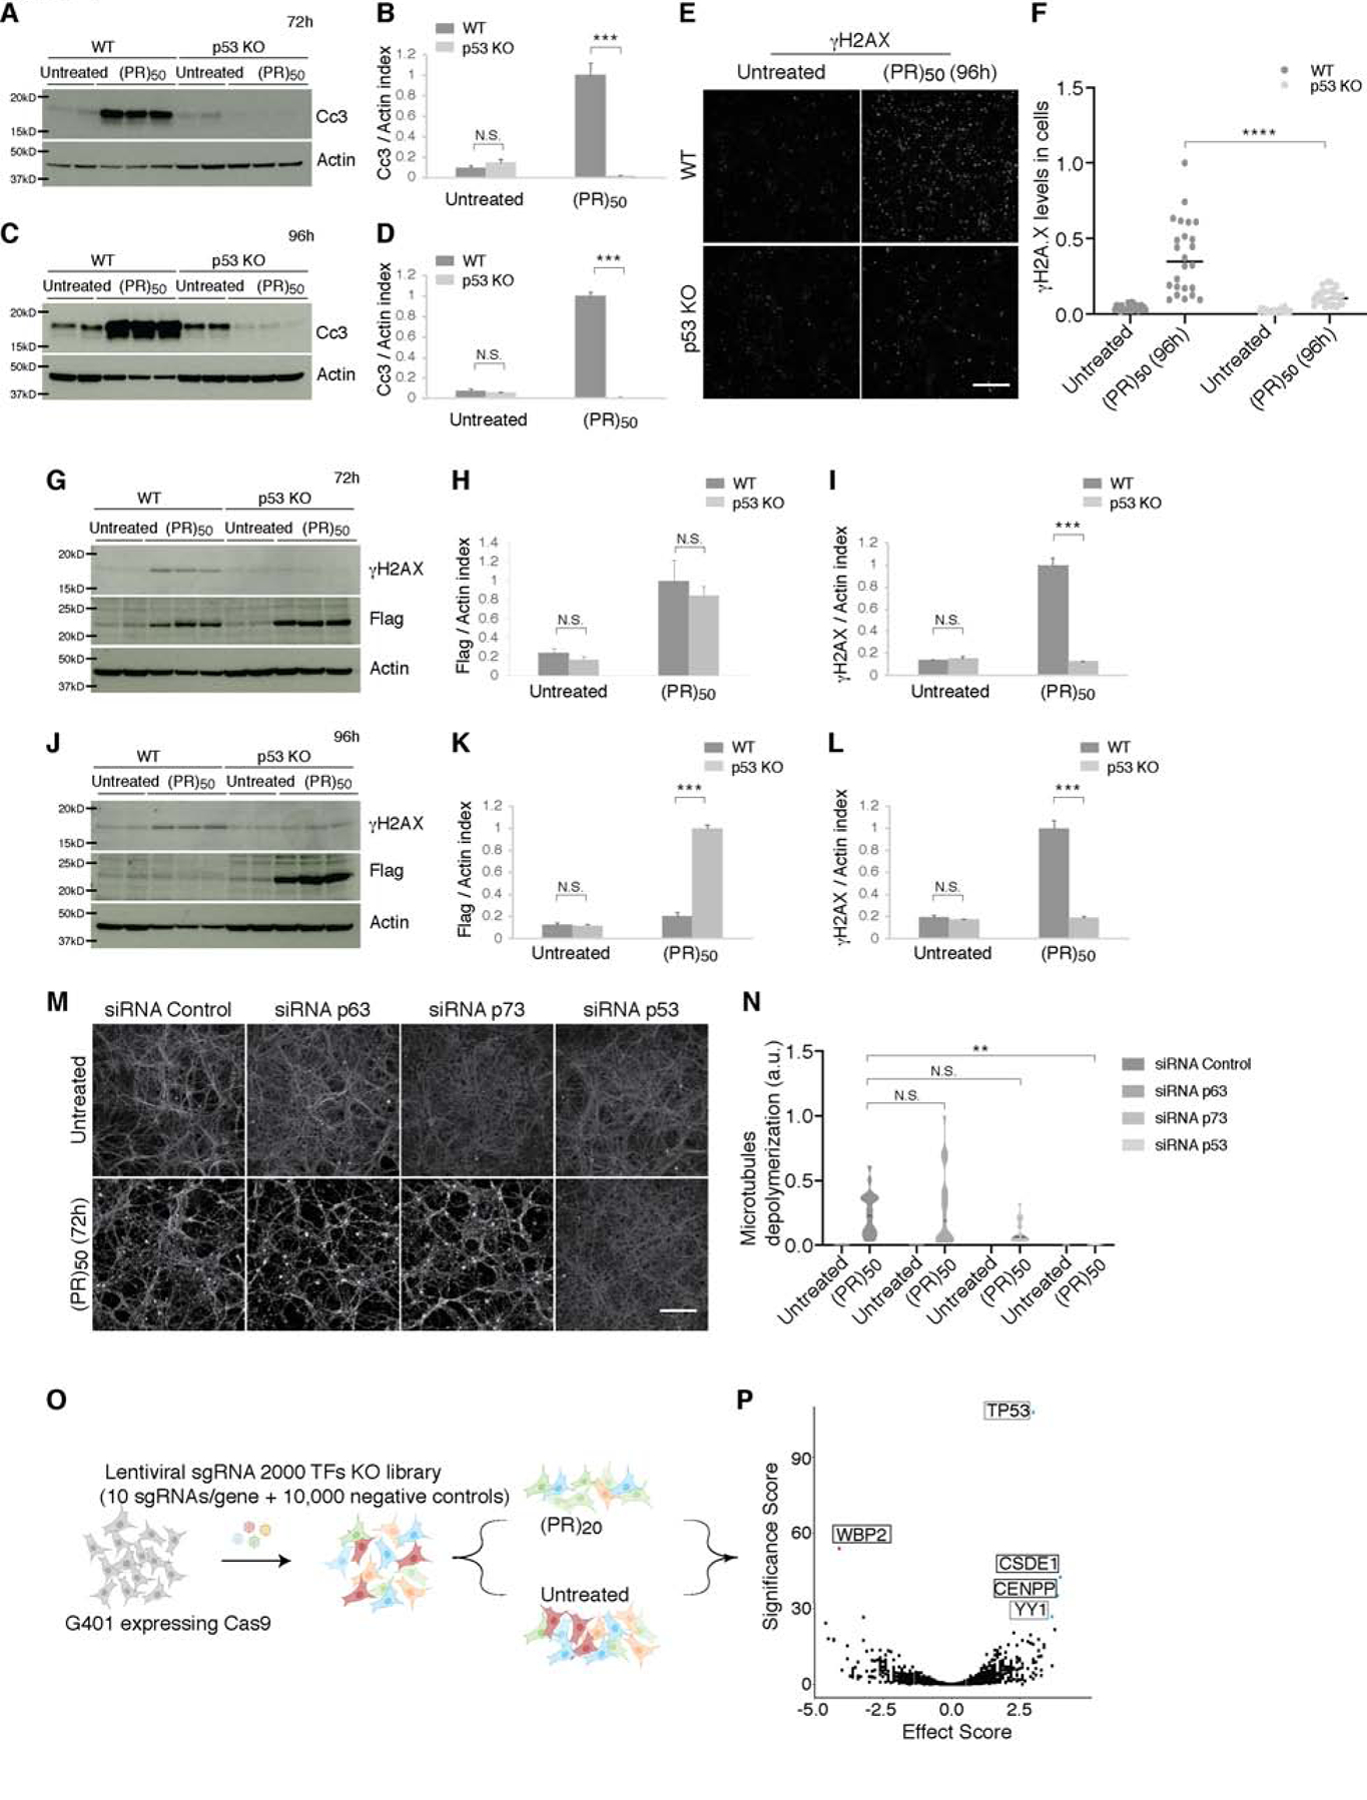
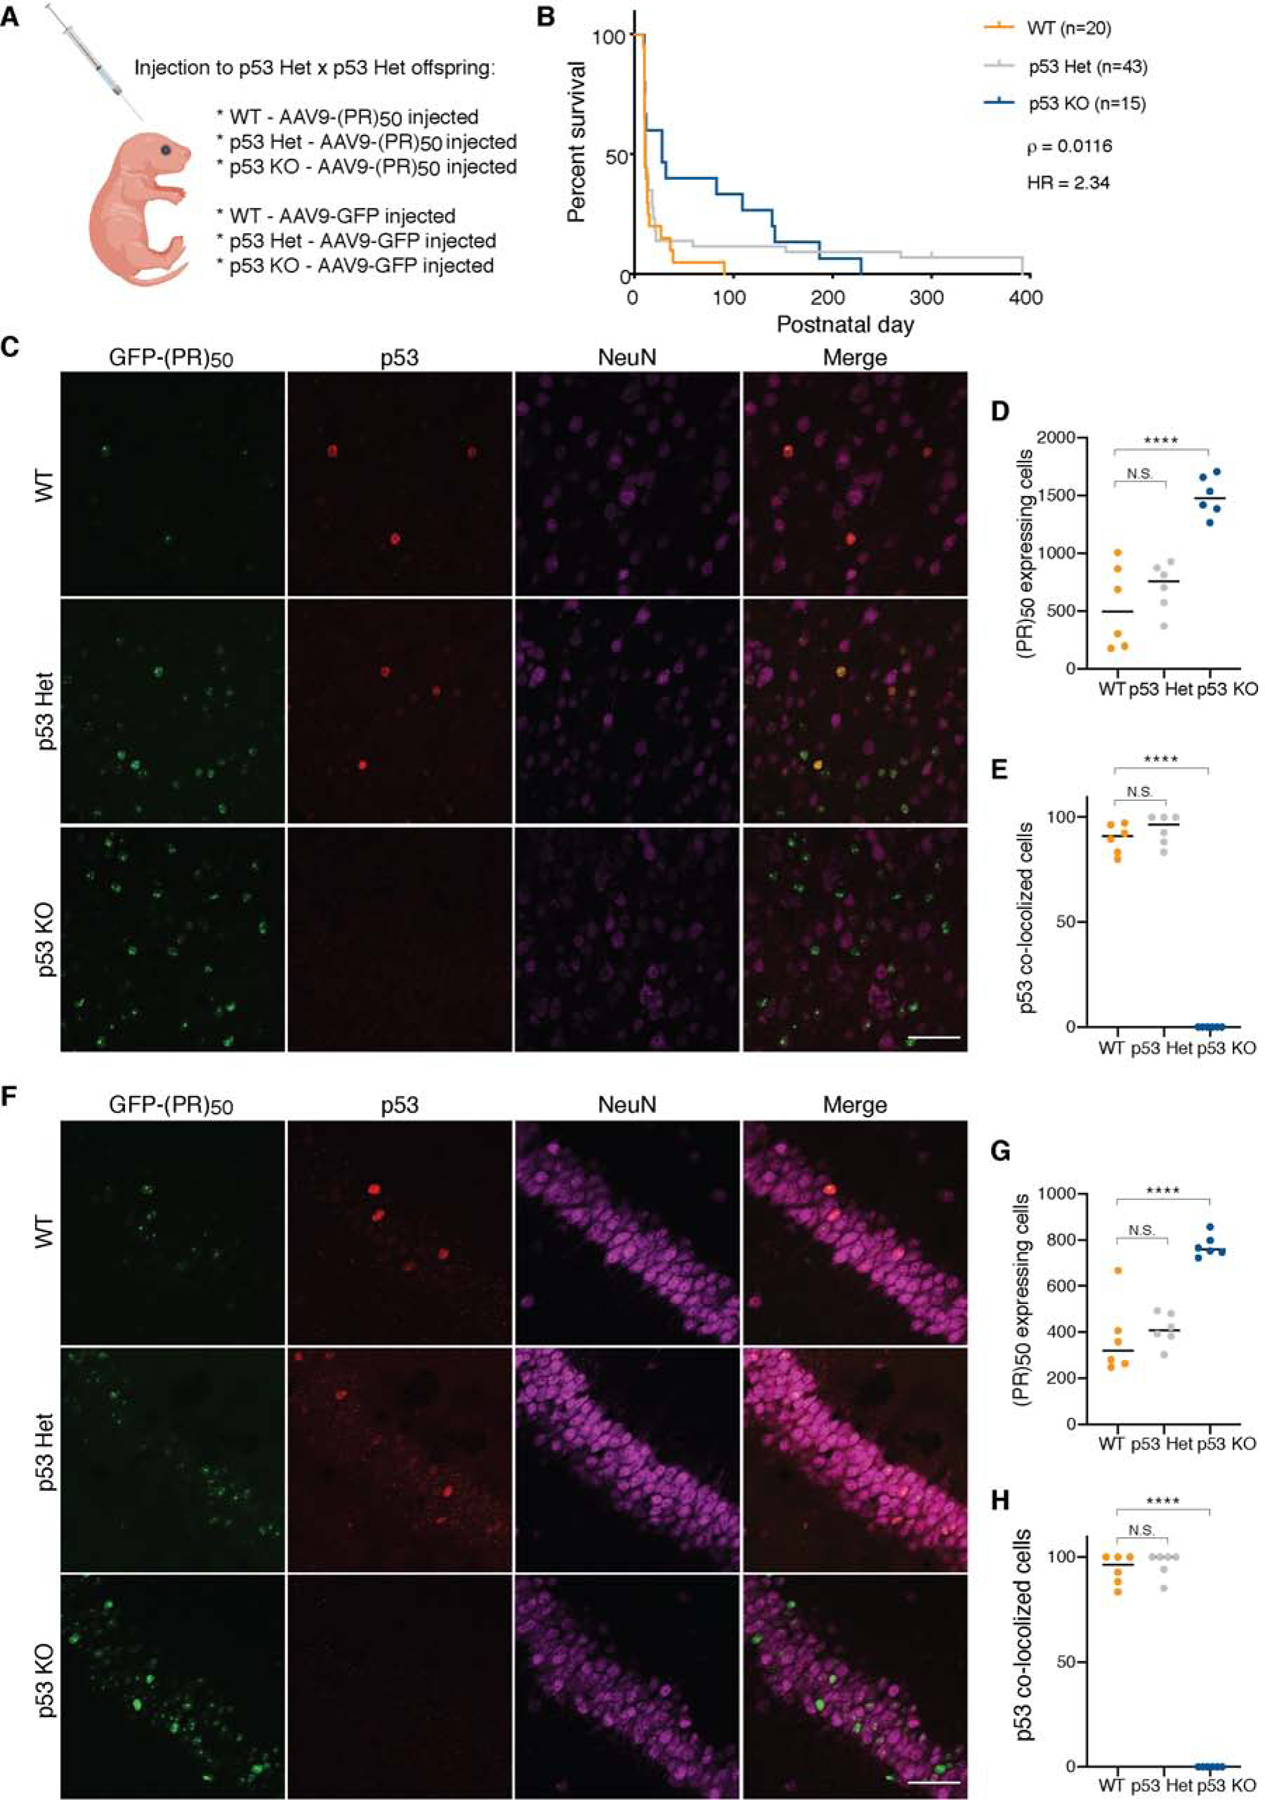
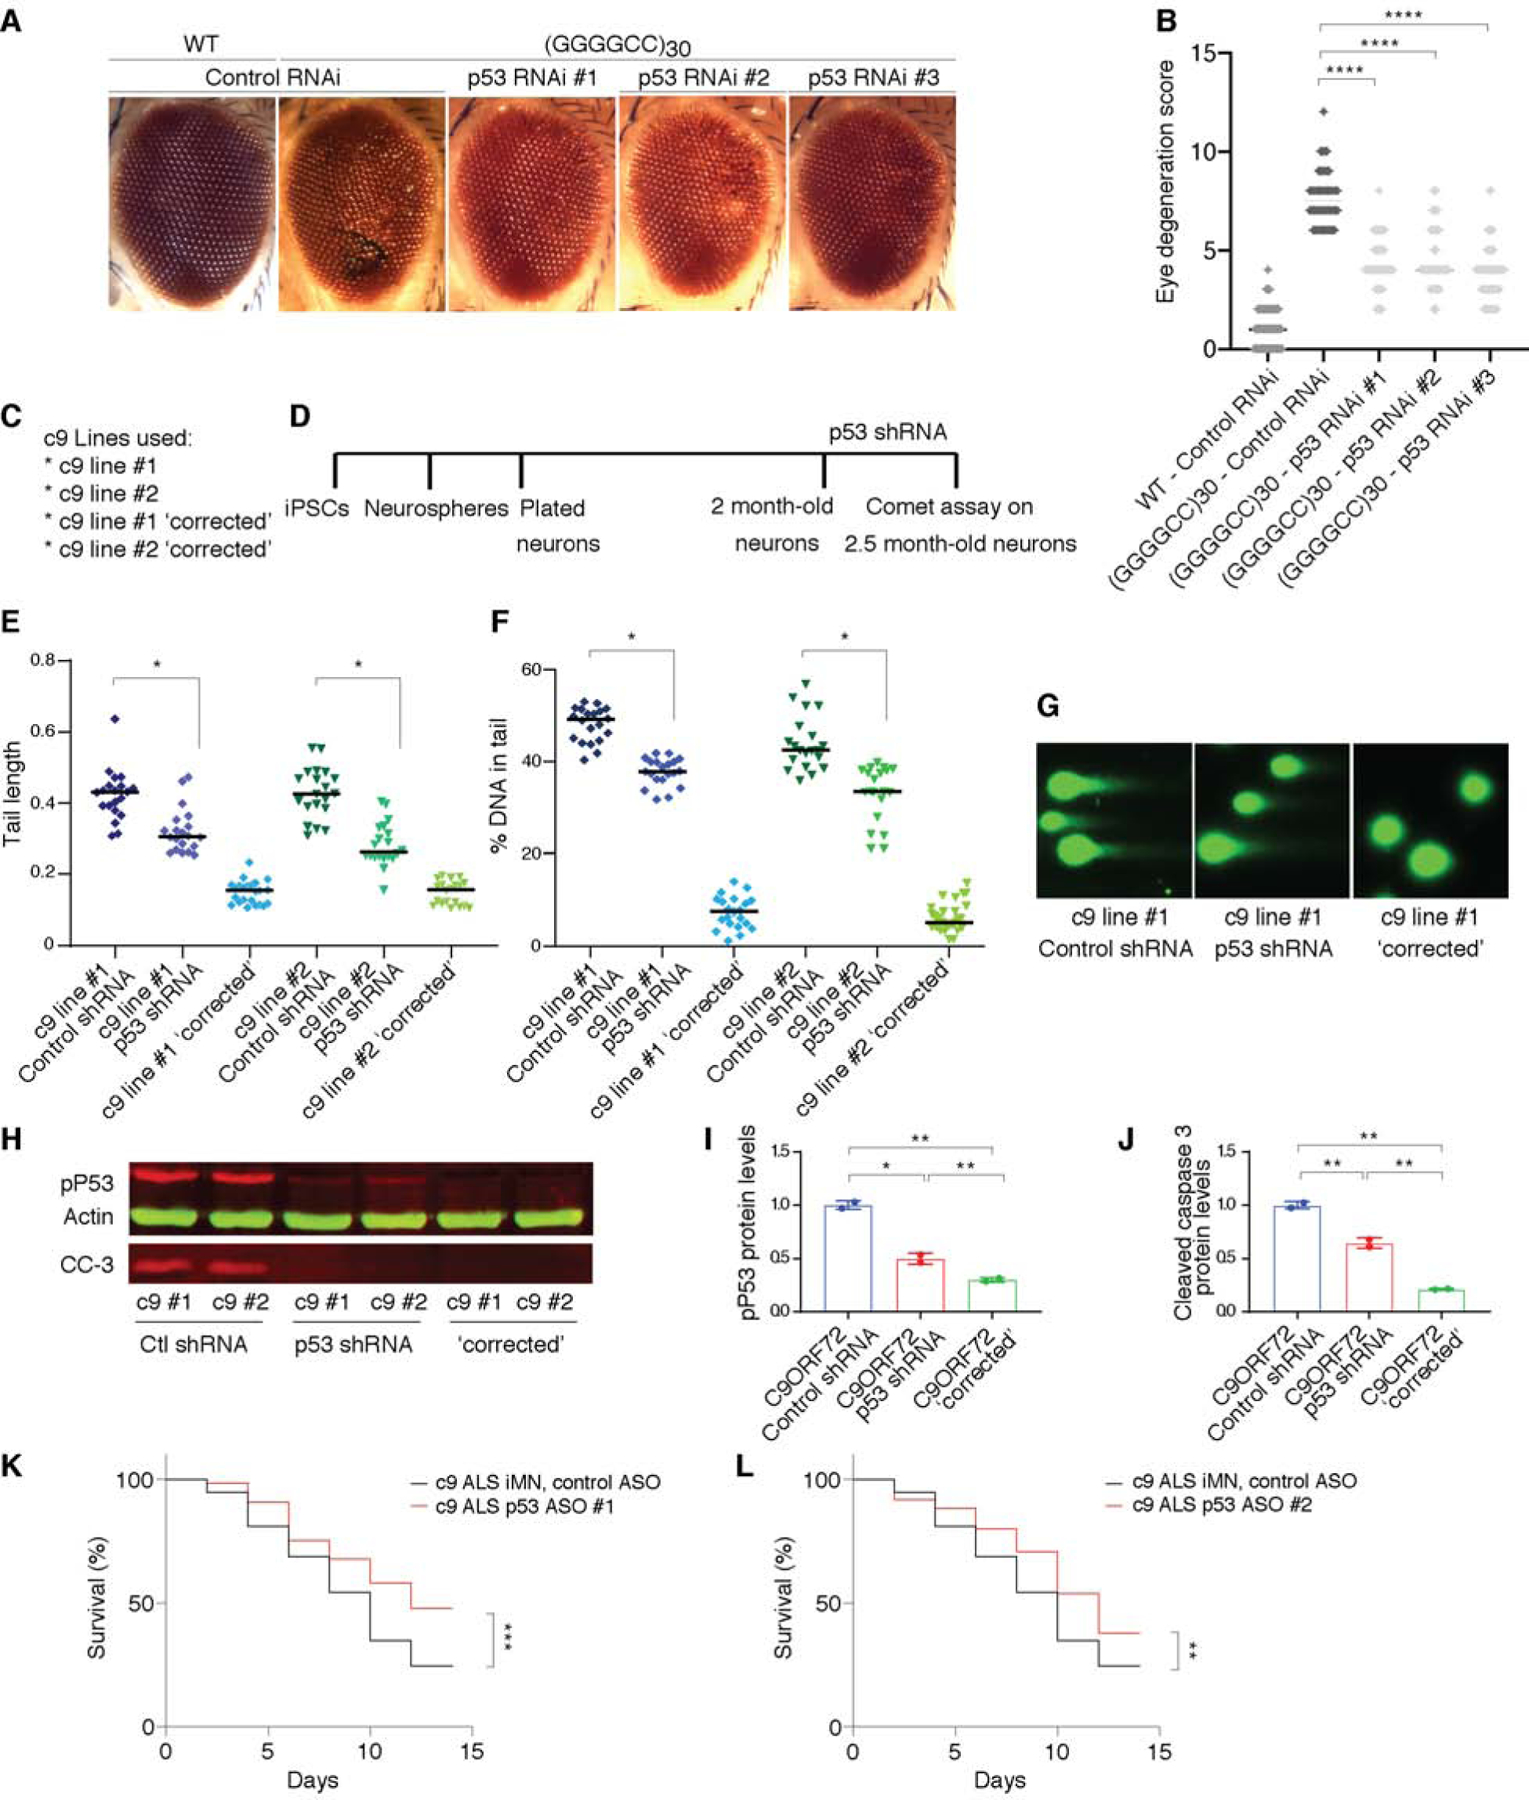
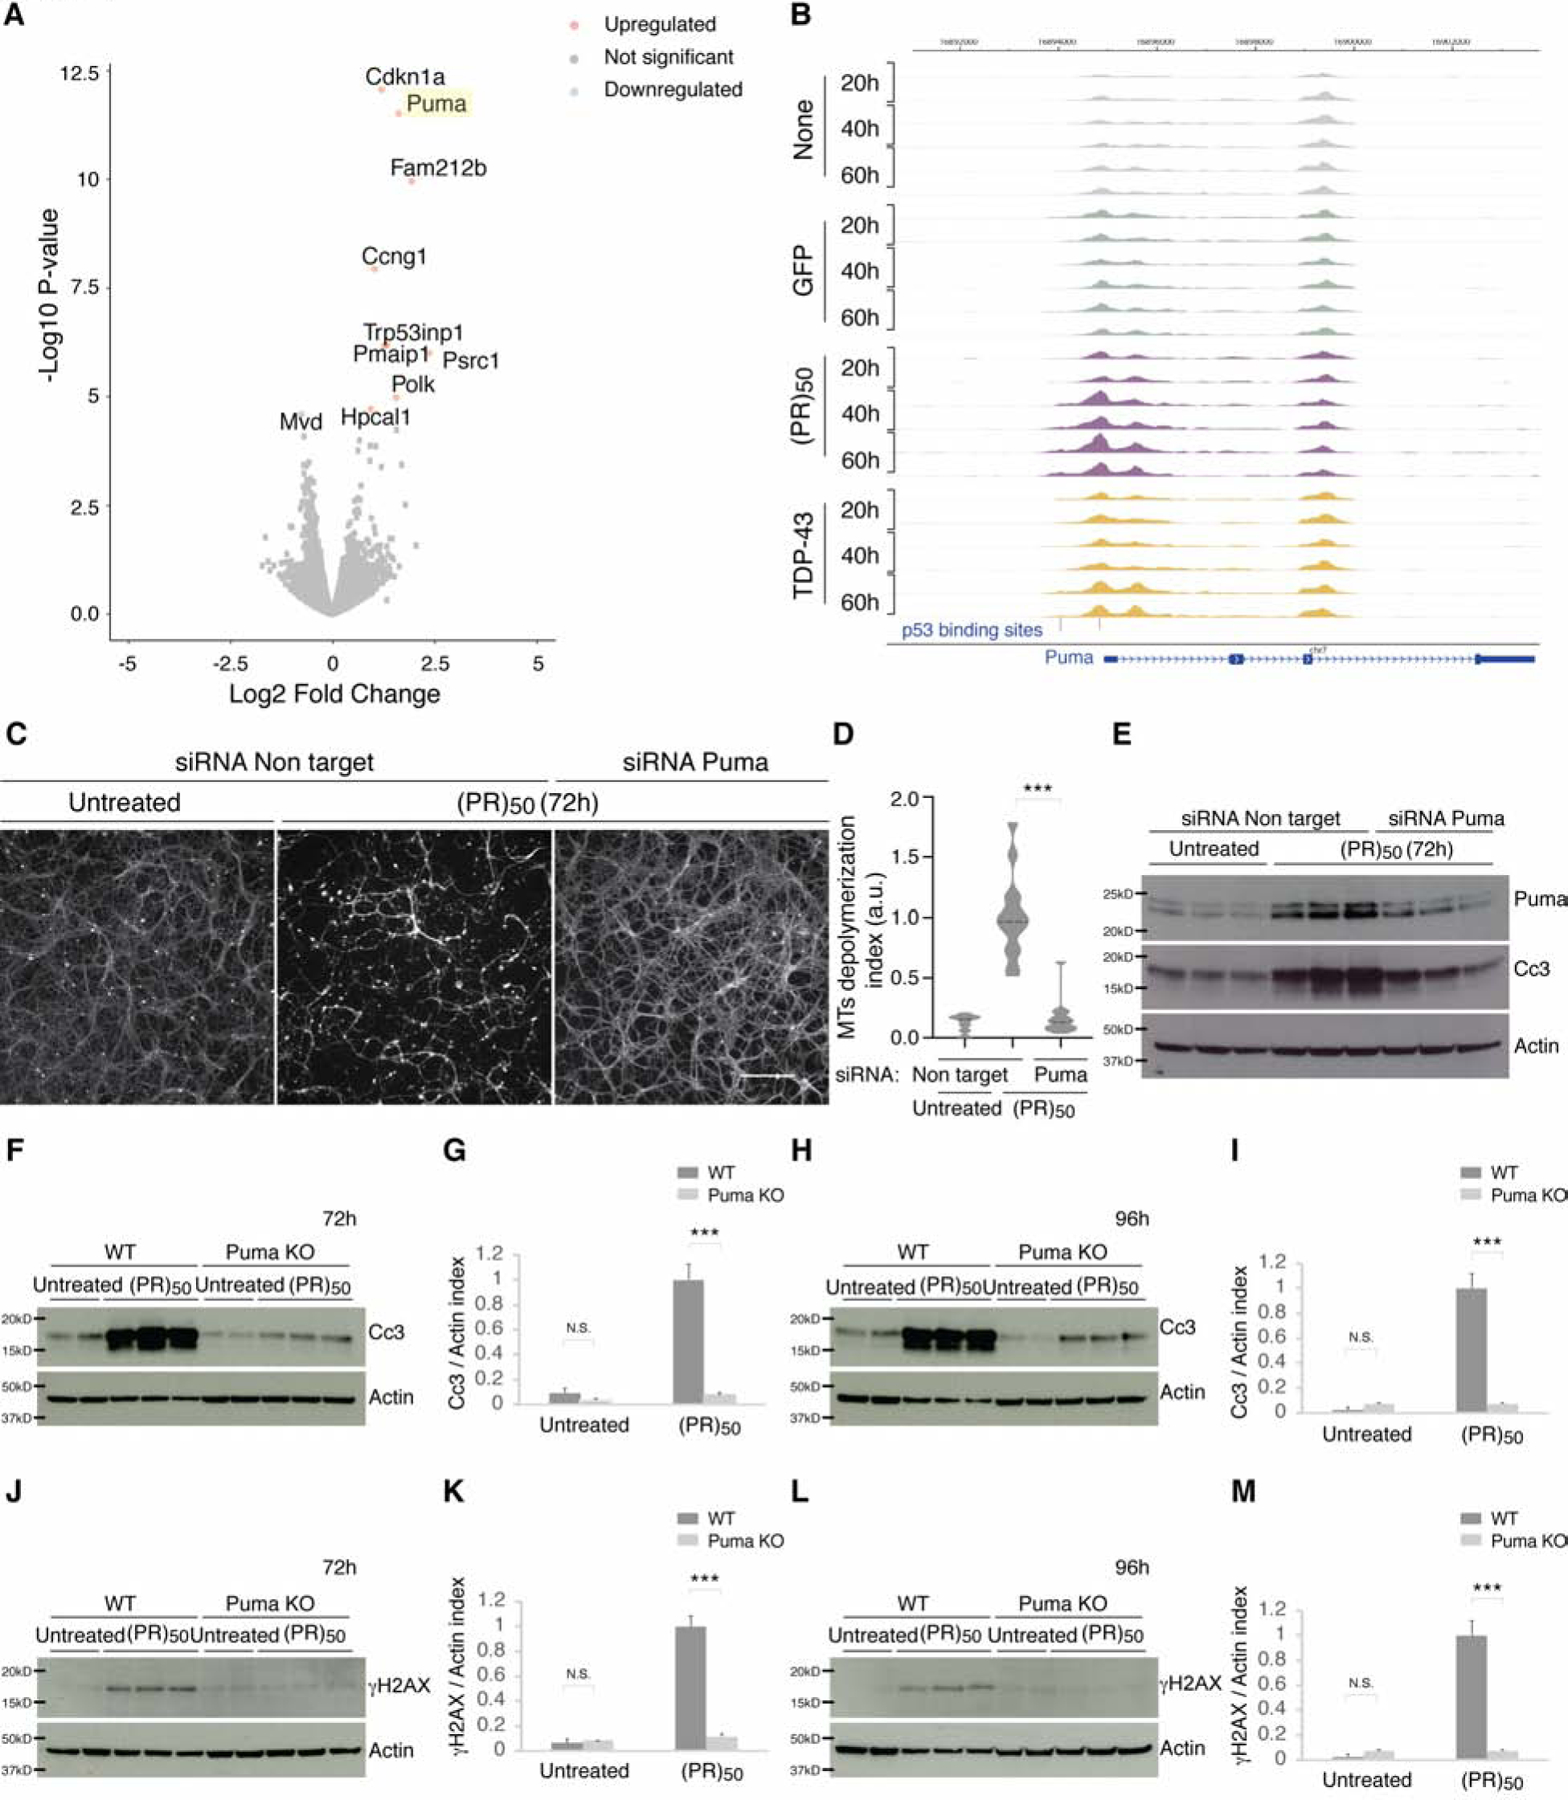
The most common genetic cause of amyotrophic lateral sclerosis (ALS) and frontotemporal dementia (FTD) is a GGGGCC repeat expansion in the C9orf72 gene. We developed a platform to interrogate the chromatin accessibility landscape and transcriptional program within neurons during degeneration. We provide evidence that neurons expressing the dipeptide repeat protein poly(proline-arginine), translated from the C9orf72 repeat expansion, activate a highly specific transcriptional program, exemplified by a single transcription factor, p53. Ablating p53 in mice completely rescued neurons from degeneration and markedly increased survival in a C9orf72 mouse model. p53 reduction also rescued axonal degeneration caused by poly(glycine-arginine), increased survival of C9orf72 ALS/FTD-patient-induced pluripotent stem cell (iPSC)-derived motor neurons, and mitigated neurodegeneration in a C9orf72 fly model. We show that p53 activates a downstream transcriptional program, including Puma, which drives neurodegeneration. These data demonstrate a neurodegenerative mechanism dynamically regulated through transcription-factor-binding events and provide a framework to apply chromatin accessibility and transcription program profiles to neurodegeneration.

Keywords: ATAC-seq; C9orf72; TDP-43; amyotrophic lateral sclerosis; axonal degeneration; neurodegeneration; p53; puma.


Conflict of interest statement

Declaration of interests A.D.G. has served as a consultant for Aquinnah Pharmaceuticals, Prevail Therapeutics, and Third Rock Ventures and is a scientific founder of Maze Therapeutics. W.J.G. has affiliations with 10x Genomics (consultant), Guardant Health (consultant), and Protillion Biosciences (co-founder and consultant). J.K.I. is a co-founder of Acurastem. D.H.G has served as a consultant for Acurastem, Axial Biosciences, and Roche

Figures

Figure 1.
Figure 1.. Chromatin accessibility landscape of cortical neurons treated with GFP, C9orf72 (PR)50 or TDP-43.
(A) Schematic illustration of the experimental design. (B) On plate direct lysis followed by nuclei isolation was used to extract neuronal DNA. Hyperactive Tn5 transposase inserted sequencing adapters into open chromatin regions was used to prepare ATACseq libraries. A sequential RNA lysis step was performed after the direct DNA lysis to perform RNA-seq. (C-D) Cortical primary neurons were cultured for 3 days, and either treated with GFP, C9orf72 (PR)50 or TDP-43 for additional 72h or left untreated. Axonal microtubules (MTs) were depolymerized and degraded after treatment with (PR)50 and TDP-43 (C). Quantification in (D), as described in STAR Methods (t test; ****p < 0.0001, N.S. not significant). Scale bar, 100 μm. (E) K-means clustering (K=12) of the top 3960 variable peaks from the ATACseq analysis. (F) Heatmap showing scaled ChromVar deviation scores across variable genes. (G) Two-sided Fisher’s exact test enrichment p-values of Cluster 11 transcription factors from panel (E) against the background of all other clusters. Cluster 11 shows highest enrichment for p53 transcription factor and its family members (p63 and p73).
Figure 2.
Figure 2.. The transcription program of cortical neurons treated with GFP, C9orf72 (PR)50 or TDP-43.
(A–B) MA Plot of 60h post treatment of (PR)50 vs GFP in (A) and TDP-43 vs GFP treated neurons in (B). (C) K-means clustering (K=6) of the top 6109 variable transcripts. KEGG pathway gene ontology enrichment of clusters 1 and 2. (D–F) Average linkage hierarchical clustering using the topological overlap metric for co-expression dissimilarity. Modules were identified from the dendrogram (presented in supplementary S3D) and labelled with colors. (D) Top 30 hub genes and 300 connections for co-expression module darkgreen. (E) Top gene ontology enrichments for co-expression module darkgreen. (F) Eigengene values of the darkgreen module for each individual sample.
Figure 3.
Figure 3.. p53 ablation protects neurons from axonal degeneration elicited by C9orf72 DPRs.
(A–B) p53 levels were elevated in (PR)50 treated neurons (A). Quantification of p53 levels by immunoblotting and normalized to actin (B). Graphs show mean ± SEM (t test; ***p < 0.001, N.S. not significant). (C–F). Axonal microtubules (MTs) of WT cortical neurons were depolymerized and degraded after treatment with (PR)50 or TDP-43. The p53 KO cortical neurons and axons were completely protected from any degradation after (PR)50 treatment (C) but not after TDP-43 (E). Quantification shown in (D, F), as described in the STAR Methods (t test; ****p < 0.0001, N.S. not significant). Scale bar, 100 μm. (G–J) WT cortical neurons treated with (GR)50 resulted in (GR)50 caused enhanced levels of p53, (I–J). Quantitation of (GR)50 and p53 was determined by immunoblots and normalized to actin (H and J). Graphs show mean ± SEM (t test; *p < 0.05, ***p < 0.001, N.S. not significant). (K–L) Cortical neurons from p53 KO embryos or their WT littermates were either left untreated or treated with C9orf72 (GR)50. (K) Degeneration induced by (GR)50 was attenuated in p53 KO cortical neurons and quantified in (L), as described in STAR Methods (t test; ****p < 0.001). Scale bar, 100 μm.
Figure 4.
Figure 4.. p53 ablation rescues neurons from DNA damage, cell death and axonal degeneration elicited by C9orf72 (PR)50.
(A–D) WT neurons treated with (PR)50 resulted in enhanced activation (cleavage) of Caspase-3, as evaluated by immunoblot analysis. Genetic ablation of p53 inhibited this activation of Caspase-3. Quantitation of cleaved Caspase-3 was determined by immunoblots and normalized to actin (B and D). Graphs show mean ± SEM (t test; ***p < 0.001, N.S. not significant). (E–L) Phosphorylated H2AX (γH2AX) levels were elevated after (PR)50 treatment, p53 ablation inhibited this induction at 72h (G and I) and 96h (E–F, J and L). Quantitation of γH2Ax following (PR)50 treatment was determined by immunoblotting and normalized to actin (I and L) and by immunostaining normalized to the number of cells (F). Graphs show mean ± SEM (t test; ***p < 0.001, ****p < 0.0001, N.S. not significant). (G-H) (PR)50 levels were elevated at 72h in both WT and p53 KO of (PR)50 treated neurons. At 96h, (PR)50 was present only at p53 KO and not at WT neurons (J–K), as detected using the anti-Flag antibody. (M–N) WT cortical neurons treated with siRNA against p53, p63, p73 or non-targeting control siRNA treated with (PR)50. Axonal microtubules (MTs) were depolymerized and degraded after (PR)50 in the non-target control, p63 and p73, yet p53 reduction by siRNA delayed (PR)50 axonal degeneration (M). Quantification shown in (N), as described in the STAR Methods (one-way ANOVA; **p < 0.01, N.S. not significant). Scale bar, 100 μm. (O–P) Schematic illustration of pooled CRISPR–Cas9 screening paradigm. G401 cells expressing Cas9 were transduced with a lentiviral sgRNA library (ten sgRNAs per gene), treated with (PR)20. Volcano plot for genes in the (PR)20 screen (P). Blue, all genes conferring resistance to (PR)20 when knocked out (1% FDR); red, all genes conferring sensitivity to (PR)20 when knocked out (1% FDR). p53 was the top hit conferring resistance to (PR)20.
Figure 5.
Figure 5.. p53 ablation extends lifespan in C9orf72 (PR)50 mice.
(A–B) Schematic illustration of the experimental design. newborn pups from p53 heterozygous x heterozygous crosses were injected intracerebroventricularly (ICV) with AAV encoding GFP-(PR)50 or GFP (A). Kaplan-Meier survival curves comparing survival of WT (n = 20), p53 heterozygous (n=43) and p53 KO (n=15) GFP-(PR)50 expressing mice (B). p53 KO GFP-(PR)50 expressing mice showed a 2.5-fold improvement in life span compared to WT mice. Curves were compared by log rank test and effect size was estimated by a Cox proportional hazards model (HR). (C–H) Immunofluorescence staining of WT, p53 Het and KO 3-week-old mice show p53 activation and colocalization with GFP-(PR)50 in the cortex (C-E) and in the hippocampus (F-H) of WT mice. Three mice per genotype and condition were quantified as described in the STAR Methods, from a 10x magnification (representative pictures in Figure S6H). The values for p53 colocalization (E and H) and (PR)50 expressing cell numbers (D and G) for individual brain hemisphere sections are plotted (one-way ANOVA; **** p < 0.0001, N.S. not significant). Scale bars, 50 μm.
Figure 6.
Figure 6.. p53 reduction modifies neurodegeneration in C9-ALS models
(A) Representative images of 15-day old fly eyes expressing 30 GGGGCC repeats (using GMR-GAL4) with RNAi to knockdown p53, genetically knocking down 3 RNAi lines (line #1 P{TRiP.GL01032}attP2, line#2 P{TRiP.GL01220}attP40 and line#3 P{TRiP.HMS02286}attP2). Eye degeneration quantified in (B). All data are presented as mean ± s.d. n=50, (one-way ANOVA; **** p < 0.0001, N.S. not significant). (C–G) Comet assay analysis after p53 knockdown in iPSC-derived motor neurons from C9orf72 mutation carriers. (C) The iPSC-derived motor neuron lines used here, differentiated from two independent C9orf72 mutation carriers and their respective isogenic controls (c9 ‘corrected’), where repeats were deleted by CRISPR-Cas9. (D) Schematic diagram of the motor neuron differentiation and the shRNA lentivirus transduction. Representative images of the comet assay (G), the quantification of comet length tail (E) and percentage of DNA in the tail (E) in 2.5 month motor neuron cultures (D) from two independent C9ORF72 lines and their respective isogenic controls (t test; * p <0.01). (H–J) p53 shRNA lentiviral transduction decreases phosphorylated p53 and cleaved Caspase 3 levels in iPSC-derived neurons differentiated from two independent C9orf72 mutation carriers. Quantification of phosphorylated p53 (I) and cleaved caspase 3 (J) levels following p53 shRNA treatments was determined by immunoblotting and normalized to actin. Graphs show mean ± SEM (t test; * p <0.05, ** p <0.01). (K–L) Knockdown of p53 with ASOs extends survival of C9ORF72 ALS (c9 ALS) iMNs (log rank Mantel-Cox test; n=3 independent iMN lines with n=195 iMNs per condition per treatment; **P < 0.01,***P < 0.001).
Figure 7.
Figure 7.. Puma ablation protects neurons from C9orf72 (PR)50 induced cell death and axonal degeneration.
(A) Volcano plot of RNAseq results from C9orf72 (PR)50 vs GFP treated neurons at 40h post treatment. (B) Normalized ATAC-seq tracks at the Puma locus of neurons untreated or treated with GFP, (PR)50 or TDP-43 at 20h, 40h and 60h. (C–E) Cortical neurons were treated with siRNA against Puma or non-targeting control siRNA. Neurons were then treated with (PR)50 for or left untreated. (PR)50 induced degeneration in the non-targeting control treated neurons (C) and activated cleaved Caspase-3 (E). Puma reduction by siRNA (D) delayed (PR)50 axonal degeneration (C) and delayed cleaved Caspase-3 activation (D). The extent of microtubule depolymerization (mean index) was calculated for each condition (D), as described in the STAR Methods (t test; ***p < 0.001). Scale bar, 100 μm. (F–I) Cortical neurons from Puma KO embryos or their WT littermates were left untreated or treated with C9orf72 (PR)50 for 72h (F-G) or 96h (H-I). WT neurons treated with (PR)50 resulted in increased cleaved Caspase-3, which was reduced in the Puma knockout neurons. Quantification of cleaved Caspase-3 following (PR)50 treatment was determined by immunoblotting and normalized to actin (G and I). Graphs show mean ± SEM (t test; ***p < 0.001, N.S. not significant). (J–M) Cortical neurons from Puma KO embryos or their WT littermates were cultured for 3 days and either left untreated or treated with C9orf72 (PR)50 for additional 72h (J-K) or 96h (L-M). γH2AX levels were elevated after (PR)50 treatment, Puma ablation inhibited this induction at 72h (J-K) and 96h (L-M). Quantification of γH2AX following (PR)50 treatment was determined by immunoblotting and normalized to actin (K and M). Graphs show mean ± SEM (t test; ***p < 0.001, N.S. not significant).

Comment in

References

    1. Akizuki M, Yamashita H, Uemura K, Maruyama H, Kawakami H, Ito H, and Takahashi R (2013). Optineurin suppression causes neuronal cell death via NF-kappaB pathway. J Neurochem 126, 699–704. - PubMed
    1. Ash PE, Bieniek KF, Gendron TF, Caulfield T, Lin WL, Dejesus-Hernandez M, van Blitterswijk MM, Jansen-West K, Paul JW 3rd, Rademakers R, et al. (2013). Unconventional translation of C9ORF72 GGGGCC expansion generates insoluble polypeptides specific to c9FTD/ALS. Neuron 77, 639–646. - PMC - PubMed
    1. Bae BI, Xu H, Igarashi S, Fujimuro M, Agrawal N, Taya Y, Hayward SD, Moran TH, Montell C, Ross CA, et al. (2005). p53 mediates cellular dysfunction and behavioral abnormalities in Huntington’s disease. Neuron 47, 29–41. - PubMed
    1. Barbosa LF, Cerqueira FM, Macedo AF, Garcia CC, Angeli JP, Schumacher RI, Sogayar MC, Augusto O, Carri MT, Di Mascio P, et al. (2010). Increased SOD1 association with chromatin, DNA damage, p53 activation, and apoptosis in a cellular model of SOD1-linked ALS. Biochim Biophys Acta 1802, 462–471. - PubMed
    1. Barry S, Baird G, Lascelles K, Bunton P, and Hedderly T (2011). Neurodevelopmental movement disorders - an update on childhood motor stereotypies. Dev Med Child Neurol 53, 979–985. - PubMed

Publication types

MeSH terms