. 2021 Mar 3;109(5):869-881.e6.
doi: 10.1016/j.neuron.2020.12.025. Epub 2021 Jan 21.

Distinct roles of dorsal and ventral subthalamic neurons in action selection and cancellation

Affiliations

Distinct roles of dorsal and ventral subthalamic neurons in action selection and cancellation

Clayton P Mosher et al. Neuron. .

Abstract

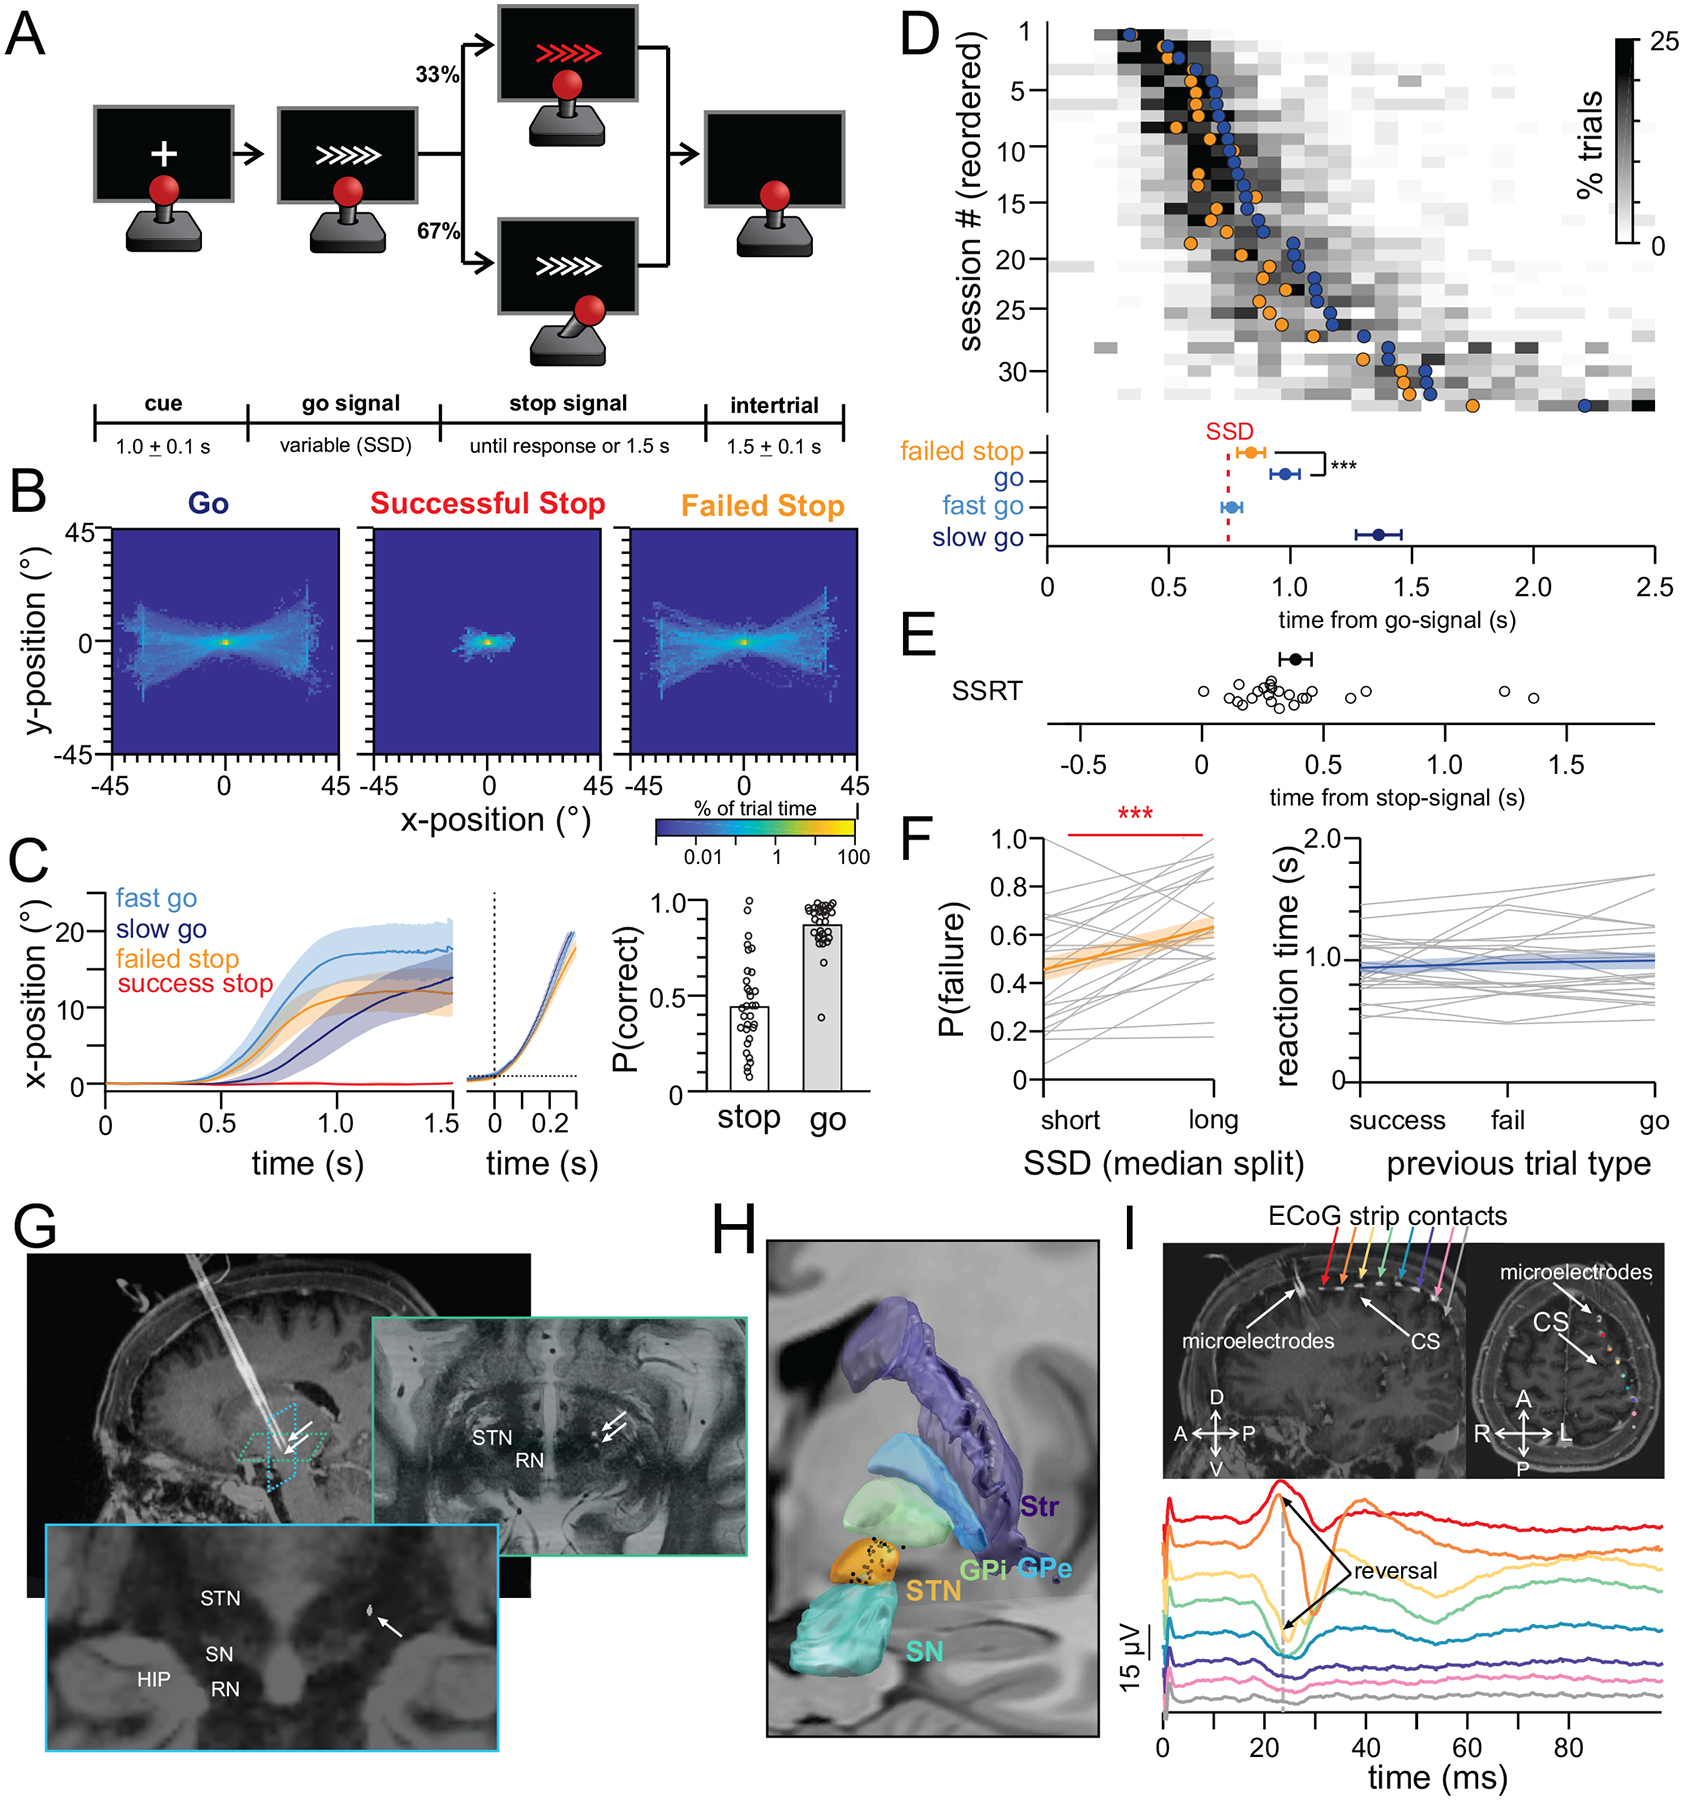
The subthalamic nucleus (STN) supports action selection by inhibiting all motor programs except the desired one. Recent evidence suggests that STN can also cancel an already selected action when goals change, a key aspect of cognitive control. However, there is little neurophysiological evidence for dissociation between selecting and cancelling actions in the human STN. We recorded single neurons in the STN of humans performing a stop-signal task. Movement-related neurons suppressed their activity during successful stopping, whereas stop-signal neurons activated at low-latencies near the stop-signal reaction time. In contrast, STN and motor-cortical beta-bursting occurred only later in the stopping process. Task-related neuronal properties varied by recording location from dorsolateral movement to ventromedial stop-signal tuning. Therefore, action selection and cancellation coexist in STN but are anatomically segregated. These results show that human ventromedial STN neurons carry fast stop-related signals suitable for implementing cognitive control.

Keywords: action cancellation; cognitive flexibility; human intracranial recordings; single-neuron; stopping; subthalamic nucleus.


Conflict of interest statement

Declaration of interests The authors declare no competing interests.

Figures

Figure 1:
Figure 1:. Stop-signal task and recording setup.
(A) Task. (B) Heatmap of joystick position across all subjects (negative = left/down). (C) Time-course of joystick trajectory aligned to onset of go-signal (left) and movement (middle). Horizontal dotted line = threshold for movement detection. Bar plot shows probability of successfully stopping on a stop trial and probability of moving in the correct direction on a go trial (each dot is a session). (D) Distribution of reaction times. Each row is a session. Gray heatmap shows binned reaction times across all trials (histogram). Filled circles are mean response times on failed stop trials (orange) and on successful go trials (blue). Population averages and s.e.m. depicted at bottom for each trial type. (E) Distribution of the stop-signal reaction times (SSRT), each circle is a session. (F) (left) Inhibition functions. (right) Absence of sequence effects. Reaction time on go-trials that follow a successful stop, a failed stop, or another go-trial. Gray lines are individual subjects. Blue and orange lines depict mean ± s.e.m. (G-I) Recording setup. (G) Intraoperative CT scan fused with pre-operative MRI showing two microelectrodes. Arrows indicate microelectrode tip in STN. (H) Reconstruction of STN recording sites (black dots=neurons, atlas=Ewert et al., 2018). (I) Intraoperative CT scan fused with pre-operative MRI showing the ECoG strip placed over sensorimotor cortex. Traces are sensorimotor evoked potentials elicited by median nerve stimulation. Each color is a different ECoG contact. *p<0.05, **p<0.01, ***p<0.001
Figure 2:
Figure 2:. Single neuron responses during the stop signal task.
(A) Raster-plots and peri-stimulus time histograms (PSTHs) of two movement-neurons. t=0 is onset of the go-signal. Trials are grouped by fast (light blue) and slow (dark blue) response times. Bottom trace shows average horizontal joystick position. Colored circle is a label indicating that this neuron is a movement-neuron (panel D). (B) Average normalized firing rate of all movement neurons, aligned to onset of the movement (pink) or the go-signal (black). Inset shows peak firing rate attained for each neuron for the two temporal alignments. (C) Response latency of movement neurons. (left) Time of peak firing rate after go-signal on trials with fast (light blue) vs. slow (dark blue) reaction time. (right). Neural onset time (light pink) and peak firing rate time (dark pink) relative to movement onset. (D) Distribution of response profiles. Of 83 neurons, 32 are movement responsive (left). 47 of these neurons were eligible for stop-related analysis (right). Each circle represents a neuron and is colored by the neuron’s response type. SS=successful stop. FS=failed stop. SG=slow go. FG=fast go. (E) Example stop-signal responsive neurons. Raster plots, PSTH, and joystick position aligned to stop-signal onset for successful (red) and failed (orange) stop trials. Fast go (light blue) and slow go (dark blue) trials are aligned to the timepoint when the stop-signal would have appeared had the trial been designated a stop-trial. (F-H) Decoding results from entire population of n=47 recorded neurons included in stop trial analysis. (F) Confusion matrix for classifier trained to decode movement from neural firing rates. Trace shows the probability the decoder predicted movement during the trial for each trial type. (G) Performance of a classifier trained to discriminate stop-signal trials from go-trials (t=0 is onset of stop-signal. Contours outline significant periods. Confusion matrices at two example time periods (S=stop, G=go). Traces show the probability the decoder predicted a stop-signal at different time points during the trial. (H). Anatomical location of movement (blue) and stop signal neurons (red) in STN (yellow outline). triangles=stop neurons that respond on both successful and failed stop trials. Black “X” ‘s = location of recordings inferred from example intraoperative image (Figure 1I), connect with a dotted line to location estimated from post-surgical reconstruction. Error bars show mean and quartiles of dorsal-ventral location. (AP slice=−14.06 mm). *p<0.05, **p<0.01, ***p<0.001
Figure 3:
Figure 3:. Beta activity of STN neurons changes after SSRT.
(A) Autocorrelogram of the spike train of an example STN neuron during beta bursts in motor cortex (purple) or in the absence of beta bursts (gray). (B) Average difference in the power spectrum of all neuron spike trains (n=83) during beta bursts vs. outside beta bursts. (purple) motor cortex beta bursts, (black) STN beta bursts. Bars denote significance from 0; p<0.05) (bottom). (C) The mean spike-train beta power for different types of neurons (gray=non-responsive, blue=movement-related, red=stop-signal). Power calculated inside vs. outside beta bursts for motor cortex (left) and STN (right). (D) Probability of a beta burst in motor cortex (left) or STN (right) during the task. Horizontal bars = timepoints when beta burst probability significantly differed between successful stop trials and other trial types. Shading=s.e.m. (E) Differential latency analysis comparing the response time of stop-signal neurons and beta bursting on successful stop trials vs. latency matched slow go trials. Shading=s.e.m.
Figure 4:
Figure 4:. Spike-train characteristics of STN neurons vary along a dorsolateral-ventromedial anatomical axes through the STN.
(A) First four principle components of PCA applied to single unit firing features. (rate=mean firing rate; waveform=narrow or wide; LV=local variation; CV=coefficient of variation; burstiness=burst index based on autocorrelogram; beta firing=power of spike-train in beta range; move, stop-signal, stop-success, and stop-fail= effect sizes of neural firing rate changes during the task) (B) (left) Correlation between the factor scores of the neurons and their position along different anatomical axes through the STN. (right) Anatomical axis corresponding to PCs 2 and 3 (red and blue lines). Arrows indicate direction of increasing component scores. White lines = trajectory of each microelectrode. (C) Values of each feature (mean±SEM) in the dorsolateral or ventromedial region of STN (D) (left) Performance (confusion matrix) of an SVM classifier trained to discriminate DL from VM locations of neurons based on (C), tested on left out neurons. (right) The average feature weights of the SVM classifier.
Figure 5:
Figure 5:. Proposed mechanism of action selection and cancellation in STN.
(left) STN supports action selection by inhibiting motor programs that compete with the desired action (blue pathway in center-surround). (right) During cancellation, frontal cortex activates a subset of STN neurons (red pathway) some of which are in the surround and others that are in the center (gray neuron), causing rapid inhibition of all motor programs (For simplicity, pallidal and nigral connections are not shown in these plots and only the net effect on thalamus is displayed).

Comment in

References

    1. Alegre M, Lopez-Azcarate J, Obeso I, Wilkinson L, Rodriguez-Oroz MC, Valencia M, Garcia-Garcia D, Guridi J, Artieda J, Jahanshahi M, et al. (2013). The subthalamic nucleus is involved in successful inhibition in the stop-signal task: a local field potential study in Parkinson’s disease. Exp. Neurol 239, 1–12. - PubMed
    1. Allison T (1987). Localization of sensorimotor cortex in neurosurgery by recording of somatosensory evoked potentials. Yale J Biol Med 60, 143–150. - PMC - PubMed
    1. Amirnovin R, Williams ZM, Cosgrove GR, and Eskandar EN (2004). Visually Guided Movements Suppress Subthalamic Oscillations in Parkinson’s Disease Patients. J. Neurosci 24, 11302–11306. - PMC - PubMed
    1. Aron AR, and Poldrack RA (2006). Cortical and Subcortical Contributions to Stop Signal Response Inhibition: Role of the Subthalamic Nucleus. J. Neurosci 26, 2424–2433. - PMC - PubMed
    1. Aron AR, Fletcher PC, Bullmore ET, Sahakian BJ, and Robbins TW (2003). Stop-signal inhibition disrupted by damage to right inferior frontal gyrus in humans. Nature Neuroscience 6, 115–116. - PubMed

Publication types

LinkOut - more resources