. 2021 Feb 9;16(2):281-294.
doi: 10.1016/j.stemcr.2020.12.011. Epub 2021 Jan 21.

Microglia-Secreted Factors Enhance Dopaminergic Differentiation of Tissue- and iPSC-Derived Human Neural Stem Cells

Affiliations

Microglia-Secreted Factors Enhance Dopaminergic Differentiation of Tissue- and iPSC-Derived Human Neural Stem Cells

Sissel Ida Schmidt et al. Stem Cell Reports. .

Abstract

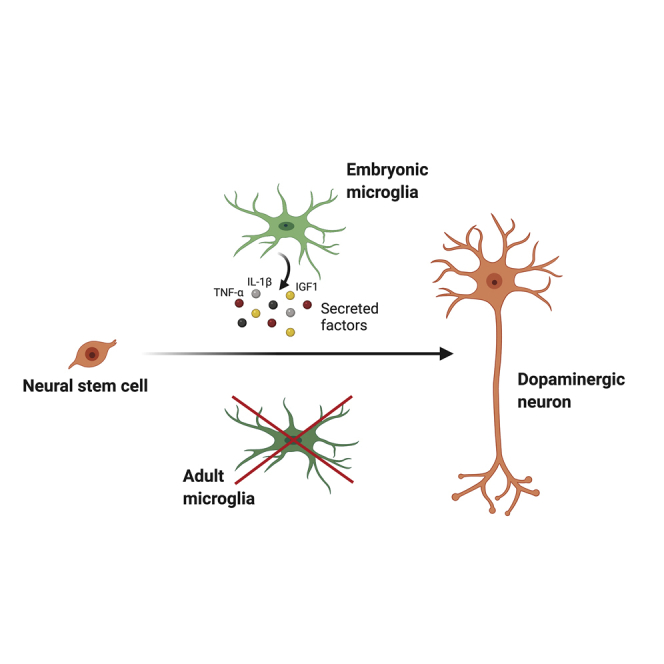
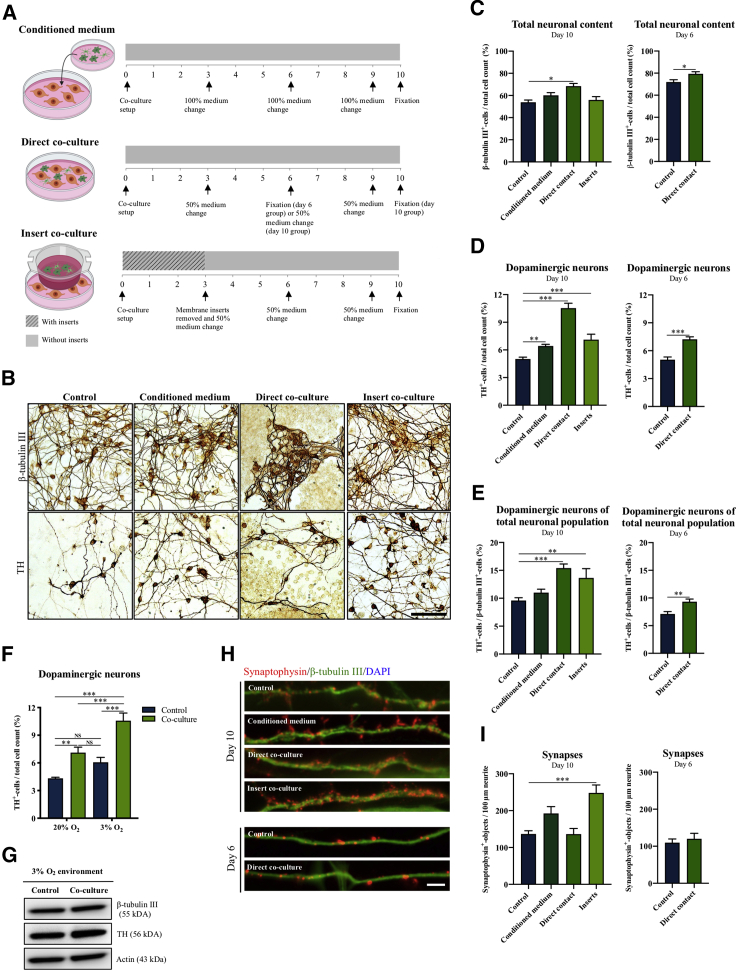
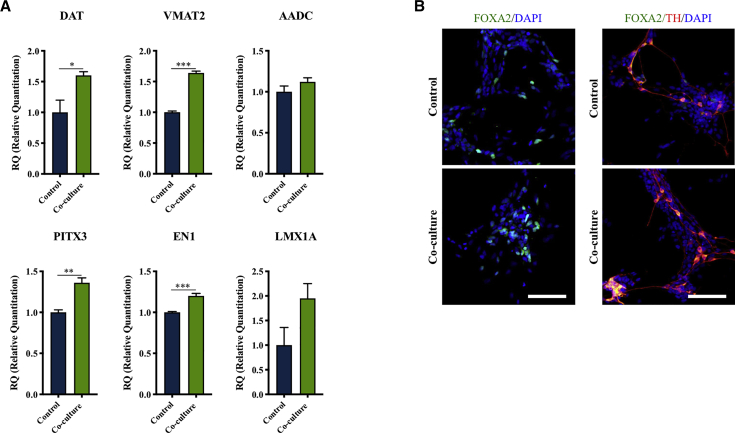
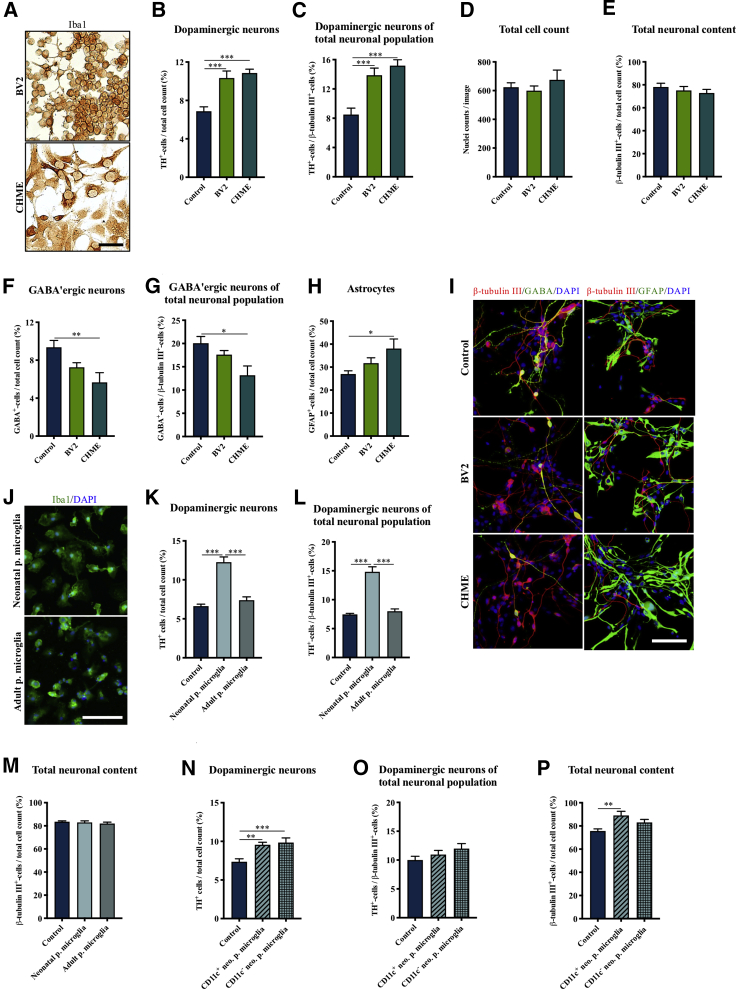
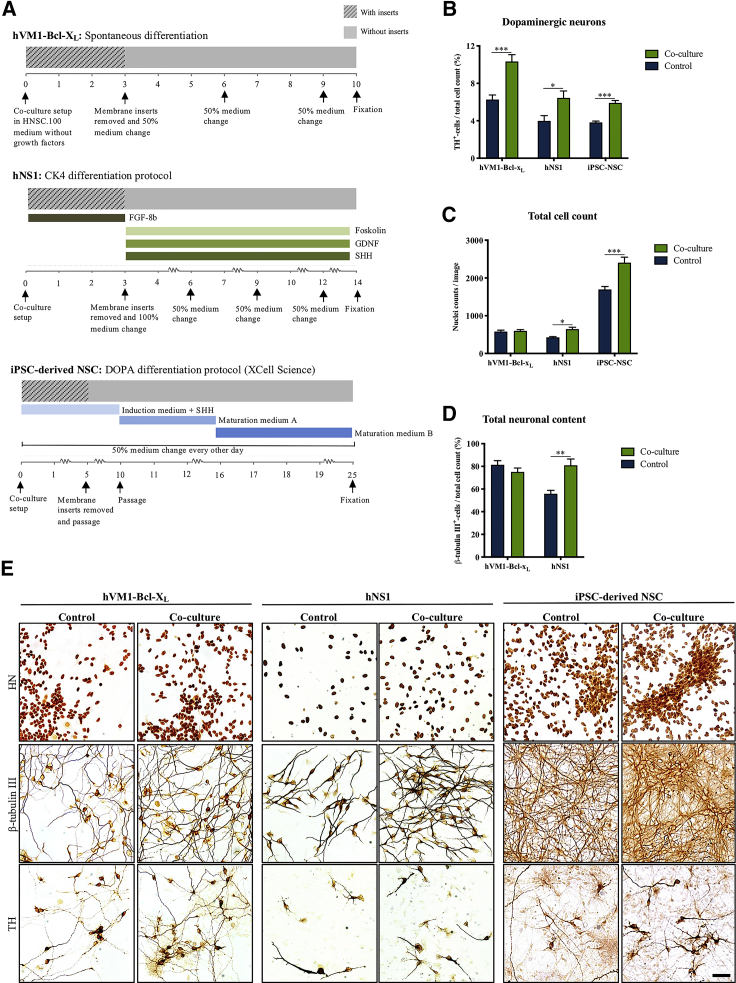
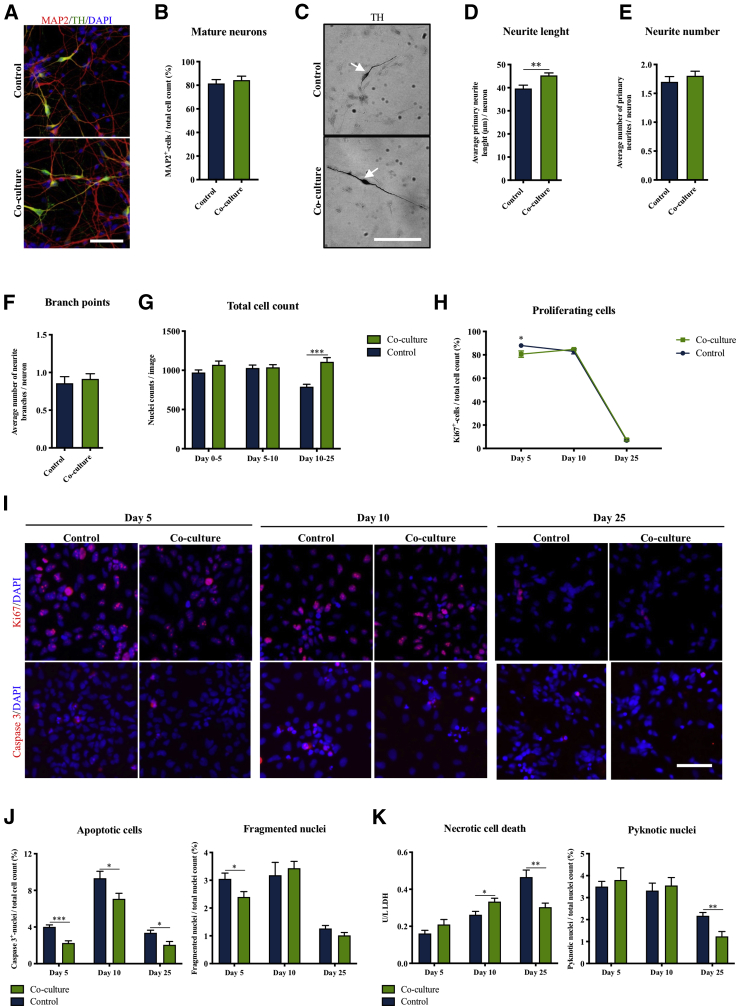
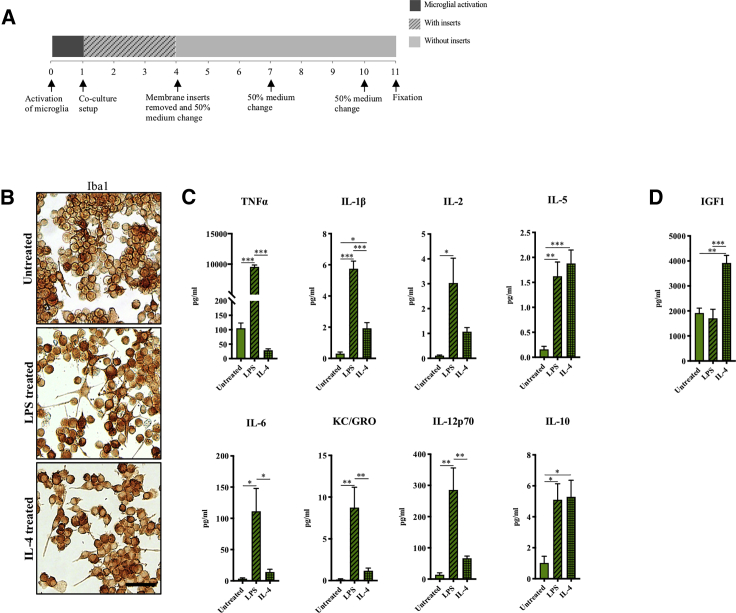
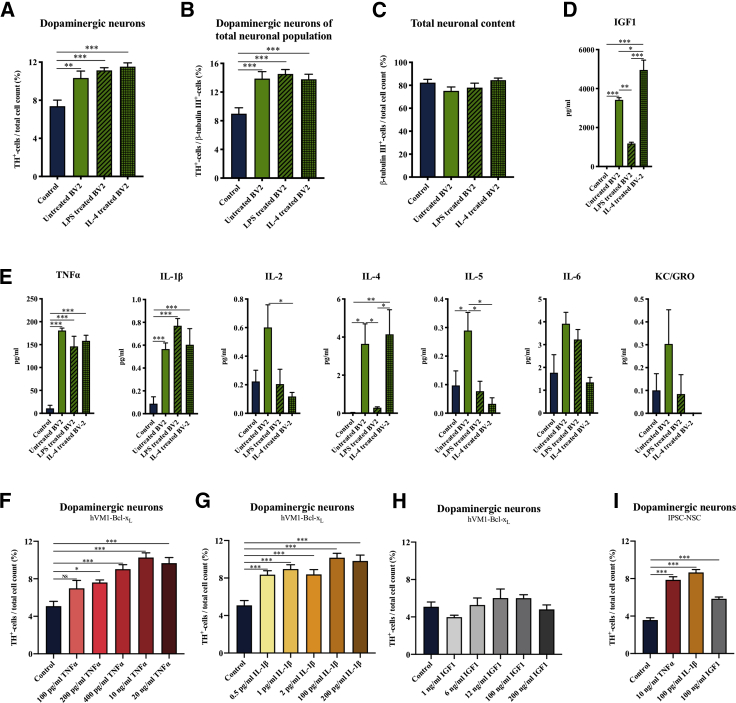
Microglia have recently been established as key regulators of brain development. However, their role in neuronal subtype specification remains largely unknown. Using three different co-culture setups, we show that microglia-secreted factors enhance dopaminergic differentiation of somatic and induced pluripotent stem cell-derived human neural stem cells (NSCs). The effect was consistent across different NSC and microglial cell lines and was independent of prior microglial activation, although restricted to microglia of embryonic origin. We provide evidence that the effect is mediated through reduced cell proliferation and decreased apoptosis and necrosis orchestrated in a sequential manner during the differentiation process. tumor necrosis factor alpha, interleukin-1β, and insulinlike growth factor 1 are identified as key mediators of the effect and shown to directly increase dopaminergic differentiation of human NSCs. These findings demonstrate a positive effect of microglia on dopaminergic neurogenesis and may provide new insights into inductive and protective factors that can stimulate in vitro derivation of dopaminergic neurons.

Keywords: IGF1; IL-1β; NSCs; Parkinson’s disease; TNFα; co-culture; dopamine; microglia; neuron-microglia interaction; secretome analysis.


Figures

None
Graphical abstract
Figure 1
Figure 1
Increased Dopaminergic Differentiation of NSCs Using Different Microglia Co-culture Setups (A) hVM1-Bcl-XL NSCs were either exposed to BV2 microglia-conditioned medium, directly co-cultured with BV2 microglia (physical contact), or indirectly co-cultured (separated by semi-porous membrane inserts). (B–E) Immunocytochemical staining and quantification of differentiated neurons for (C) β-tubulin III+ neurons/total cell count, (D) TH+ neurons/total cell count, and (E) the number of TH+ neurons/β-tubulin III+ neurons. Scale bar: 100 μm. One-way ANOVA, Dunnett's multiple comparison test with reference to control. Day 10: control, n = 23, N = 6; conditioned medium, n = 16, N = 4; direct contact, n = 6, N = 2; inserts, n = 13, N = 4. Day 6: control, n = 14, N = 4; direct contact, n = 14, N = 4. (F and G) TH+ neurons/total cell count and Western blotting for β-tubulin III and TH in differentiated hVM1-Bcl-XL NSCs cultures after combining the indirect co-culture setup with physiological O2tension (3% O2). Two-way ANOVA, Tukey's multiple comparison test. Control, n = 14, N = 4; co-culture, n = 13, N = 4. (H and I) Synaptophysin+ objects/100 μm neurite. Scalebar: 5 μm. One-way ANOVA, Dunnett's multiple comparison test with reference to control. Day 10: control, n = 6, N = 2; conditioned medium, n = 6, N = 2; direct contact, n = 4, N = 2, inserts, n = 6, N = 2. Day 6: control, n = 4, N = 2; direct contact, n = 4, N = 2. Mean ± SEM. p < 0.05, ∗∗p < 0.01, ∗∗∗p < 0.001, NS = not significant. See Figures S1 for additional data.
Figure 2
Figure 2
Microglia Co-culture Increased Expression of Dopaminergic and Midbrain-Specific Markers (A) qRT-PCR data for the plasma membrane DAT, VMAT2, the midbrain-specific transcription factors PITX3, the homeobox protein EN1, AADC, and the midbrain dopaminergic LMX1A upon co-culture differentiation of hVM1-Bcl-XL NSCs and BV2 microglia. Student's t test. Control, n = 4, N = 2; co-culture, n = 4, N = 2. Mean ± SEM. p < 0.05, ∗∗p < 0.01, ∗∗∗p < 0.001. (B) Expression of the floorplate marker FOXA2 in TH+ neurons. Scale bar: 100 μm.
Figure 3
Figure 3
Consistent Positive Effect on Dopaminergic Differentiation Across Different Microglia Cell Lines (A) Immunocytochemical staining of murine BV2 and human CHME microglia cells for the microglial marker Iba1. Scale bar: 50 μm. (B–E) Immunocytochemical staining and quantification of hVM1-Bcl-XL NSC-derived neurons after CHME and BV2 microglia co-culture differentiation for (B) TH+ neurons/total cell count, (C) TH+ neurons/β-tubulin III+ neurons, (D) total cell count, and (E) β-tubulin III+ neurons/total cell count. Control, n = 21, N = 8; BV2, n = 15, N = 5; CHME, n = 12, N = 5. (F–I) Immunofluorescence staining and quantification of (F and I) GABA+ neurons/total cell count, (G) GABA+ neurons/β-tubulin III+ neurons, and (H and I) GFAP+-astrocytes/total cell count. Scale bar: 100 μm. Control, n = 6, N = 2; BV2, n = 6, N = 2; CHME, n = 6, N = 2. (J) Immunofluorescence staining of neonatal and adult primary microglia (p. microglia) for the microglial marker Iba1. Scale bar: 100 μm. (K–M) Quantification of (K) TH+ neurons/total cell count; control, n = 18, n = 4; neonatal p. microglia, n = 9, N = 2; adult p. microglia, n = 12, N = 4, (L) β-tubulin III+ neurons/total cell count, and (M) TH+ neurons/β-tubulin III+ neurons; control, n = 14, n = 4; neonatal p. microglia, n = 9, N = 2; adult p. microglia, n = 8, N = 2, after differentiation of hVM1-Bcl-XL NSCs in co-culture with murine neonatal or adult p. microglia. (N–P) Quantification of (N) TH+ neurons/total cell count, (O) β-tubulin III+ neurons/total cell count, and (P) TH+ neurons/β-tubulin III+ neurons after differentiating hVM1-Bcl-XL NSCs co-cultured with murine CD11c+ or CD11c neonatal p. microglia. Control, n = 17, N = 6; CD11c+neo. p. microglia, n = 10, N = 4, CD11cneo. p. microglia, n = 10, N = 4. Mean ± SEM. One-way ANOVA, Dunnett's multiple comparison test with reference to control. p < 0.05, ∗∗p < 0.01, ∗∗∗p < 0.001. See Figures S2–S4 for additional data.
Figure 4
Figure 4
Microglia Co-culture Consistently Increases Dopaminergic Differentiation of Different NSC Lines (A) Graphical representation of the three different dopaminergic differentiation protocols applied for the hVM1-Bcl-XL, hNS1, and iPSC-derived NSCs and the period of BV2 microglia co-culturing. (B–E) Effect of BV2 microglia co-culture differentiation on all three NSC lines as measured by (B and E) TH+ neurons/total cell count (C and E) total cell count and (D and E) β-tubulin III+ neurons/total cell count. Scale bar: 50 μm. Multiple t test, Holm-Sidak's multiple comparison test. HVM1-Bcl-XL: control, n = 15, N = 5; co-culture, n = 15, N = 5. hNS1: control, n = 8, N = 2; co-culture, n = 8, N = 2. iPSC-NSCs: control, n = 17, N = 4; co-culture, n = 15, N = 4. Mean ± SEM. p < 0.05, ∗∗p < 0.01, ∗∗∗p < 0.001.
Figure 5
Figure 5
Microglia Co-culture Affects Neurite Outgrowth, Proliferation, and Cell Death of NSCs (A and B) Immunofluorescence staining and quantification of iPSC-NSC/BV2 co-culture and control differentiated cultures for the mature pan neuronal marker microtubule-associated protein (MAP2)/total cell count. Scale bar: 50 μm. Student's t test. Control, n = 7, N = 3; co-culture, n = 7, N = 3. (C–F) Morphological analysis of TH+ neurons in hNS1 NSC/BV2 co-culture assessing (D) neurite length, (E) neurite number, and (F) number of neurite branch points. Scale bar: 100 μm. Student’s t test. Control, n = 8, N = 2; co-culture, n = 8, N = 2. (G) Total cell counts at days 5, 10, and 25 during differentiation of iPSC-NSCs in co-culture with BV2. Multiple t test, Holm-Sidak's multiple comparison test. Days 0–5 and 5–10: control, n = 6, N = 2; co-culture, n = 6, N = 2. Days 10–25: control, n = 19, N = 4; co-culture, n = 14, N = 4. (H–J) (H and I) Immunofluorescence staining and quantification of iPSC-NSCs for the proliferation marker Ki67 at days 5, 10, and 25 during differentiation. Scale bar: 50 μm. Multiple t tests, Holm-Sidak's multiple comparison test. Day 5 and 10: control, n = 6, N = 2; co-culture, n = 6, N = 2. Day 25: control, n = 9, N = 4; co-culture, n = 7, N = 4. (I and J) Apoptotic cell death in iPSC-NSC/BV2 co-culture at days 5, 10, and 25 during differentiation measured by immunofluorescence staining and quantification of cleaved caspase 3+ nuclei/total cell count and fragmented nuclei/total cell count. Multiple t test, Holm-Sidak's multiple comparison test. Days 5, 10, and 25: control, n = 6, N = 2; co-culture, n = 6, N = 2. (K) Necrotic cell death in iPSC-NSC/BV2 co-culture at days 5, 10, and 25 during differentiation measured by lactate dehydrogenase (LDH) release to the medium and pyknotic nuclei/total cell count. Multiple t test, Holm-Sidak's multiple comparison test. Day 5: control, n = 6, N = 2; co-culture; n = 6, N = 2. Days 10 and 25: control, n = 12, N = 4; co-culture, n = 12, N = 4. Mean ± SEM. p < 0.05, ∗∗p < 0.01, ∗∗∗p < 0.001.
Figure 6
Figure 6
Microglial Cells Treated with LPS and IL-4 show Pro- and Anti-inflammatory Activation Profiles, Respectively (A) BV2 microglia were activated with 100 ng/mL LPS or 20 ng/mL IL-4 for 24 h prior to co-culture with hVM1-Bcl-XL cells. (B) Immunocytochemical staining of activated BV2 microglia for the microglial marker Iba1. Scale bar: 100 μm. (C) Cytokine profiling of microglia medium after 24 h of activation. Untreated, n = 5, N = 3; LPS, n = 7, N = 4; IL-4, n = 7, N = 4. (D) ELISA for IGF1 of microglia medium at 24 h post activation. Untreated, n = 4, N = 3; LPS, n = 6, N = 4; IL-4, n = 6, N = 4. One-way ANOVA, Tukey's multiple comparison test. Mean ± SEM. p < 0.05, ∗∗p < 0.01, ∗∗∗p < 0.001. See Figures S5 and S7 for additional data.
Figure 7
Figure 7
Increased Dopaminergic Differentiation of NSCs Independent on Prior Microglial Activation and Identification of TNFα, IL-1β, and IGF1 as Potential Mediators (A–C) Immunocytochemical staining and quantification of hVM1-Bcl-XL NSC-derived neurons after co-culture differentiation with pro- and anti-inflammatory activated BV2 microglia for (A) TH+ neurons/total cell count, (B) TH+ neurons/β-tubulin III+ neurons, and (C) β-tubulin III+ neurons/total cell count. One-way ANOVA, Dunnett's multiple comparison test with reference to control. Control, n = 20, N = 7; untreated BV2, n = 15, N = 5; LPS-treated BV2, n = 10, N = 4; IL-4 treated BV2, n = 12, N = 5. (D) IGF1 ELISA; all groups, n = 4, N = 2, and (E) cytokine profiling; control, n = 6, N = 3; untreated BV2, LPS-treated BV2, and IL-4 treated BV2, n = 4, N = 2, of co-culture medium collected at day 3 of differentiation. One-way ANOVA, Tukey's multiple comparison test. (F–H) Effect on TH+ neurons/total cell count of direct addition of recombinant human (F) TNFα, (G) IL-1β, and (H) IGF1 to hVM1-Bcl-XL NSCs during differentiation. One-way ANOVA, Dunnett's multiple comparison test with reference to control. All groups, n = 6, N = 2. (I) Most efficient concentrations of recombinant TNFα, IL-1β, and IGF1 tested on iPSC-NSCs. One-way ANOVA, Dunnett's multiple comparison test with reference to control. All groups, n = 6, N = 2. Mean ± SEM. p < 0.05, ∗∗p < 0.01, ∗∗∗p < 0.001, NS = not significant. See Figures S6 and S7 for additional data.

References

    1. Blasi E., Barluzzi R., Bocchini V., Mazzolla R., Bistoni F. Immortalization of murine microglial cells by a v-raf/v-myc carrying retrovirus. J. Neuroimmunol. 1990;27:229–237. - PubMed
    1. Bogetofte H., Jensen P., Ryding M., Schmidt S.I., Okarmus J., Ritter L., Worm C.S., Hohnholt M.C., Azevedo C., Roybon L. PARK2 mutation causes metabolic disturbances and impaired survival of human iPSC-derived neurons. Front. Cell Neurosci. 2019;13:297. - PMC - PubMed
    1. Bohlen C.J., Bennett F.C., Bennett M.L. Isolation and culture of microglia. Curr. Protoc. Immunol. 2019;125:e70. - PMC - PubMed
    1. Butovsky O., Ziv Y., Schwartz A., Landa G., Talpalar A.E., Pluchino S., Martino G., Schwartz M. Microglia activated by IL-4 or IFN-gamma differentially induce neurogenesis and oligodendrogenesis from adult stem/progenitor cells. Mol. Cell Neurosci. 2006;31:149–160. - PubMed
    1. Chen E., Xu D., Lan X., Jia B., Sun L., Zheng J.C., Peng H. A novel role of the STAT3 pathway in brain inflammation-induced human neural progenitor cell differentiation. Curr. Mol. Med. 2013;13:1474–1484. - PMC - PubMed

Publication types

MeSH terms