. 2021 Feb 9;16(2):354-369.
doi: 10.1016/j.stemcr.2020.12.013. Epub 2021 Jan 21.

Gastruloid Development Competence Discriminates Different States of Pluripotency

Affiliations

Gastruloid Development Competence Discriminates Different States of Pluripotency

Federica Cermola et al. Stem Cell Reports. .

Abstract

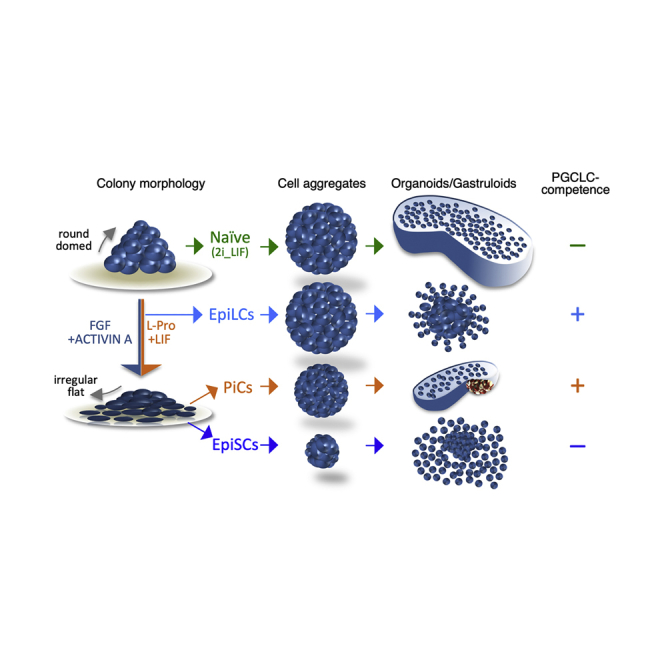
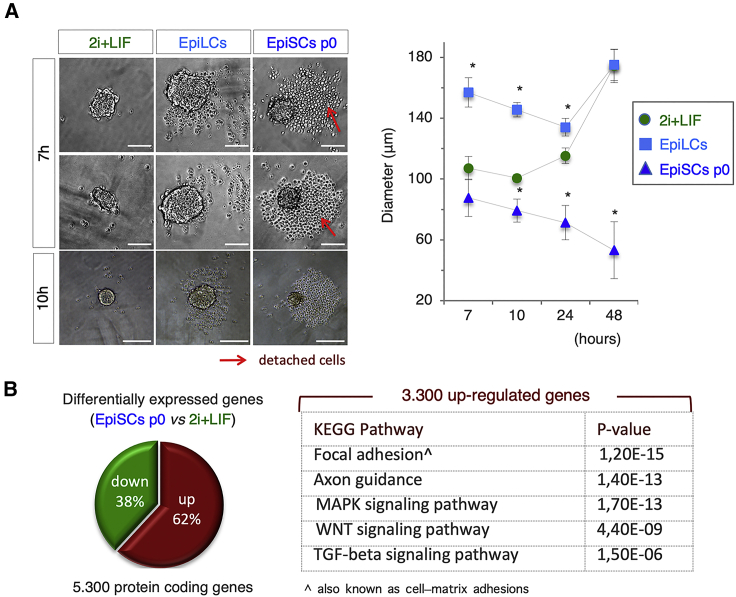
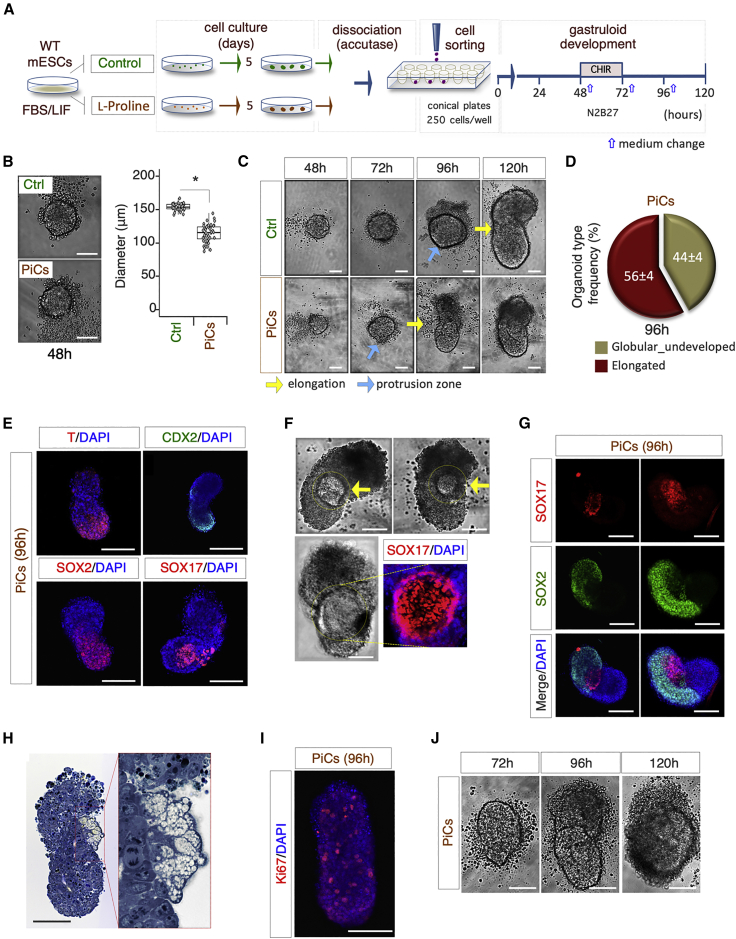
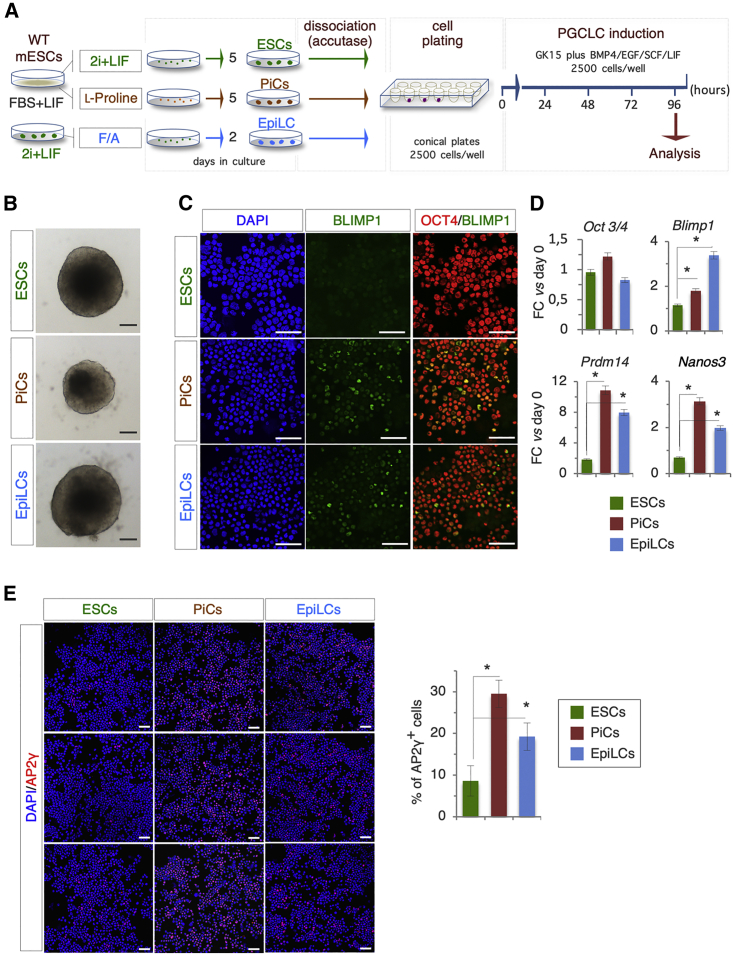
Floating spheroidal aggregates of mouse embryonic stem cells can develop into polarized/elongated organoids, namely gastruloids. We set up a high-performing assay to measure gastruloid formation efficiency (GFE), and found that GFE decreases as pluripotency progresses from naive (GFE ≥ 95%) to primed (GFE = 0) state. Specifically, we show that primed EpiSCs fail to generate proper cell aggregates, while early-primed EpiLCs aggregate but eventually fail to develop into elongated gastruloids. Moreover, we characterized proline-induced cells (PiCs), a LIF-dependent reversible early-primed state of pluripotency, and show that PiCs are able to generate gastruloids (GFE ∼ 50%) and are also competent to differentiate into primordial germ cell-like cells. Thus, we propose the GFE assay as a valuable functional tool to discriminate different states of the pluripotency continuum.

Keywords: Cripto; Nodal; epiblast stem cells; epiblast-like cells; gastruloid development; pluripotency; primordial germ cell-like cells; proline; proline-induced cells.


Figures

None
Graphical abstract
Figure 1
Figure 1
Efficiency of the Optimized Gastruloid Formation Assay (A) Schematic representation of the experimental design. WT (TBV2) mESCs were plated in 2i + LIF at 250 cells/cm2 on gelatin-coated plates. (B) Representative bright-field images of aggregate-to-gastruloid transition at the indicated time points after aggregation. Light blue arrow indicates the protrusion zone (bar, 100 μm). (C) Pie chart quantification of the different organoid phenotypes, i.e., without protrusions with a defined A-P axis (“Elongated”) or with protrusions and a defined A-P axis (“Elongated_Protrusions”). Data are expressed as mean ± SD (n = 3; 180 gastruloids analyzed). (D) Boxplot diagrams of aggregate diameter distribution at 48 h (left) and gastruloid length (middle) and volume (π·r2·h; right) at 120 h (n = 3; 60 gastruloids/time point). (E) Representative bright-field (left) and confocal images (middle and right) of gastruloids stained with CDX2, NESTIN (green), T/BRA, SOX2, and SOX17 (red). Nuclei were counterstained with DAPI (bar, 200 μm). (F) Representative pictures of gastruloid sections stained with toluidine blue; red arrows indicate dividing cells (bar, 100 μm). (G) Representative confocal image of Ki67 immunostaining of gastruloids. Nuclei were counterstained with DAPI (blue) (bar, 100 μm). See also Figure S1.
Figure 2
Figure 2
Cripto Genetic Ablation Impairs Gastruloid Formation (A) Schematic representation of the experimental design. WT (R1) and Cripto KO mESCs were plated in 2i + LIF at low density on gelatin-coated plates. (B) Representative bright-field images (left) and diameter distribution (right) of R1 (WT) and Cripto KO clone #1 (Cl.#1) and clone #2 (Cl.#2) mESC-derived aggregates at 48 h (n = 3; 30 gastruloids/condition; p < 0.01; bar, 100 μm). (C) Representative bright-field images of WT and Cripto KO ESC-derived gastruloids/organoids (left) and quantification (right) of undeveloped WT and Cripto KO organoids at 120 h. Data are expressed as mean ± SD (n = 3; 60 organoids/condition; p < 0.01; bar, 100 μm). (D) Schematic representation of CRIPTO rescue experiment. Soluble CRIPTO protein (sCRIPTO, 10 μg/mL) was added at 24 h. (E) Representative bright-field images (left) of Cripto KO ± sCRIPTO-derived gastruloids/organoids. Pie chart quantification of the different organoid type frequencies (right). Data are expressed as mean ± SD (n = 3; 30 gastruloids/condition analyzed; bar, 100 μm). (F) Representative confocal images of WT and Cripto KO ± sCRIPTO-derived organoids stained with CDX2 (green), T/BRA, SOX2, and SOX17 (red). Nuclei were counterstained with DAPI (blue) (bar, 100 μm). (G) Representative confocal images of Cripto KO ± ACTIVIN A-derived organoids (120 h AA) with SOX2 (red) and NESTIN (green). Nuclei were counterstained with DAPI (blue) (bar, 100 μm). See also Figure S2.
Figure 3
Figure 3
F/A-primed Pluripotent Cells Fail to Generate Gastruloids (A) Schematic representation of the experimental design. F/A, FGF/ACTIVIN A. (B) Representative bright-field images of 2i + LIF ESCs, EpiLCs, and EpiSC-derived aggregates at 48 h (left) and boxplot diagram (right) of the distribution of the diameters. Red arrows indicate detached cells and debris (n = 3; 30 gastruloids/condition; bar, 100 μm;p < 0.01). (C) Representative bright-field images of the gastruloids and aggregates derived from 2i + LIF ESCs, EpiLCs, and EpiSCs, respectively. Data are expressed as mean ± SD (n = 3; 60 gastruloids/organoids/condition) (bar, 50 μm). (D) Representative bright-field images (left) of 2i + LIF ESC-, EpiSC p0-, and EpiSC p6-derived aggregates/gastruloid-like organoids at the indicated time points, and quantification (right) of the elongated gastruloids at 120 h. Data are expressed as mean ± SD (n = 3; 60 gastruloids/condition; bar, 100 μm; p < 0.01). (E) Representative bright-field images (left) of gastruloids/organoids derived from 2i + LIF- and F/A-treated cells at the indicated time points (bar, 200 μm) and quantification of percentage (right) of elongated gastruloids. Data are expressed as mean ± SD (n = 3; 60 gastruloids/condition; p < 0.01). See also Figure S3.
Figure 4
Figure 4
Gastruloid Aggregation Kinetics (A) Representative bright-field images (left) of aggregates derived from 2i + LIF ESCs, EpiLCs, and EpiSCs p0 at the indicated time points (bar, 100 μm). Red arrows indicate detached cells. Time course quantification (right) of diameters of 2i + LIF ESC-, EpiLC-, and EpiSC p0-derived aggregates. Data are expressed as mean ± SD (n = 3; 30 gastruloids/condition; p < 0.01). (B) Pie chart quantification of differentially expressed genes (left) and KEGG pathway enrichment (right) of upregulated genes in EpiSCs p0 versus 2i + LIF.
Figure 5
Figure 5
Proline-treated ESCs Are Competent for Gastruloid Formation (A) Schematic representation of experimental design. (B) Representative bright-field pictures (left) of control (Ctrl) and PiC-derived aggregates (48 h) and boxplot diagram (right) of diameter distribution (n = 3; 45 gastruloids/condition; p < 0.01; bar, 100 μm). (C) Representative bright-field images of globular aggregate-to-elongated gastruloid transition of PiCs and Ctrl cells (bar, 100 μm). Light blue and yellow arrows indicate the protrusion zone and the ovoidal-to-elongated shape transition, respectively. (D) Pie chart quantification of PiC-derived organoid type frequency at 96 h. Data are expressed as mean ± SD (n = 3; 60 gastruloids analyzed). (E) Representative confocal images of PiC-derived gastruloids stained with T/BRA, SOX2, SOX17 (red), and CDX2 (green). Nuclei were counterstained with DAPI (bar, 200 μm). (F) Representative bright-field and confocal images of PiC-derived gastruloids (96 h) showing the SOX17-positive area (yellow arrows) (bar, 100 μm). (G) Representative confocal images of PiC-derived gastruloids stained with SOX17 (red) and SOX2 (green). Nuclei were counterstained with DAPI (bar, 100 μm). (H) Representative pictures of toluidine blue-stained sections of PiC-derived gastruloids (96 h). Picture enlargement shows a differentiated area (bar, 100 μm). (I) Representative confocal image of PiC-derived gastruloid stained with Ki67. Nuclei were counterstained with DAPI (bar, 100 μm). (J) Representative bright-field images of PiC-derived organoids at the indicated time points (bar, 100 μm). See also Figure S4.
Figure 6
Figure 6
LIF Dominant Effect on Gastruloid Development (A) Schematic representation of the experimental design (left). ESCs were treated with FGF/ACTIVIN (F/A) ± LIF for 48 h. Representative bright-field images (middle) of F/A_2d ± LIF-derived organoids and quantification (right) of elongated gastruloids (n = 3; 60 gastruloids/condition; p < 0.01; bar, 100 μm). (B) Quantitative real-time PCR analysis of pluripotency and differentiation markers in 2d_F/A ± LIF cells. Data represent fold change versus 2d_F/A-LIF; data are normalized to Gapdh and are mean ± SD (n = 3; p < 0.01). (C) Representative confocal images (top) of OCT4, NANOG (green), and T/BRA (red) staining on cytospun EpiLCs ± LIF. Single-channel images of OCT4 and T/BRA double staining are shown. Nuclei were counterstained with DAPI. Quantification (bottom) of OCT4- and NANOG-positive cells. Data are mean ± SD (bar, 50 μm; n = 3; p < 0.01). (D) Schematic representation of the experimental design. EpiLC-derived aggregates were treated ± LIF (0–48 h) (left). Representative bright-field images (middle) of EpiLCs ± LIF-derived organoids, and quantification (right) of elongated gastruloids. Data are expressed as mean ± SD (n = 3; 60 gastruloids/condition; p < 0.01; bar, 100 μm).
Figure 7
Figure 7
Primordial Germ Cell-like Cell (PGCLC) Competence Discriminates Different Pluripotent States (A) Schematic representation of the experimental strategy. (B) Representative bright-field images of 2i + LIF-, PiC-, and EpiLC-derived aggregates (96 h) obtained as described in (A) (bar, 100 μm). (C) Representative confocal images of cytospun cells from 2i + LIF-, PiC-, and EpiLC-derived aggregates (96 h) double stained with OCT4 (red) and BLIMP1 (green). Nuclei were counterstained with DAPI (bar, 100 μm). (D) Quantitative real-time PCR analysis of Oct3/4, Blimp1, Prdm14, and Nanos3 gene expression under the indicated conditions. Data represent fold change versus day 0; data are normalized to Gapdh and are mean ± SD (n = 3; p < 0.01). (E) Representative confocal images (left) and quantification (right) of AP2-γ-positive cells under indicated conditions (right). Nuclei were counterstained with DAPI. Data are mean ± SD (n = 3; p < 0.01) (bar, 100 μm).

References

    1. Baillie-Johnson P., van den Brink S.C., Balayo T., Turner D.A., Martinez Arias A. Generation of aggregates of mouse embryonic stem cells that show symmetry breaking, polarization and emergent collective behaviour in vitro. J. Vis. Exp. 2015:53252. - PMC - PubMed
    1. Beccari L., Moris N., Girgin M., Turner D.A., Baillie-Johnson P., Cossy A.C., Lutolf M.P., Duboule D., Arias A.M. Multi-axial self-organization properties of mouse embryonic stem cells into gastruloids. Nature. 2018;562:272–276. - PubMed
    1. Brickman J.M., Serup P. Properties of embryoid bodies. Wiley Interdiscip. Rev. Dev. Biol. 2017;6 doi: 10.1002/wdev.259. - DOI - PubMed
    1. Brons I.G., Smithers L.E., Trotter M.W., Rugg-Gunn P., Sun B., Chuva de Sousa Lopes S.M., Howlett S.K., Clarkson A., Ahrlund-Richter L., Pedersen R.A. Derivation of pluripotent epiblast stem cells from mammalian embryos. Nature. 2007;448:191–195. - PubMed
    1. Casalino L., Comes S., Lambazzi G., De Stefano B., Filosa S., De Falco S., De Cesare D., Minchiotti G., Patriarca E.J. Control of embryonic stem cell metastability by L-proline catabolism. J. Mol. Cell Biol. 2011;3:108–122. - PubMed

Publication types

LinkOut - more resources