. 2021 Mar 8;39(3):346-360.e7.
doi: 10.1016/j.ccell.2020.12.014. Epub 2021 Jan 21.

Patterns of transcription factor programs and immune pathway activation define four major subtypes of SCLC with distinct therapeutic vulnerabilities

Affiliations

Patterns of transcription factor programs and immune pathway activation define four major subtypes of SCLC with distinct therapeutic vulnerabilities

Carl M Gay et al. Cancer Cell. .

Abstract

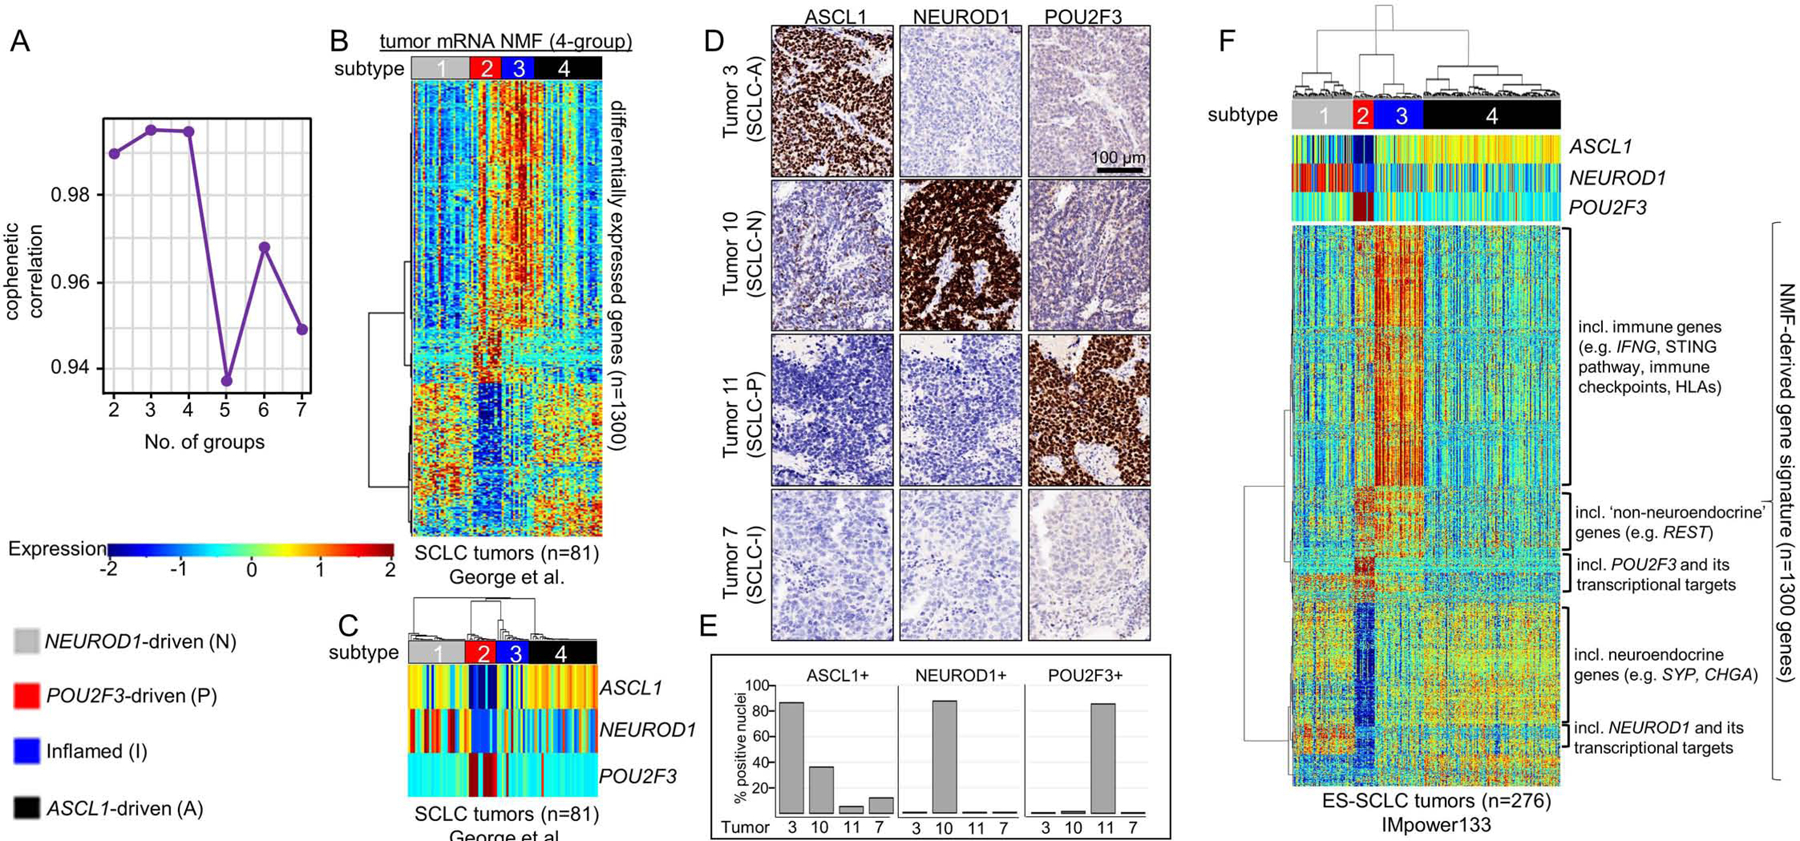
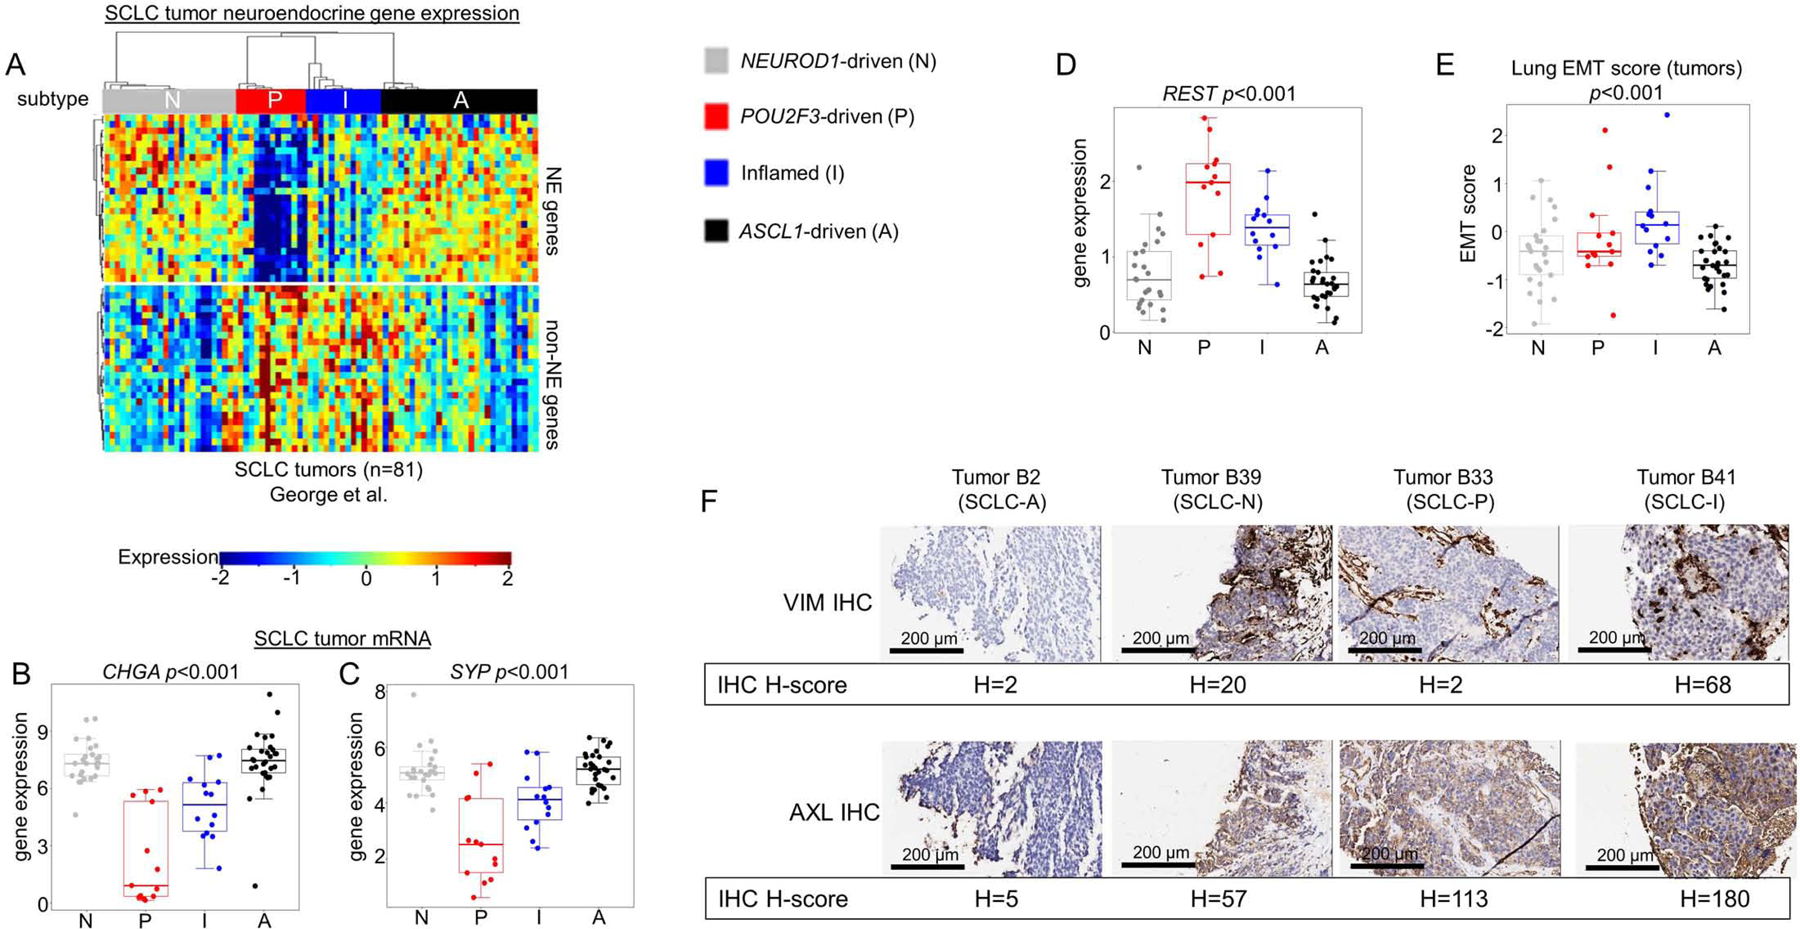
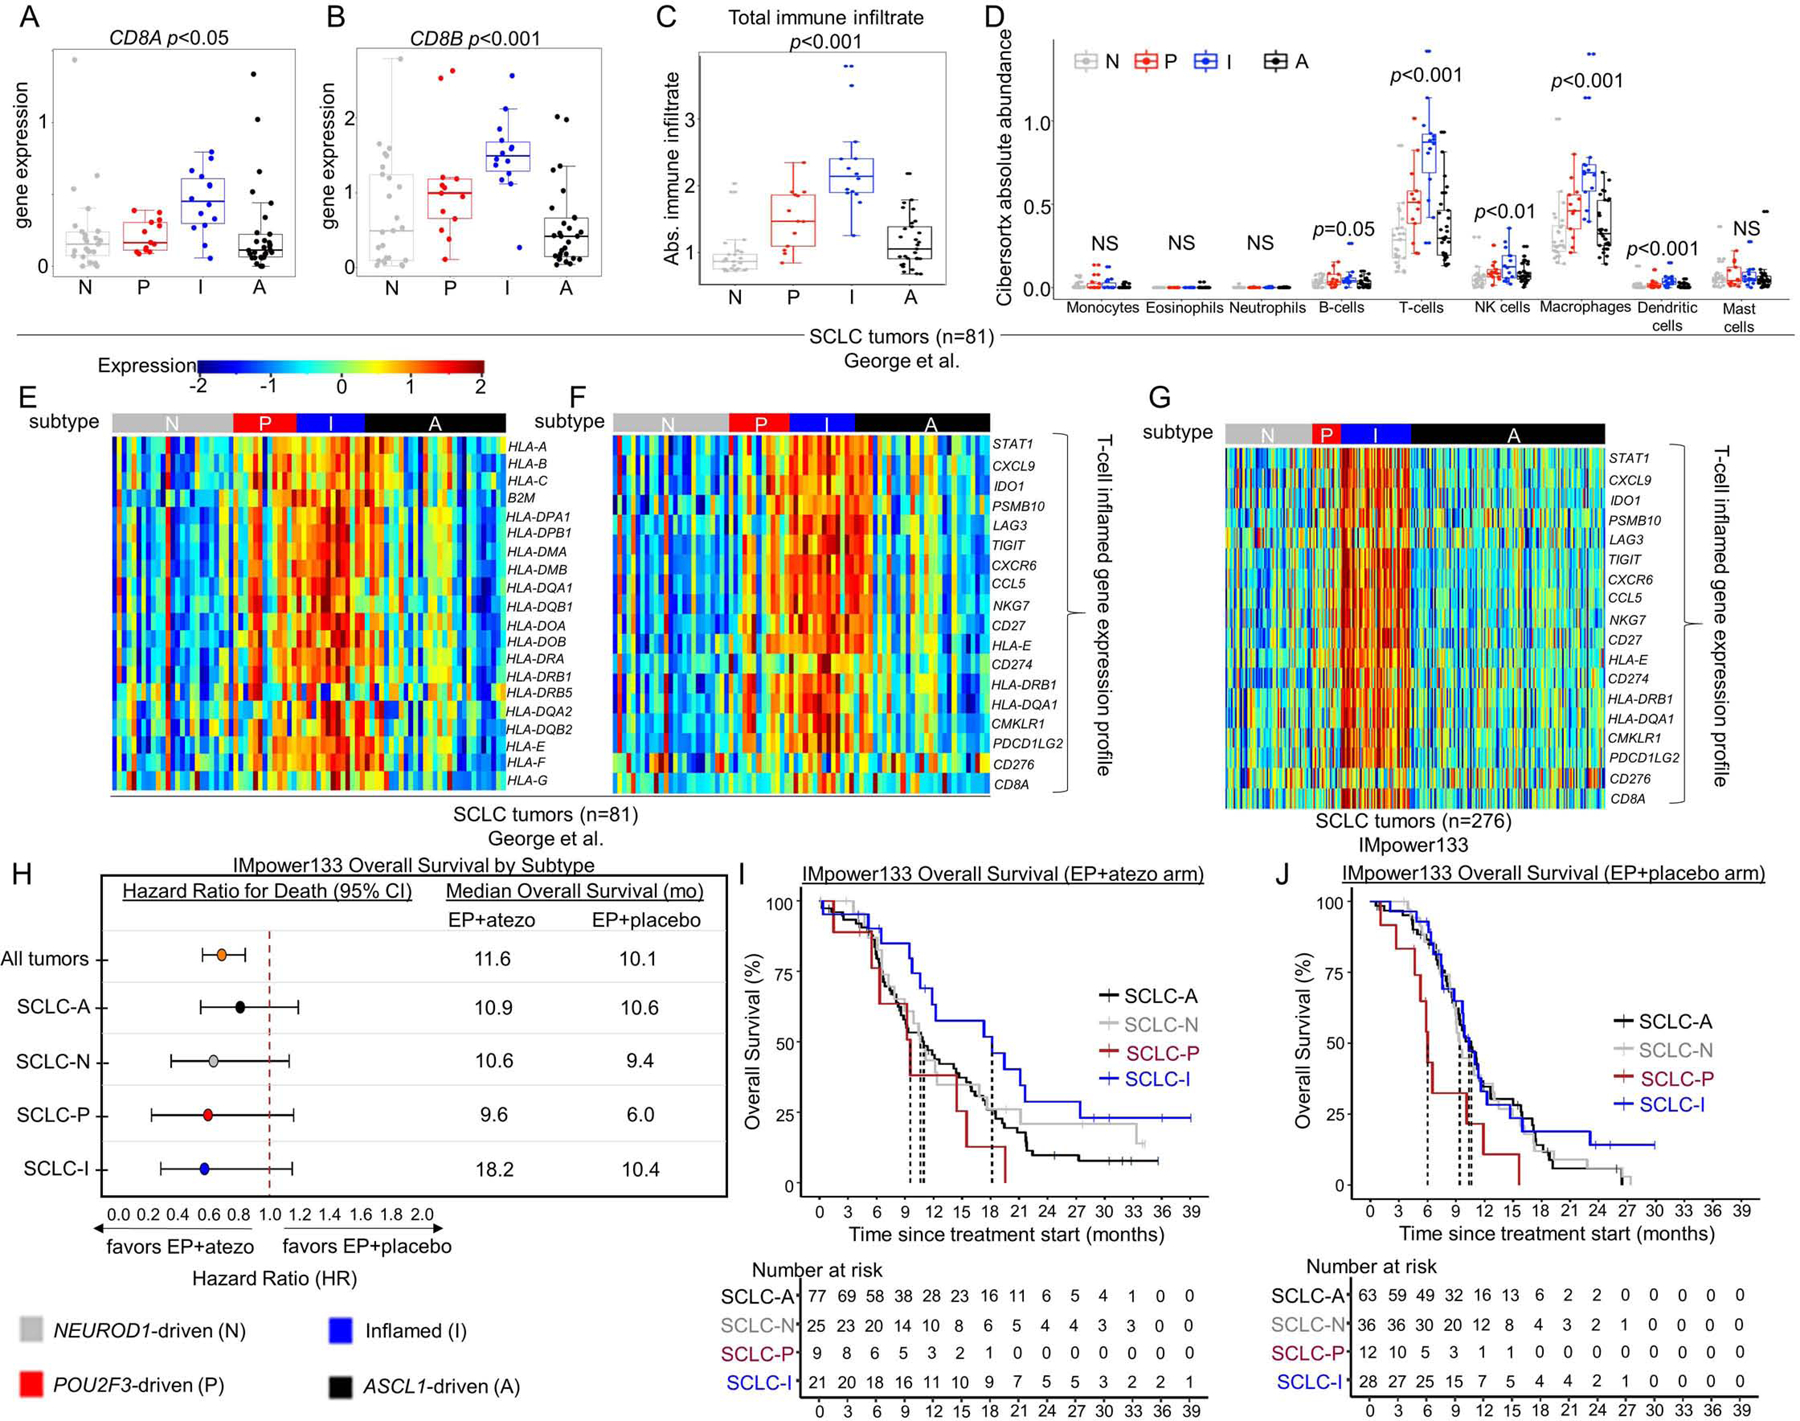
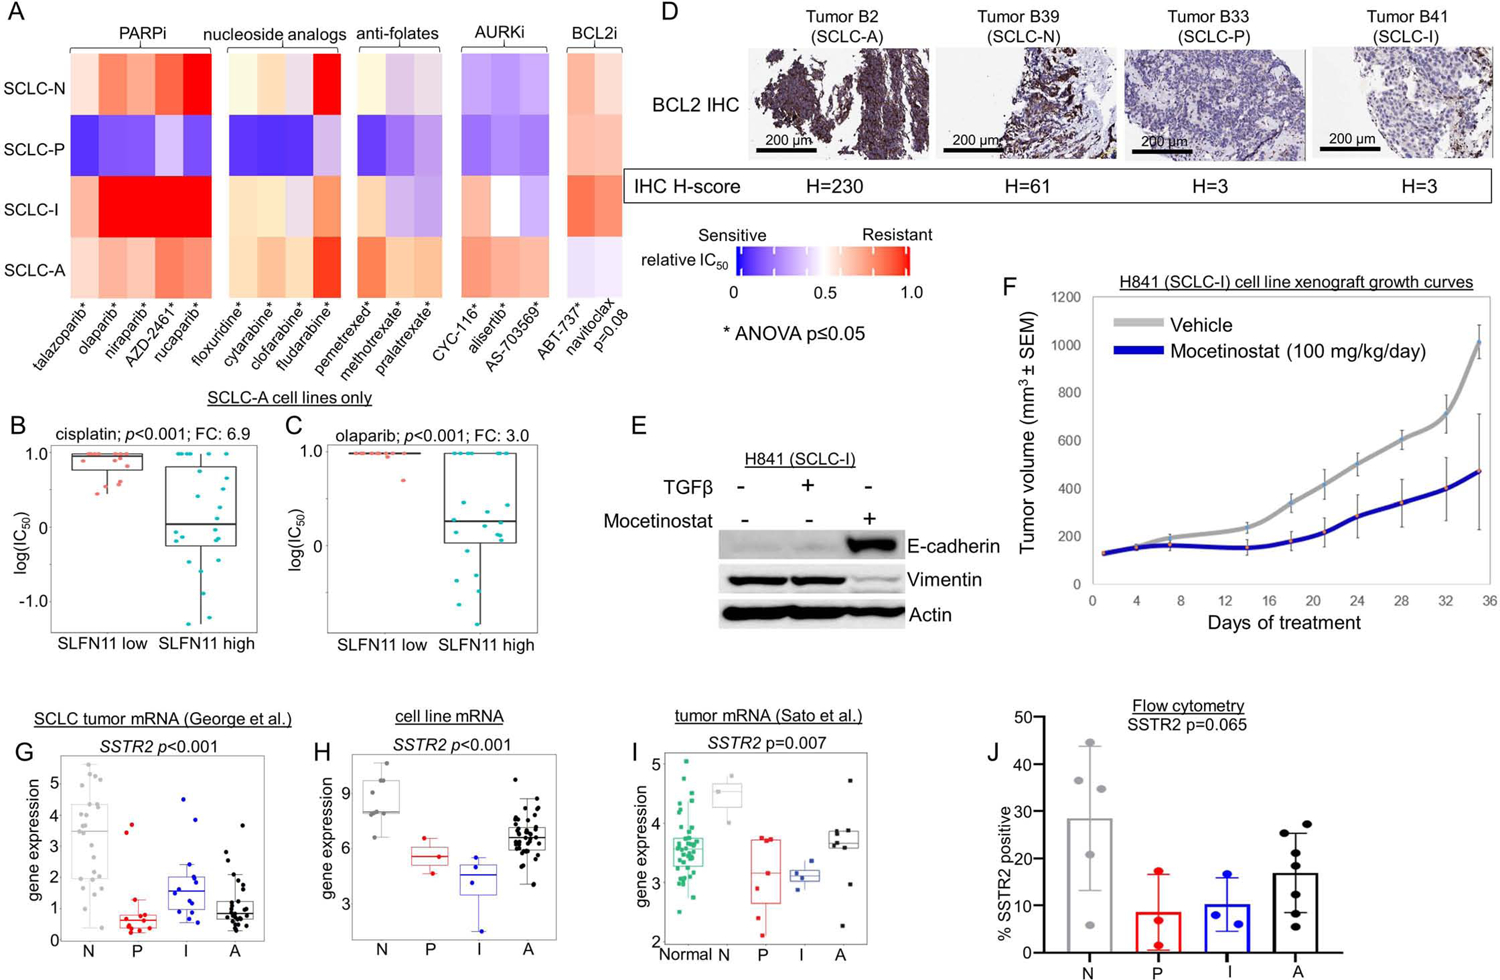
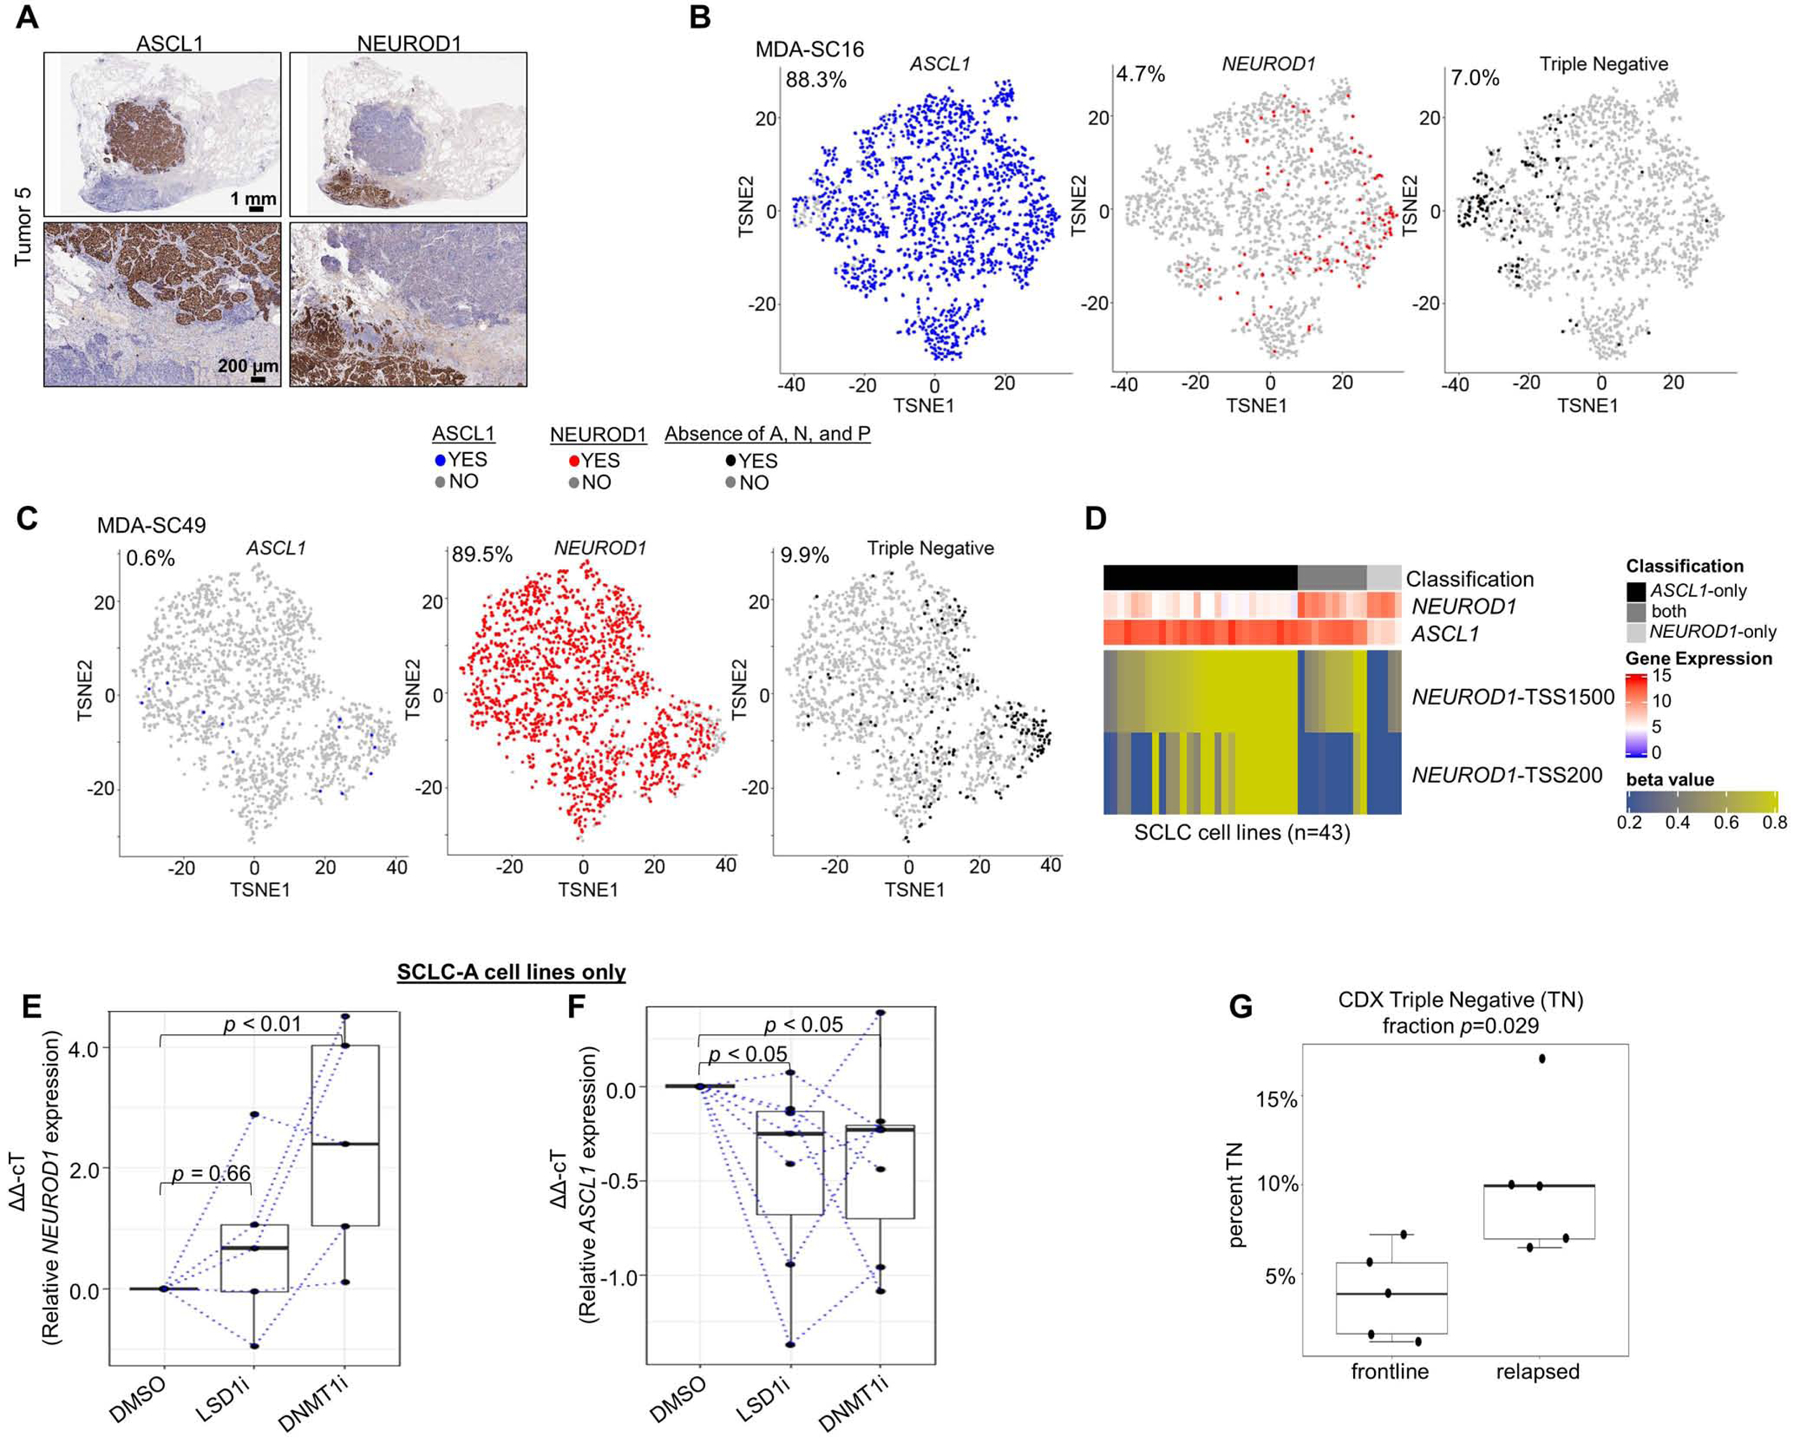
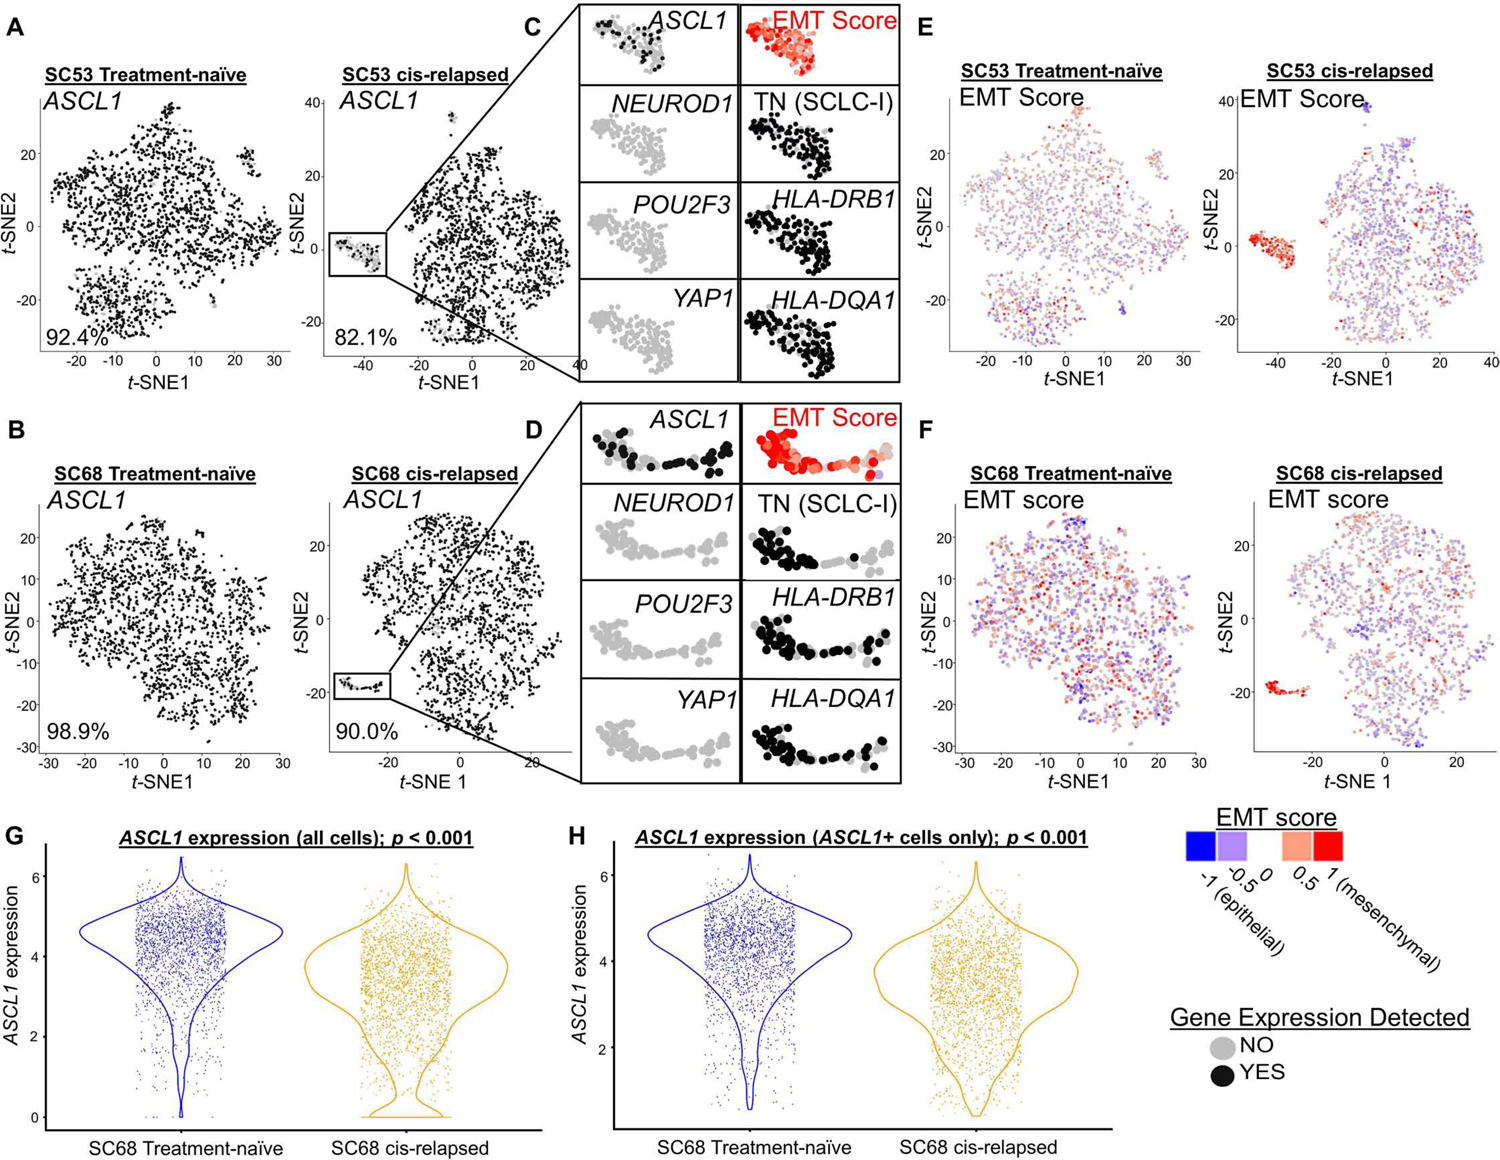
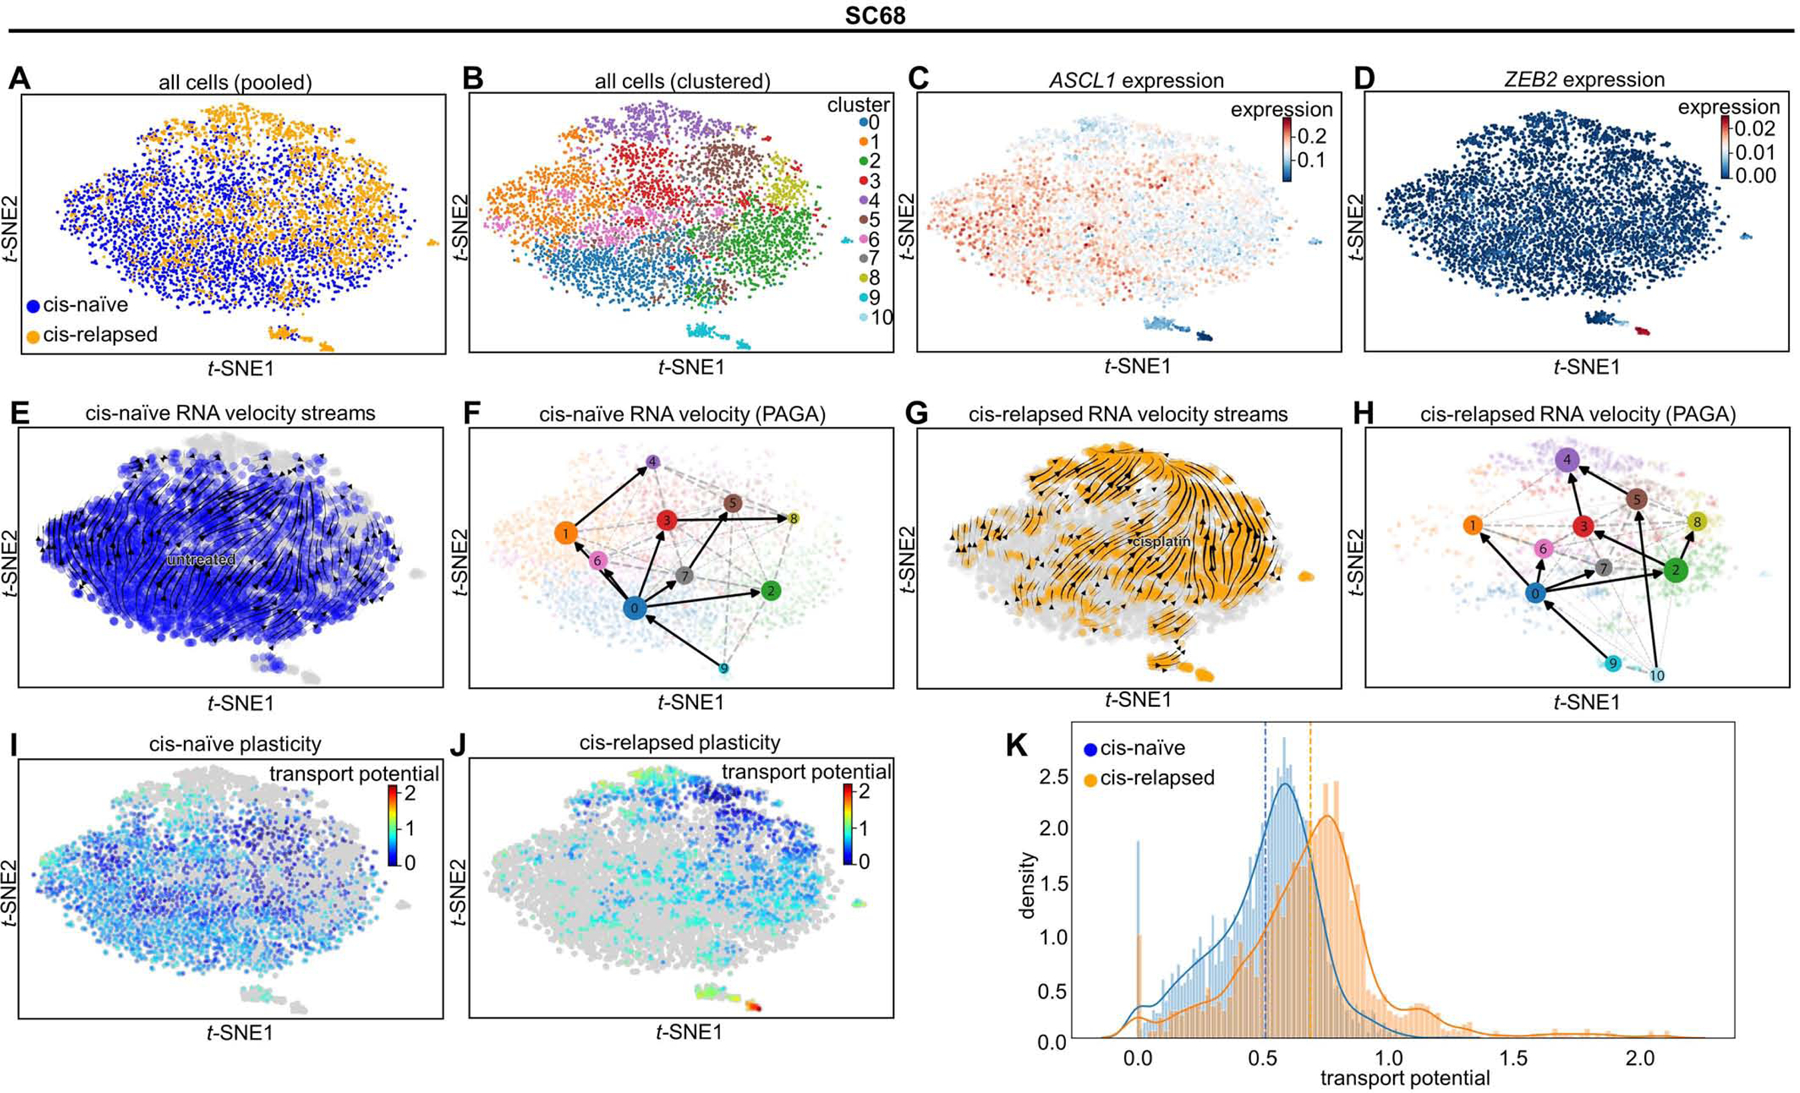
Despite molecular and clinical heterogeneity, small cell lung cancer (SCLC) is treated as a single entity with predictably poor results. Using tumor expression data and non-negative matrix factorization, we identify four SCLC subtypes defined largely by differential expression of transcription factors ASCL1, NEUROD1, and POU2F3 or low expression of all three transcription factor signatures accompanied by an Inflamed gene signature (SCLC-A, N, P, and I, respectively). SCLC-I experiences the greatest benefit from the addition of immunotherapy to chemotherapy, while the other subtypes each have distinct vulnerabilities, including to inhibitors of PARP, Aurora kinases, or BCL-2. Cisplatin treatment of SCLC-A patient-derived xenografts induces intratumoral shifts toward SCLC-I, supporting subtype switching as a mechanism of acquired platinum resistance. We propose that matching baseline tumor subtype to therapy, as well as manipulating subtype switching on therapy, may enhance depth and duration of response for SCLC patients.

Keywords: ASCL1; EMT; NEUROD1; POU2F3; SCLC; intratumoral heterogeneity; neuroendocrine.


Conflict of interest statement

Declaration of interests C.M.G. reports research funding from AstraZeneca. S.H. reports consulting/honoraria from Qiagen, Boehringer Ingelheim and travel funding from Roche. B.Y.Z. and D.S.S. are employees of Genentech, Inc. G.F. is an employee of AstraZeneca and has stock ownership in AstraZeneca. B.G. reports research funding from ISA Pharm, Cue Bio, Pfizer, and Medimmune. I.I.W. reports consulting/advisory roles for Medscape, MSD, Genentech/Roche, PlatformQ Health, Pfizer, Bayer, Bristol-Myers Squibb, AstraZeneca/Medimmune, HTG Molecular, Asuragen, Merck, GlaxoSmithKline, Guardant Health, Oncocyte, and MSD, research support from Genentech, Oncoplex, HTG Molecular, DepArray, Merck, Bristol-Myers Squibb, Medimmune, Adapative, Adaptimmune, EMD Serono, Pfizer, Takeda, Amgen, Karus, Johnson & Johnson, Bayer, Iovance, 4D, Novartis and Akoya. J.V.H. serves on advisory committees for AstraZeneca, Bristol-Myers Squibb, GlaxoSmithKline, Guardant Health, Kairos Venture Investments, BrightPath Biotherapeutics, Hengrui Therapeutics, Eli Lilly, Spectrum, EMD Serono, Roche, and Foundation One Medicine and has research support from AstraZeneca, Spectrum, and Checkmate Pharmaceuticals, as well as royalties/licensing fees from Spectrum and Bio-Tree Systems. L.A.B. serves on advisory committees for AstraZeneca, AbbVie, GenMab, BergenBio, Pharma Mar SA, Sierra Oncology, Merck, Bristol-Myers Squibb, Genentech, and Pfizer and has research support from AbbVie, AstraZeneca, GenMab, Sierra Oncology, Tolero Pharmaceuticals. C.M.G., L.A.B., and J.V.H. have pending patent applications for SCLC subtyping U.S. 62/895,322. Otherwise, there are no pertinent financial or non-financial conflicts of interest to report.

Figures

Figure 1:
Figure 1:. NMF identifies four transcriptional subtypes of SCLC.
Cophenetic correlation from NMF analysis of resected SCLC tumors (A). Differential expression of NMF-selected genes (B) and, specifically, ASCL1, NEUROD1, and POU2F3 (C) across 4 clusters. IHC analysis of consecutive sections of patient SCLC tumor for ASCL1, NEUROD1, and POU2F3 demonstrating staining pattern for example of each of four subtypes (D). Bar graph indicating percentage of tumor cell nuclei positive for ASCL1, NEUROD1, and POU2F3 by IHC in each of four tumors above (E). Application of NMF-derived gene signature to independent ES-SCLC (IMpower133) tumor dataset revealing four SCLC subtypes (F). Sample sizes: n=81 tumors (B-C) and n=276 tumors (F).
Figure 2:
Figure 2:. Molecular and phenotypic distinctions between SCLC subtypes.
Differential expression of NE and non-NE genes across all SCLC tumors within each subtype (A), including comparison of mean expression of NE markers CHGA (B) and SYP (C) and REST, a transcriptional repressor of NE gene expression (D). Lung-specific epithelial-mesenchymal transition (EMT) score calculated for each SCLC tumor with comparison between mean EMT scores for each subtype (E). IHC analysis of representative tumors from SCLC-A and SCLC-N, as well as n=1 tumors of SCLC-I and SCLC-P, for Vimentin (VIM) and AXL protein expression with associated H-score (F). Sample sizes: n=81 tumors (A-E). p-values are the result of one-way ANOVA. Error bars: +/− 1.5x interquartile range (B-E).
Figure 3:
Figure 3:. SCLC-I defines an inflamed subtype of SCLC.
Comparison of mean gene expression of CD8+ T-cell markers (A-B). CIBERSORTx analysis of total immune infiltrate (C) and specific immune cell populations (D). Heatmaps comparing expression of HLA and antigen presenting genes (E) and 18-gene -γ-related T-cell gene expression profile (F) across subtyped SCLC tumors from George et al. Heatmap comparing expression of 18-gene -γ-related T-cell gene expression profile among tumors from IMpower133 (G). Forest plot demonstrating hazard ratios for overall survival and median overall survival values between carboplatin/etoposide + atezolizumab (EP+atezo) and EP+placebo arms in patients from IMpower133 as a collective (all tumors) and by subtype (H). Kaplan-Meier curves on a subtype-by-subtype basis for overall survival in EP+atezo (I) and EP+placebo (J) arms in IMpower133. Sample sizes: n=81 tumors (A-F), 276 tumors (G), and 132 patients (atezo arm) and 139 patients (placebo arm) (H-J). p-values in A-D are the result of one-way ANOVA testing. Error bars: +/− 1.5x interquartile range (A-D) and +/− 95% CI (H).
Figure 4.
Figure 4.. SCLC subtypes possess unique therapeutic vulnerabilities.
Comparison between each SCLC cell line subtype of mean relative in vitro IC50 values for PARP inhibitors, nucleoside analogs, anti-folates, AURK inhibitors, and BCL2 inhibitors (A). Comparison if IC50 values for cisplatin (B) and the PARPi olaparib (C) among SCLC-A cell lines separated into high and low SLFN11 expression. IHC analysis of tumors representing each subtype (representative images for SCLC-A and –N; and n=1 each for SCLC-P and –I) for expression of BCL2, with associated H-score noted (D). Western blot showing expression of E-cadherin and Vimentin in H-841 cell line with addition of TGFβ (EMT inducer) and mocetinostat (E). Murine H841 flank cell line xenograft growth curves with vehicle or mocetinostat treatment (F). Mean expression of the cell surface protein encoding gene SSTR2 in multiple datasets (G-I) along with flow cytometry analysis of proportion of analyzed cells that express SSTR2 protein in subtyped cell lines (J). Sample sizes: n=62 cell lines (A, H), n=38 cell lines (B-C), n=8 mouse tumors per treatment arm 81 tumors (G), n=23 tumors (I), and n=18 cell lines (J). p-values are the result of one-way two-sided T-test (B-C) or one-way ANOVA (A, G-J). Error bars: +/− 1.5x interquartile range (B-C, G-J) or +/− SEM (F).
Figure 5:
Figure 5:. Intratumoral heterogeneity of SCLC subtypes in tumors and tumor-derived models.
Spatially restricted IHC expression patterns of ASCL1 and NEUROD1 in heterogeneous tumor (A). t-SNE feature plots from scRNAseq for ASCL1, NEUROD1, and absence of ASCL1/NEUROD1/POU2F3 (SCLC-I; triple negative) in representative CDX model of SCLC-A (MDA-SC16) (B) and SCLC-N (MDA-SC49) (C) subtypes. Heatmap highlighting differential methylation (beta value) of NEUROD1 promoter both distal and proximal to transcriptional start site (TSS1500 and TSS200, respectively) in cell lines that express ASCL1-only, NEUROD1-only, or both (D). Relative expression of NEUROD1 (E) and ASCL1 (F) among SCLC-A cell lines following treatment with LSD1i and DNMT1i. Comparison of mean fraction of SCLC-I (triple-negative) cells from scRNAseq between CDXs derived from relapsed SCLC patients SCLC (relapsed) and those derived from never treated/currently frontline treated patients (frontline) (G). Sample sizes: n=2000 cells (B-C), n=28 cell lines (D), n=5 cell lines (E), and n=10 tumors (G). p-values are the result of Wilcoxon Rank Sum Test (E-F) or two-tailed T-test (G). Error bars: +/− 1.5x interquartile range (E-F) or +/− SEM (G).
Figure 6.
Figure 6.. Emergence of SCLC-I populations coincides with cisplatin resistance in SCLC-A predominant xenograft models.
t-SNE feature plots from scRNAseq for ASCL1 comparing parental, treatment-naive and cisplatin-resistant/relapsed (cis-relapsed) CDX models (MDA-SC53, A; MDA-SC68, B). Highlighted portion of A and B illustrates distinct cluster with prominent ASCL1 loss (C, D). The cells in this region are now triple-negative (SCLC-I), with high EMT score (E, F). Violin plots comparing ASCL1 expression between MDA-SC68 treatment-naïve and cisplatin-relapsed xenograft tumors in all cells (G) and only ASCL1-positive cells (H). Sample sizes: n=2000 cells per arm. (A-H). p-values are the result of two-tailed T-test (G-H).
Figure 7:
Figure 7:. Emerging SCLC-I populations support tumor-wide resistance via transcriptional plasticity.
tSNE projection of all cells from MDA-SC68 CDXs with treatment history (A) or Leiden clustering assignment (B) denoted. Expression of ASCL1 (C) and ZEB2 (D) in these cells. Note the upper right, composed largely of cisplatin-relapsed cells, demonstrates lower ASCL1 expression, while the island clusters are essentially ASCL1-null. RNA velocity vector streams and PAGA maps for cells from cisplatin-naïve (E-F) and cisplatin-relapsed (G-H) CDX tumors. Cell plasticity, as measured by cell transport potential, for cells from cisplatin-naïve (I) and cisplatin-relapsed (J) tumors highlighting areas of greatest plasticity in island cluster within relapsed tumor. Comparison of transport potential between cisplatin-naïve and –relapsed cells (K) demonstrating higher overall plasticity in cisplatin-relapsed cells. Sample sizes: n=2000 cells per arm.

Comment in

References

    1. Allison Stewart C, Tong P, Cardnell RJ, Sen T, Li L, Gay CM, Masrorpour F, Fan Y, Bara RO, Feng Y, et al. (2017). Dynamic variations in epithelial-to-mesenchymal transition (EMT), ATM, and SLFN11 govern response to PARP inhibitors and cisplatin in small cell lung cancer. Oncotarget 8, 28575–28587. - PMC - PubMed
    1. Antonia SJ, Lopez-Martin JA, Bendell J, Ott PA, Taylor M, Eder JP, Jager D, Pietanza MC, Le DT, de Braud F, et al. (2016). Nivolumab alone and nivolumab plus ipilimumab in recurrent small-cell lung cancer (CheckMate 032): a multicentre, open-label, phase 1/2 trial. Lancet Oncol 17, 883–895. - PubMed
    1. Ayers M, Lunceford J, Nebozhyn M, Murphy E, Loboda A, Kaufman DR, Albright A, Cheng JD, Kang SP, Shankaran V, et al. (2017). IFN-gamma-related mRNA profile predicts clinical response to PD-1 blockade. J Clin Invest 127, 2930–2940. - PMC - PubMed
    1. Baine MK, Hsieh MS, Lai WV, Egger JV, Jungbluth A, Daneshbod Y, Beras A, Spencer R, Lopardo J, Bodd F, et al. (2020). Small Cell Lung Carcinoma Subtypes Defined by ASCL1, NEUROD1, POU2F3 and YAP1: Comprehensive Immunohistochemical and Histopathologic Characterization. J Thorac Oncol - PMC - PubMed
    1. Bonnafous CP, Valentine; Trichard Sylvia; Perrot Ivan; Cornen Stéphanie ; Morel Ariane; Breso Violette; Morel Yannis; Rossi Benjamin; Paturel Carine; Gauthier Laurent; Blery Mathieu (2013). Abstract 5037: Targeting MICA with therapeutic antibodies for the treatment of cancer. Journal for ImmunoTherapy of Cancer 1, P41.

Publication types