. 2021 Apr;19(2):208-222.
doi: 10.1016/j.gpb.2020.11.002. Epub 2021 Jan 19.

Single-cell Immune Landscape of Human Recurrent Miscarriage

Affiliations

Single-cell Immune Landscape of Human Recurrent Miscarriage

Feiyang Wang et al. Genomics Proteomics Bioinformatics. 2021 Apr.

Abstract

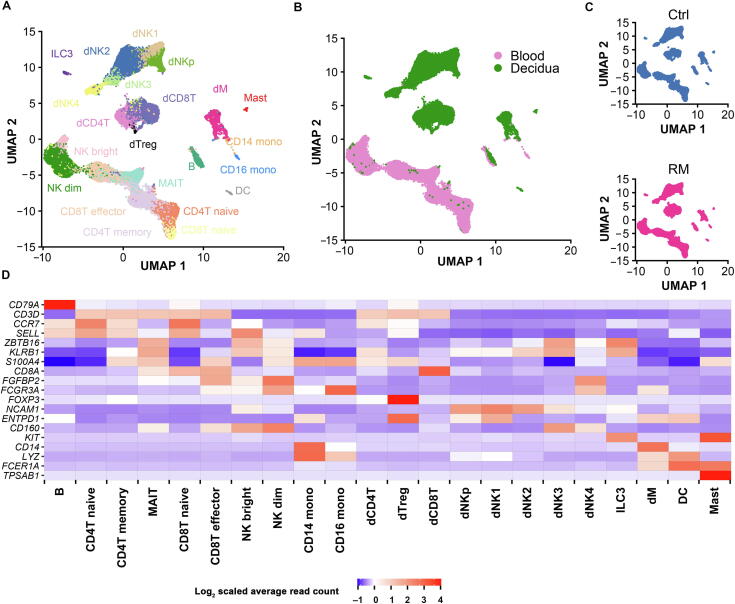
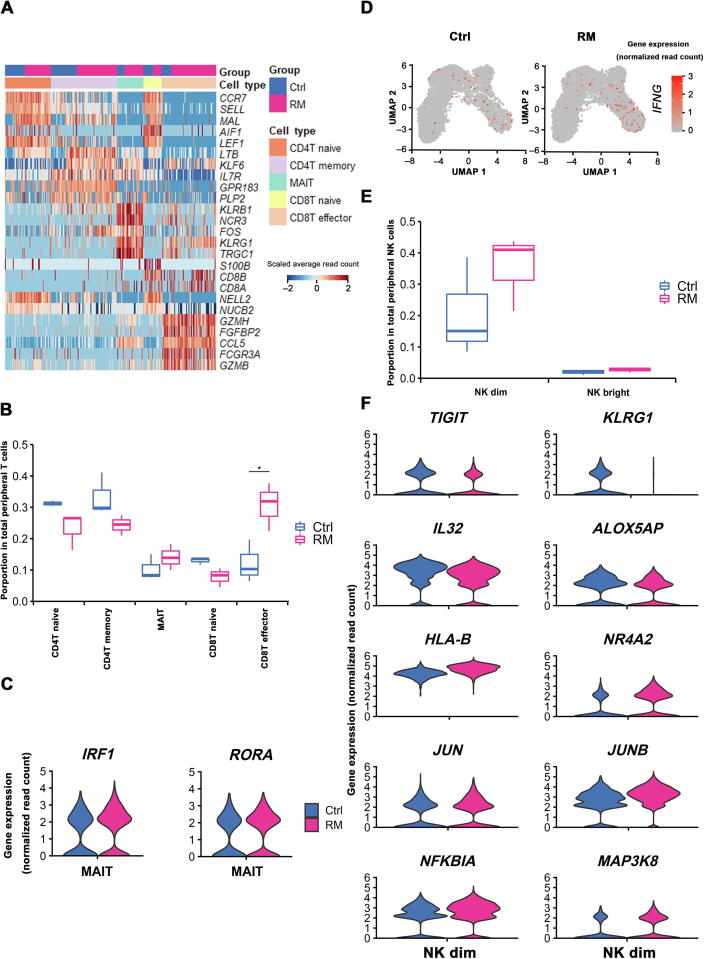
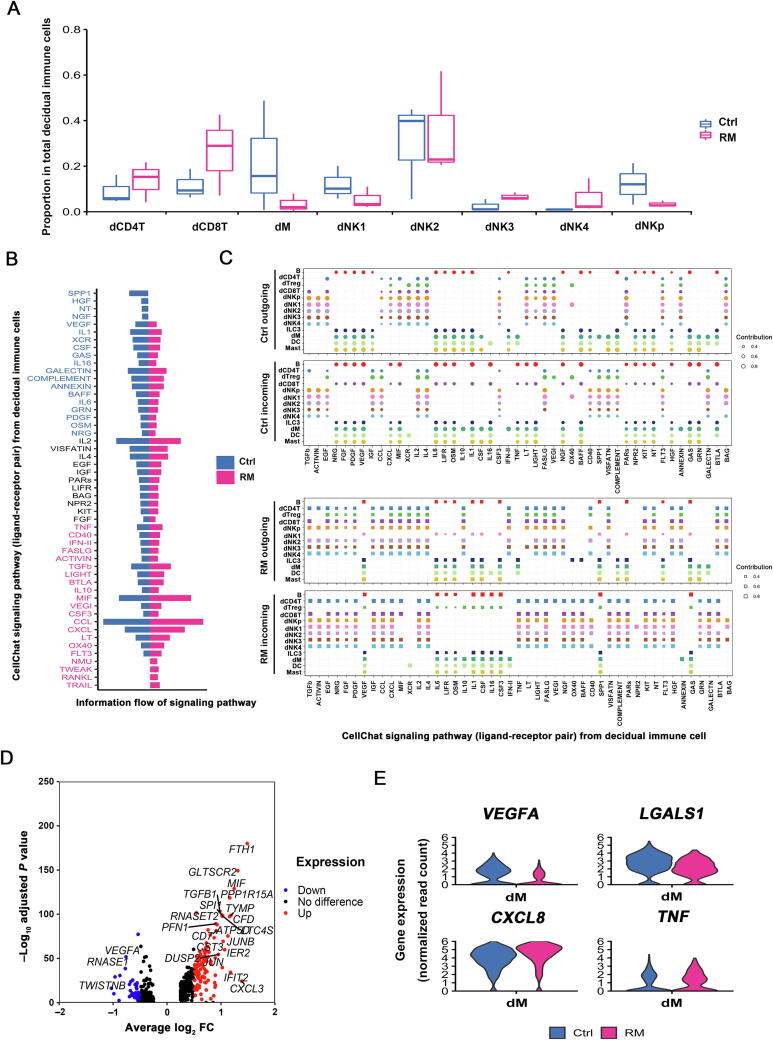
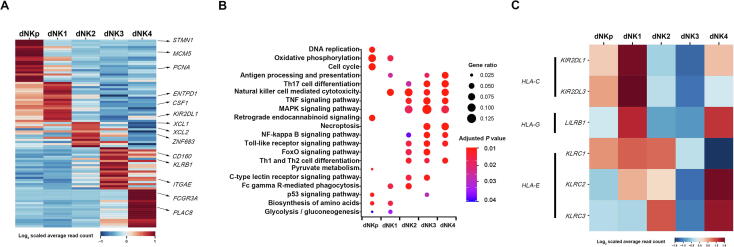
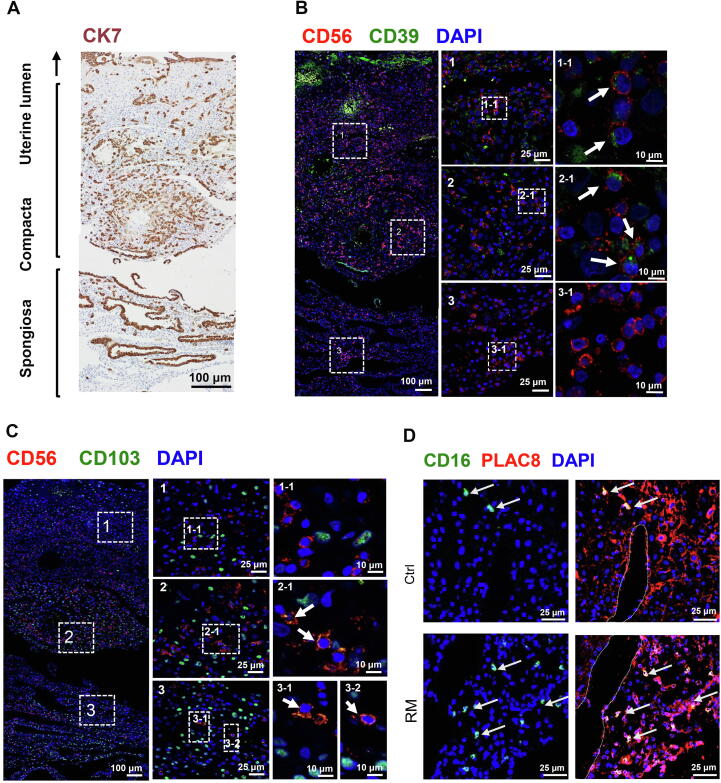
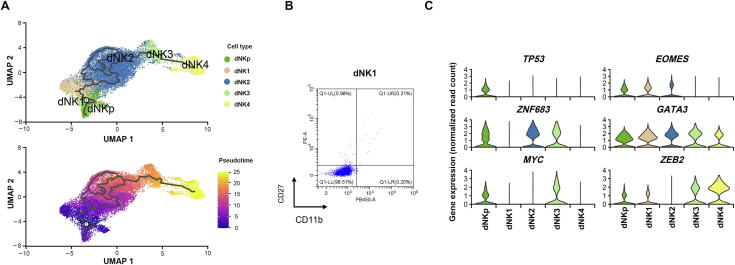
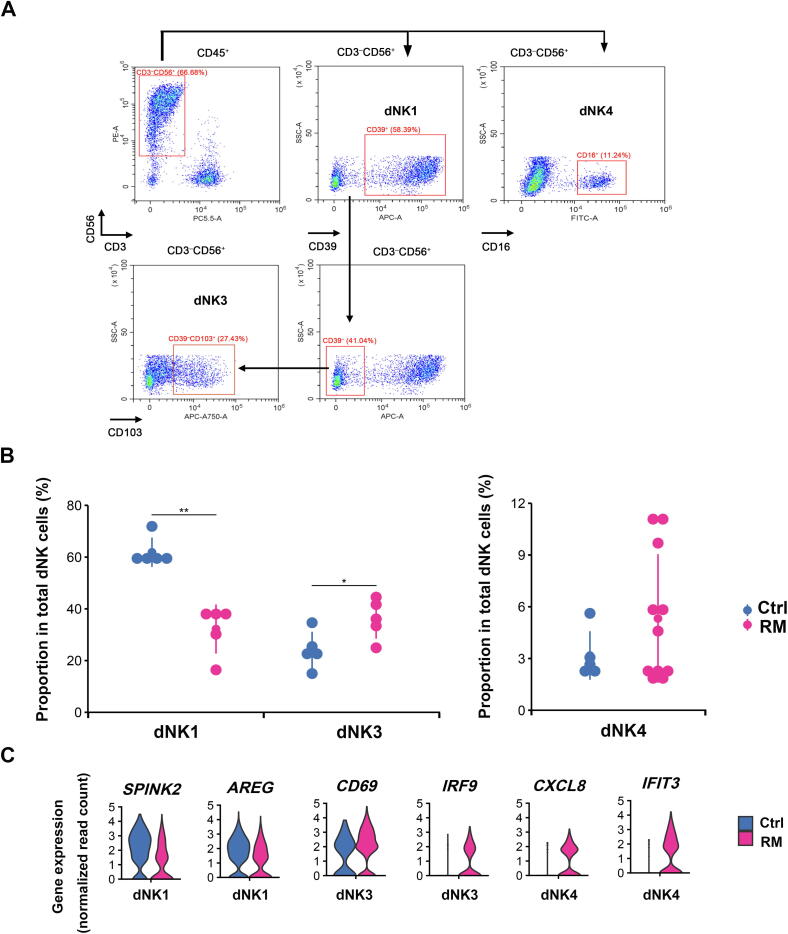
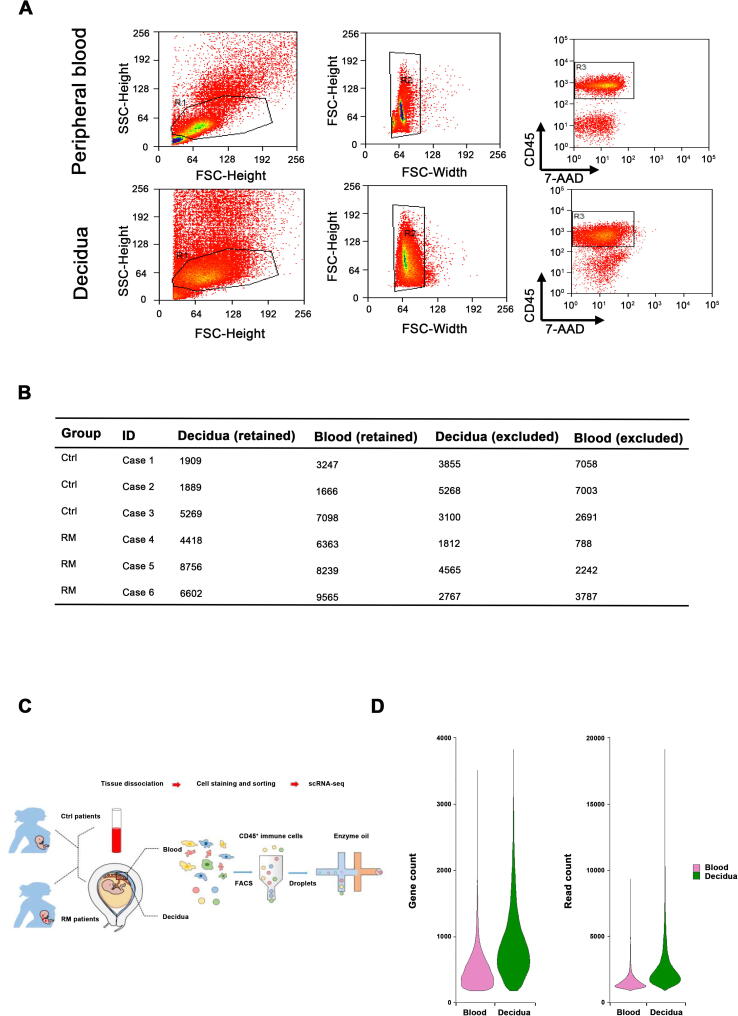
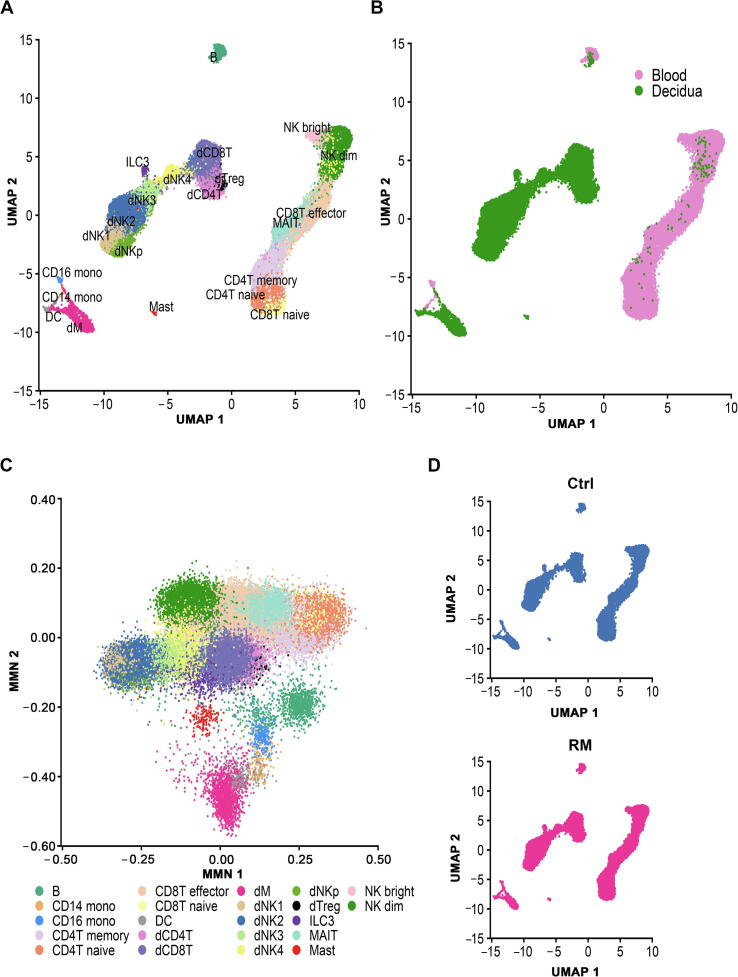
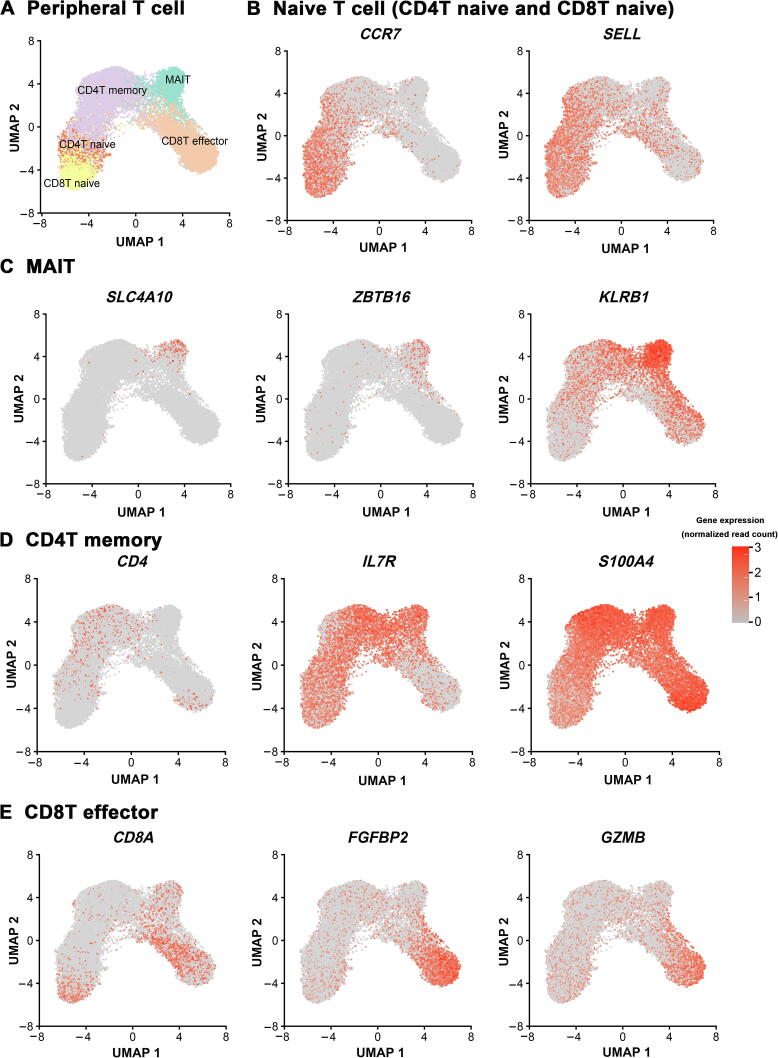
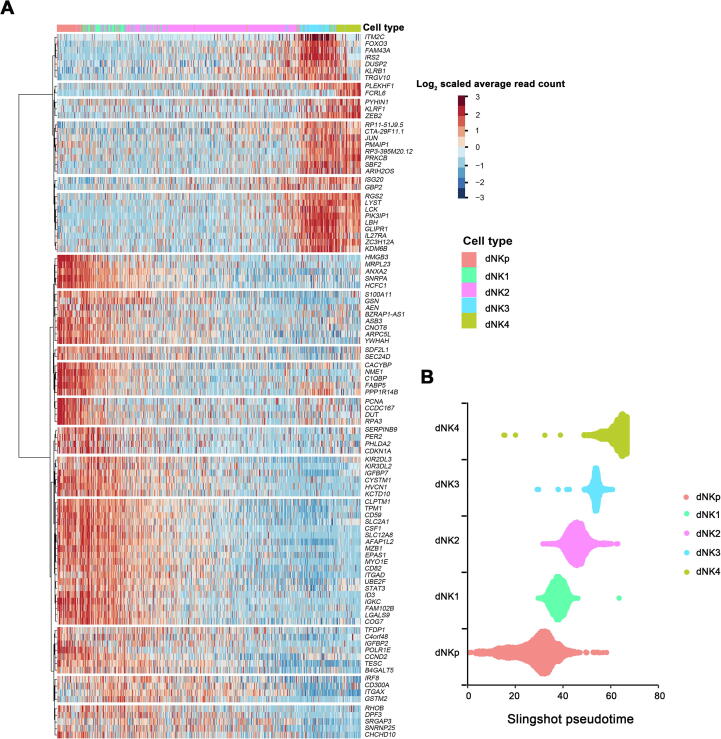
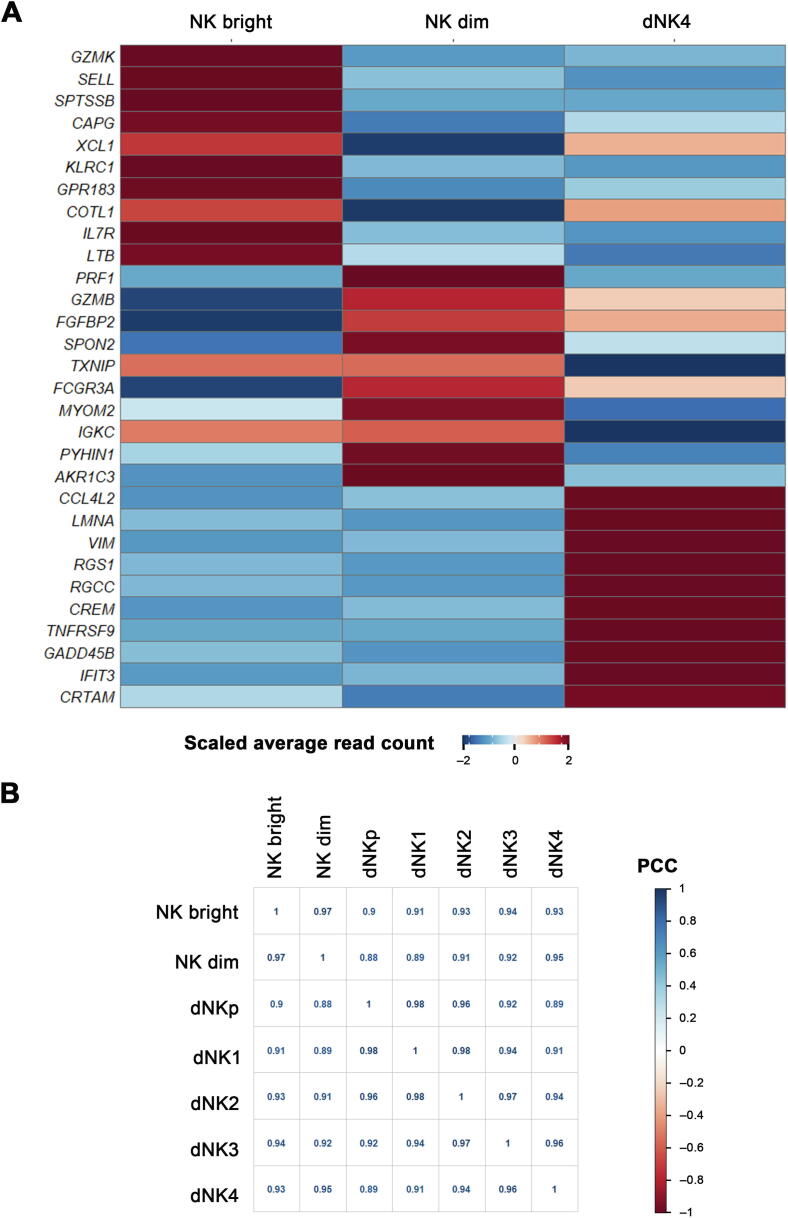
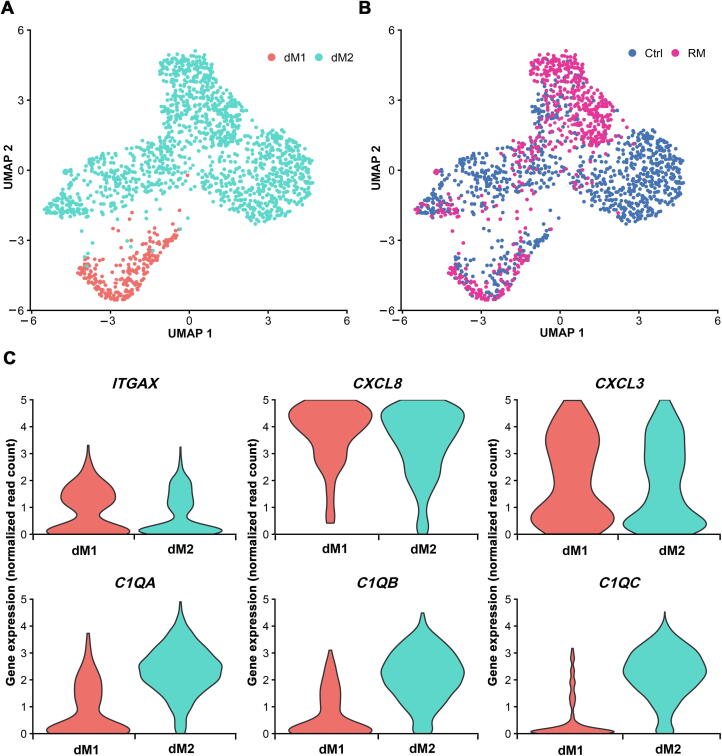
Successful pregnancy in placental mammals substantially depends on the establishment of maternal immune tolerance to the semi-allogenic fetus. Disorders in this process are tightly associated with adverse pregnancy outcomes including recurrent miscarriage (RM). However, an in-depth understanding of the systematic and decidual immune environment in RM remains largely lacking. In this study, we utilized single-cell RNA-sequencing (scRNA-seq) to comparably analyze the cellular and molecular signatures of decidual and peripheral leukocytes in normal and unexplained RM pregnancies at the early stage of gestation. Integrative analysis identifies 22 distinct cell clusters in total, and a dramatic difference in leukocyte subsets and molecular properties in RM cases is revealed. Specifically, the cytotoxic properties of CD8+ effector T cells, nature killer (NK), and mucosal-associated invariant T (MAIT) cells in peripheral blood indicates apparently enhanced pro-inflammatory status, and the population proportions and ligand-receptor interactions of the decidual leukocyte subsets demonstrate preferential immune activation in RM patients. The molecular features, spatial distribution, and the developmental trajectories of five decidual NK (dNK) subsets have been elaborately illustrated. In RM patients, a dNK subset that supports embryonic growth is diminished in proportion, while the ratio of another dNK subset with cytotoxic and immune-active signature is significantly increased. Notably, a unique pro-inflammatory CD56+CD16+ dNK subset substantially accumulates in RM decidua. These findings reveal a comprehensive cellular and molecular atlas of decidual and peripheral leukocytes in human early pregnancy and provide an in-depth insight into the immune pathogenesis for early pregnancy loss.

Keywords: Decidual and peripheral leukocytes; Developmental trajectory; Early pregnancy; Recurrent miscarriage; Single-cell RNA-sequencing.


Figures

Figure 1
Figure 1
Landscape of immune cells from peripheral blood and decidual tissues at early pregnancy A. UMAP plot of scRNA-seq data to show the 22 leukocyte clusters in peripheral blood and decidual tissues at early pregnancy from both Ctrl and RM patients. B. UMAP plot showing cell populations from peripheral blood and decidual tissue from both Ctrl and RM patients. C. UMAP visualization of cell clustering in Ctrl (top) and RM (bottom) pregnancies. D. Cell type annotation of the 22 leukocyte clusters based on the expression of their canonical marker genes. Ctrl, normal; RM, recurrent miscarriage; B, peripheral B cell; CD4T naive, peripheral CD4+ naive T cell; CD8T naive, peripheral CD8+ naive T cell; MAIT, peripheral mucosal-associated invariant T cell; CD4T memory, peripheral CD4+ memory T cell; CD8T effector, CD8+ T effector cell; NK dim, peripheral CD56dimCD16+ NK cell; NK bright, peripheral CD56bright CD16 NK cell; CD14 mono, peripheral CD14+ monocyte; CD16 mono, peripheral CD16+ monocyte; DC, dendritic cell; dNK, decidual natural killer cell; dCD4, decidual CD4+ T cell; dCD8, decidual CD8+ T cell; dTreg, decidual regulatory T cell; dM, decidual macrophage; ILC3, group 3 innate lymphoid cell.
Figure 2
Figure 2
Characteristics of the peripheral blood leukocyte clusters indicate the maternal immune inflammatory status in RM patients A. Heatmap of the top 5 genes expressed in peripheral blood T cell subsets. Subject group and cell type information is indicated above the plot. B. Box plots depicting proportion of various peripheral T cell subtypes in Ctrl and RM patients. C. Violin plots showing the differential expression (absolute log2 FC > 0.5 and Bonferroni-adjusted P < 0.05) of typical marker genes of MAIT subset in Ctrl and RM patients using the method of non-parametric two-sided Wilcoxon rank sum test in Seurat. D. UMAP visualization of the log-transformed, normalized IFNG expression in CD8T effector subset in Ctrl (left) and RM (right) patients. High expression is shown in red, and low expression in gray. E. Box plots displaying proportion of peripheral NK cell subsets in Ctrl and RM patients. F. Violin plots showing the differential expression (absolute log2 FC > 0.5 and Bonferroni-adjusted P < 0.05) of anti-inflammation genes including TIGIT, KLRG1, IL32, and ALOX5AP, and pro-inflammation genes including HLA-B, NR4A2, JUN, JUNB, NFKBIA, and MAP3K8 in peripheral NK dim subset from Ctrl and RM patients, using method of the non-parametric two-sided Wilcoxon rank sum test in Seurat. FC, fold change.
Figure 3
Figure 3
Characteristics of decidual leukocyte subpopulations demonstrate an immune activation status at the maternal-fetal interface of RM pregnancy A. Box plots displaying proportion of decidual immune cell subsets in Ctrl and RM patients. B. Differences in overall information flow of the significant signaling pathways between Ctrl and RM decidua. All significant signaling pathways collected by CellChat were ranked based on their differences in overall information flow within the inferred networks between Ctrl and RM. Signaling pathways colored in blue are more enriched in Ctrl, pathways colored in black are equally enriched in Ctrl and RM, and pathways colored in red are more enriched in RM. C. Dot plots showing the alteration in outgoing (ligand) or incoming (receptor) signaling pathways in decidual leukocyte subsets from Ctrl (top) and RM (bottom) patients. The dot size is proportional to the contribution score, which is calculated from pattern recognition analysis. Higher contribution score suggests that the signaling pathway is more enriched in the corresponding cell subset. D. Volcano plot showing the differentially expressed genes (absolute log2 FC > 0.5 and Bonferroni-adjusted P < 0.05) in decidual macrophages between Ctrl and RM patients, using the method of non-parametric two-sided Wilcoxon rank sum test in Seurat. E. Violin plots illustrating the differential expression of inflammation-associated genes in decidual macrophages in Ctrl and RM patients.
Figure 4
Figure 4
Molecular annotation of human dNK subtypes A. Heatmap showing the relative expression of the top marker genes defining the 5 dNK subsets. The top 20 genes for each subset are defined using the method of non-parametric two-sided Wilcoxon rank sum test in Seurat, and typical marker genes for each subset are indicated om the right. B. KEGG enrichment analysis using differential genes (log2 FC > 0.5 and Bonferroni-adjusted P < 0.05) from the five dNK subsets to illustrate the functional signature of these cells. The differential expression analyses is performed using the method of non-parametric two-sided Wilcoxon rank sum test in Seurat. C. Heatmap showing the expression of genes encoding receptors for HLA antigens in dNK subsets. HLA, human leukocyte antigen.
Figure 5
Figure 5
Spatial distribution of dNK subsets at the feto-maternal interface at early pregnancy A. A representative immunohistochemistry image for CK7 (brown), labeling trophoblasts and uterine gland epithelium in a paraffin section of the feto-maternal interface at gestational week 7. Spongiosa, decidual spongiosa; Compacta, decidual compacta. B. Representative immunofluorescent images of sections adjacent to the section in panel A, showing the distribution of dNK1 cells (CD56+CD39+; white arrows) at the feto-maternal interface. C. Representative immunofluorescent images of sections adjacent to the section in panel A, showing the distribution of dNK3 cells (CD56+CD103+; white arrows) at the feto-maternal interface. In both panels, boxed areas from different regions of the feto-maternal interface on the left (scale bar, 100 μm) are zoomed in and shown in the middle (scale bar, 25 μm), and boxed areas in the middle are further zoomed in and shown on the right (scale bar, 10 μm). D. Representative immunofluorescent images showing the distribution of dNK4 cells (CD16+ PLAC8+; white arrows) in decidual compacta from Ctrl (top) and RM (bottom) pregnancies. Dotted lines indicate the position of uterine blood vessels. Scale bar, 25 μm.
Figure 6
Figure 6
Developmental trajectories of human dNK subtypes A. Monocle3 analysis displaying the developmental trajectories of dNK subsets (top), and an additional representation of trajectory over calculated pseudotime (bottom). B. Flow cytometry analysis demonstrating the low expression of CD27 and CD11b in dNK1 cells. C. Violin plots illustrating the expression of classical transcription factor genes in the 5 dNK subsets.
Figure 7
Figure 7
Alterations of dNK subsets in the decidua of RM pregnancy A. Representative flow cytometry plots showing the strategy to sort dNK cells in human decidual tissues at gestational weeks 6–8, including dNK1 (CD3CD56+CD39+), dNK3 (CD3CD56+CD39CD103+), and dNK4 (CD3CD56+CD16+). B. Quantification of cell population of dNK1 and dNK3 (left panel), as well as dNK4 (right panel) subsets in decidual tissues from Ctrl (n = 5) and RM patients (n = 5 in left panel, and n = 11 in right panel). Significant difference between the two groups is analyzed using unpaired t-test. *, P < 0.05; **, P < 0.01. C. Violin plots illustrating the expression of typical differential genes (absolute log2 FC > 0.5 and Bonferroni-adjusted P < 0.05) in dNK1, dNK3, and dNK4 cells from Ctrl and RM patients. The differential expression analysis is performed using the method of non-parametric two-sided Wilcoxon rank sum test in Seurat.
Supplementary Figure S1
Gating strategy and quality control for droplet scRNA-seq A. Flow sorting of living leukocytes from peripheral blood and decidual tissue using CD45 antibody and 7-AAD. B. Total number of cells that met the requirement of quality control and subjected to droplet scRNA-seq. C. Workflow depicting the dissociation and sorting of CD45+ leukocytes from peripheral blood and decidual to generate scRNA transcriptome profile. D. Quality evaluation on sequencing data including the total number of reads per cell (left panel) and total number of genes per cell (right panel) and in peripheral blood and decidua. 7-AAD, 7-aminoactinomycin D.
Supplementary Figure S2
MNN algorithm to confirm the elimination of batch effect of the data A. Data from the 6 samples were integrated with MNN and visualized using UMAP. B. Distribution of leukocytes from peripheral blood and decidual tissues after MNN integration. C. MNN 1 and MNN 2 of the integral analysis of decidual and peripheral blood leukocytes from the droplet-based datasets. D. Distribution of leukocytes from Ctrl and RM patients after MNN integration. MNN, mutual nearest neighbor.
Supplementary Figure S3
Identification of peripheral blood T cell subpopulations by specific marker genes A. UMAP visualization of peripheral blood T cells. Feature plot of naive T cells (B), MAIT cells (C), CD4T memory cells (D), and CD8T effector cells (E) with expression of their specific marker genes.
Supplementary Figure S4
Analysis of dNK pseudotime trajectory using Slingshot A. Heatmap showing the top 100 variable genes in dNK cells that change in a continuous manner over pseudotime. The top 100 variable were selected by using GAM to calculate a dynamic changes over pseudotime in dNK development. B. Slingshot map pseudotime analysis of dNK cells. GAM, general additive model.
Supplementary Figure S5
Global gene expression analysis in CD16+ NK cells including dNK4 and peripheral NK bright and NK dim subsets A. Heatmap showing the top 10 differentially expressed genes (log2FC > 0.5 and Bonferroni-adjusted P < 0.05) in three NK subsets by using the method of non-parametric two-sided Wilcoxon rank sum test in Seurat. B. Correlation analyses between dNK4 and other NK subsets based on the overall transcription level. PCC, Pearson correlation coefficient.
Supplementary Figure S6
Identification of decidual macrophage subpopulations A. UMAP showing two subpopulations of decidual macrophage. B. UMAP showing decidual macrophage subpopulations in Ctrl (blue) and RM (red) patients. C. Characterization of the two decidual macrophage subpopulations using marker genes.

References

    1. Erlebacher A. Immunology of the maternal-fetal interface. Annu Rev Immunol. 2013;31:387–411. - PubMed
    1. Ander S.E., Diamond M.S., Coyne C.B. Immune responses at the maternal-fetal interface. Sci Immunol. 2019;4:eaat6114. - PMC - PubMed
    1. Fisher S.J. Why is placentation abnormal in preeclampsia? Am J Obstet Gynecol. 2015;213:S115–S122. - PMC - PubMed
    1. Kheshtchin N., Gharagozloo M., Andalib A., Ghahiri A., Maracy M.R., Rezaei A. The expression of Th1- and Th2-related chemokine receptors in women with recurrent miscarriage: the impact of lymphocyte immunotherapy. Am J Reprod Immunol. 2010;64:104–112. - PubMed
    1. Deshmukh H., Way S.S. Immunological basis for recurrent fetal loss and pregnancy complications. Annu Rev Pathol. 2019;14:185–210. - PMC - PubMed

Publication types