. 2021 Feb:269:120669.
doi: 10.1016/j.biomaterials.2021.120669. Epub 2021 Jan 8.

Valve endothelial-interstitial interactions drive emergent complex calcific lesion formation in vitro

Affiliations

Valve endothelial-interstitial interactions drive emergent complex calcific lesion formation in vitro

Terence W Gee et al. Biomaterials. 2021 Feb.

Abstract

Objective: Calcific aortic valve disease (CAVD) is an actively regulated degenerative disease process. Clinical lesions exhibit marked 3D complexity not represented in current in vitro systems. We here present a unique mechanically stressed 3D culture system that recapitulates valve interstitial cell (VIC) induced matrix calcification through myofibroblastic activation and osteoblastic differentiation. We test the hypothesis that valve endothelial (VEC) - interstitial collaborative interactions modulate the risk and complexity of calcific pathogenesis within mechanically stressed and pro-inflammatory environments.

Approach and results: Porcine aortic valve endothelial and interstitial cells (VEC and VIC) were seeded in a mechanically constrained collagen hydrogels alone or in co-culture configurations. Raised 3D VIC-filled lesions formed within 7 days when cultured in osteogenic media (OGM), and surprisingly exacerbated by endothelial coculture. We identified a spatially coordinated pro-endochondral vs. pro-osteogenic signaling program within the lesion. VEC underwent Endothelial-to-Mesenchymal Transformation (EndMT) and populated the lesion center. The spatial complexity of molecular and cellular signatures of this 3D in vitro CAVD system were consistent with human diseased aortic valve histology. SNAI1 was highly expressed in the VEC and subendothelial direct VIC corroborates with human CAVD lesions. Spatial distribution of Sox9 vs. Runx2 expression within the developed lesions (Sox9 peri-lesion vs. Runx2 predominantly within lesions) mirrored their expression in heavily calcified human aortic valves. Finally, we demonstrate the applicability of this platform for screening potential pharmacologic therapies through blocking the canonical NFκB pathway via BAY 11-7082.

Conclusions: Our results establish that VEC actively induce VIC pathological remodeling and calcification via EndMT and paracrine signaling. This mechanically constrained culture platform enables the interrogation of accelerated cell-mediated matrix remodeling behavior underpinned by this cellular feedback circuit. The high fidelity of this complex 3D model system to human CAVD mechanisms supports its use to test mechanisms of intercellular communication in valves and their pharmacological control.

Keywords: Coculture; EndMT; Endochondral ossification; Endothelial dysfunction; Mechanobiology; Osteogenic.


Conflict of interest statement

Disclosures

The authors declare no conflicts of interest.

Figures
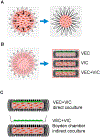
Fig. 1.
Fig. 1.
Schematics of in vitro cell culture model and experimental setups. A. Encapsulated cell remodeling of collagen hydrogels over time contained by custom PDMS culture wells with inset stainless steel compression spring. Black arrows (left schematic) indicates inward gel compaction from the circumferential restraint by the stainless steel compression spring. B. Primary cell culture configurations for valve endothelial cells (VEC), valve interstitial cells (VIC) and coculture of VEC + VIC. Red dotted line indicates orthogonal cross-sectional perspective, with arrangement of VEC and VIC populations. C. Direct vs indirect coculture configurations, utilizing 0.4 μm PET membrane Boyden culture chamber.
Fig. 2.
Fig. 2.
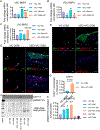
Macroscopic remodeling and calcium deposition is exacerbated by VEC + VIC coculture under osteogenic differentiation conditions. A. Macroscopic images and calculated Surface Area reduction due to compaction at Day 7 culture (n = 12 per condition). Arrows indicate macroscopic cellularized lesions. Scale bar is 1 mm. Error bars indicates 95% confidence interval. Asterisks indicate statistical significance between groups (****: p < 0.0001). B. Alizarin Red S staining of calcium deposition within whole hydrogels, and Alizarin Red S concentration following dye extraction from stained hydrogels, normalized to mean of VIC GM condition (n = 6 per condition). Arrows indicate ARS-positive calcium deposits. Scale bar is 1 mm. Asterisks indicate statistical significance from GM equivalent (*: p < 0.05, ***: p < 0.005). Pound sign indicates statistical significance from VIC OGM (#: p < 0.005). C. Macroscopic images and calculated Surface Area reduction due to compaction at Day 14 culture (n = 12 per condition). Scale bar is 1 mm. Error bars indicates 95% confidence interval. Asterisks indicate statistical significance between groups (****: p < 0.0001). Scale bar is 1 mm. D. Representative Western blot chemiluminescence staining of αSMA, phosphorylated SMAD2 (pSMAD2), and stain-free total protein detection of VEC and VIC cultures at Day 1, 7, and 14 of culture. E. Western blot semi-quantitative analysis of αSMA expression level at Day 14 of culture (n = 4). Asterisks indicate statistical significance between groups (***: p < 0.0005). F. Western blot semi-quantitative analysis of pSMAD2 expression level at Day 1, 7, and 14 of culture (n = 4). Statistical analysis conducted with 2-way ANOVA with Tukey’s multiple comparisons test. Asterisks indicate statistical significance from between expression at different days within same population set (e.g. Day 1 vs. 7 vs. 14 for VEC only group) (**: p < 0.05, ****: p < 0.0001). Pound symbol indicates statistical significance of population set from all other sub-groups (e.g. VEC vs. VIC and VEC vs. VEC + VIC) (#: p < 0.0001).
Fig. 3.
Fig. 3.
Coculture (both direct and indirect) promotes calcific deposition/proendochondral programming. A, Alizarin Red S staining comparison and quantification of VIC vs VEC + VIC direct/indirect coculture (n = 6 per condition). Scale bar is 1 mm. B. ACTA2 (aSMA) gene expression for VIC indirect coculture experiments (n = 4). Error bars indicate SEM. Asterisks indicate statistical significance from VIC GM(***: p < 0.0005), pound sign indicates statistical significance from VIC OGM (#: p < 0.0001). C. SOX9 gene expression for VIC indirect coculture experiments (n = 4). Error bars represent SEM. Asterisks indicate statistical significance between groups (*: p < 0.05, **: p < 0.005). D. RUNX2 gene expression for VIC indirect coculture experiments (n = 4). Error bars represent SEM. Asterisks indicate statistical significance between groups (*: p < 0.05, ****: p < 0.0001). E. Immunofluorescence staining of SOX9 and RUNX2, costained with DAPI and Griffonia simplicifolia isolectin B4 (IB-4), from paraffin-sectioned hydrogels. Scale bar is 100um. Yellow arrows indicate Sox9 expressing mesenchymal cells in the peri-lesional zone. F. RUNX2 gene expression for VEC indirect coculture experiments (n = 4). Error bars represent SEM. Asterisks indicate statistical significance from all other groups (**: p < 0.005). G. MMP2 gene expression for VEC indirect coculture experiments (n = 4). Error bars represent SEM. Asterisks indicate statistical significance from VEC GM (*: p < 0.05). Pound sign indicates statistical significance from VEC OGM (#: p < 0.0001). H. MMP9 gene expression for VEC indirect coculture experiments (n = 4). Error bars represent SEM. Asterisks indicate statistical significance from all other groups (**: p < 0.005).
Fig. 4.
Fig. 4.
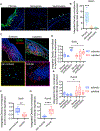
Coculture remodeling exhibit involvement of BMP/endochondral activity. A. mRNA gene expression for BMP2 from VEC indirect cocultures (n = 4). Asterisks indicate statistical significance from VEC GM (**: p < 0.005, ****: p < 0.0001). Pound symbol indicates statistical significance from VEC GM + VIC (#: p < 0.0005). B. mRNA gene expression for BMP4 from VEC indirect cocultures (n = 4). Asterisks indicate statistical significance from VEC GM (*: p < 0.05). C. mRNA gene expression for BMP2 from VIC indirect cocultures (n = 4). Asterisks indicate statistical significance from VIC GM (***: p < 0.0005, ****: p < 0.0001), pound symbol indicates statistical significance from VIC OGM (#: p < 0.0001). D. Immunofluorescence staining for phosphorylated SMAD1/5 (pSMAD1/5), costained with IB-4 and DAPI. Scale bar is 20um. E. Immunofluorescence staining for Cadherin-11 (CDH11), costained with IB-4 and DAPI. Scale bar is 20um. F. Representative Western blot chemiluminescence staining of Cadherin-11 (CDH11), phosphorylated SMAD1/5 (pSMAD1/5), and stain-free total protein detection. G. Western blot semi-quantitative analysis of CDH11 expression level (n = 4). Asterisks indicate statistical significance between groups (****: p < 0.0001). H. Western blot semi-quantitative analysis of pSMAD1/5 expression level (n = 4). Asterisks indicate statistical significance from VIC GM (*: p < 0.05). Pound symbol indicates statistical significance from VIC OGM (#: p < 0.005).
Fig. 5.
Fig. 5.
VEC display Endothelial-to-Mesenchymal (EndMT) phenotype in their pathogenic recruitment. A. Z-plane maximum projection of whole mount immunofluorescence stainin for CD31 and F-actin. Scale bar is 100 μm. B. Orthogonal cross-section of whole mount 3D reconstructed images for CD31 and F-actin. Arrows indicate CD31 positive cells in mesenchymal space (potential EndMT transmigrated VEC). Scale bar is 20um. C. mRNA gene expression for ACTA2 (aSMA gene) from indirect cocultures. Asterisks indicate statistical significance from VEC GM (****: p < 0.0001). Pound sign indicates statistical significance from VEC OGM (#: p < 0.05). D. mRNA gene expression for SNAI1 from indirect cocultures. Asterisks indicate statistical significance from VEC GM (*: p < 0.05). E. mRNA gene expression for OCT4 from indirect cocultures. Asterisks indicate statistical significance from VEC GM (*: p < 0.05). F. Immunofluorescence staining of paraffin-sectioned hydrogels for SNAI1 protein expression. White arrows indicate cells with high nuclear colocalized SNAI1 expression. Scale bar is 100 μm.
Fig. 6.
Fig. 6.
In vitro model system recapitulates spatial phenotypic features identified in human calcified valve etiology. A. Representative images of SNAI1 immunofluorescence staining of human aortic valve segmented according to trilaminar region. Scale bar is 100 μm. B. Semi-quantiftative analysis of SNAI1 protein expression, normalized to mean spongiosa value (n = 10). Asterisks indicate statistical significance from all groups (***: p < 0.0005). C. Scale bar is 100 μm. D. Semi-quantitative analysis of Sox9 protein expression of sclerotic (n = 8) and calcified (n = 10) valves, segmented according to trilaminar region. Asterisks indicate statistical significance from all groups within set (e.g. fibrosa vs. spongiosa vs. ventricularis within sclerotic valves) (*: p < 0.05, ***: p < 0.0005). Pound sign indicates statistical significance for same group across sets (e.g. fibrosa expression for sclerotic vs. calcified valves). E. Semi-quantitative analysis of Runx2 protein expression of sclerotic (n = 8) and calcified (n = 10) valves, segmented according to trilaminar region. Asterisks indicate statistical significance for same group across sets (e.g. fibrosa expression for sclerotic vs. calcified valves) (*: p < 0.05). F. Semi-quantitative analysis of Sox9 protein expression at peri-nodular vs nodular region of calcified valves (n = 8). Asterisks indicate statistical significance between groups (**: p < 0.005). G. Semi-quantitative analysis of Runx2 protein expression at peri-nodular vs nodular region of calcified valves (n = 8). Asterisks indicate statistical significance between groups (****: p < 0.0001). Statistical analysis for B conducted with one-way ANOVA using Kruskal-Wallis test and Dunn’s multiple comparisons test. Statistical analysis for D and E conducted using two-way ANOVA with Sidak’s multiple comparisons test. Statistical analysis for F and G conducted with Mann-Whitney test.
Fig. 7.
Fig. 7.
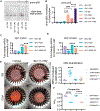
Inhibiting canonical NFkB signaling abrogated coculture calcific deposition. A. Western blot semi-quantitative analysis of phosphorylated NFkB p65 (phos-p65) expression level (n = 4). Asterisks indicate statistical significance between groups (****: p < 0.0001). B. Western blot semi-quantitative analysis of phos-p65 expression level (n = 4). Asterisks indicate statistical significance from VIC GM (***: p < 0.0005, ****: p < 0.00005). Pound symbol indicates statistical significance from VIC OGM (####: p < 0.0001). C. mRNA gene expression for VEC ICAM-1 from indirect cocultures (n = 4). Asterisks indicate statistical significance from VEC GM (***: p < 0.0005). D. mRNA gene expression for VEC VCAM-1 from indirect cocultures (n = 4). Y-axis on a Log10 scale. Asterisks indicate statistical significance from VEC GM (**: p < 0.005, ***: p < 0.0005, ****: p < 0.0001). Pound sign indicates statistical significance from VEC OGM (#: p < 0.05). E. Alizarin Red S staining and quantification of day 7 cocultures in GM or OGM, treated with BAY11-7082 (10 μM) or DMSO vehicle control (n = 12). Asterisks indicate statistical significance from all other groups (****: p < 0.0001). Error bars indicate 95% confidence interval. Scale bar is 1 mm. F. Compaction analysis for corresponding cocultures and treatment conditions in previous Fig. 7E (n = 8). Error bars indicate 95% confidence interval. Asterisks indicate statistical significance between groups (****: p < 0.0001).
Fig. 8.
Fig. 8.
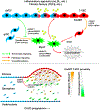
Illustrative schematic summarizing major study findings. Upper panel 2003 indicates VEC-VIC interactions wherein endothelial cells either exhibit homeostatic or 2004 pro pathologic activity in the interstitium. Lower panel indicates the spatial 2005 heterogeniety of chondrotic versus osteogenic lineage cells correlates to the proximity 2006 to EndMT transformed endothelium (T-VEC).

Similar articles

Cited by

References

    1. Blaser MC, Aikawa E, Roles and regulation of extracellular vesides in cardiovascular mineral metabolism, Front Cardiovasc Med 5 (December) (2018), 10.3389/fcvm.2018.00187. - DOI - PMC - PubMed
    1. Weiler M, Hwai Yap C, Balachandran K, Padala M, Yoganathan AP, Regional analysis of dynamic deformation characteristics of native aortic valve leaflets, J. Biomech 44 (8) (2011) 1459–1465, 10.1016/j.jbiomech.2011.03.017. - DOI - PMC - PubMed
    1. Yap CH, Saikrishnan N, Tamilselvan G, Yoganathan AP, Experimental measurement of dynamic fluid shear stress on the aortic surface of the aortic valve leaflet, Biomech. Model. Mechanobiol 11 (1–2) (2012) 171–182, 10.1007/s10237-011-0301-7. - DOI - PMC - PubMed
    1. Otto CM, Kuusisto J, Reichenbach DD, Gown AM, O’Brien KD, Characterization of the early lesion of “degenerative” valvular aortic stenosis. Histological and immunohistochemical studies, Circulation 90 (2) (1994) 844–853,10.1161/01.CIR.90.2.844. - DOI - PubMed
    1. Chen JH, Yip CYY, Sone ED, Simmons CA, Identification and characterization of aortic valve mesenchymal progenitor cells with robust osteogenic calcification potential, Am. J. Pathol 174 (3) (2009) 1109–1119, 10.2353/ajpath.2009.080750. - DOI - PMC - PubMed

Publication types