. 2021 Feb 25;66(5):05LT01.
doi: 10.1088/1361-6560/abdee5.

Imaging the response to deep brain stimulation in rodent using functional ultrasound

Affiliations

Imaging the response to deep brain stimulation in rodent using functional ultrasound

Rohit Nayak et al. Phys Med Biol. .

Abstract

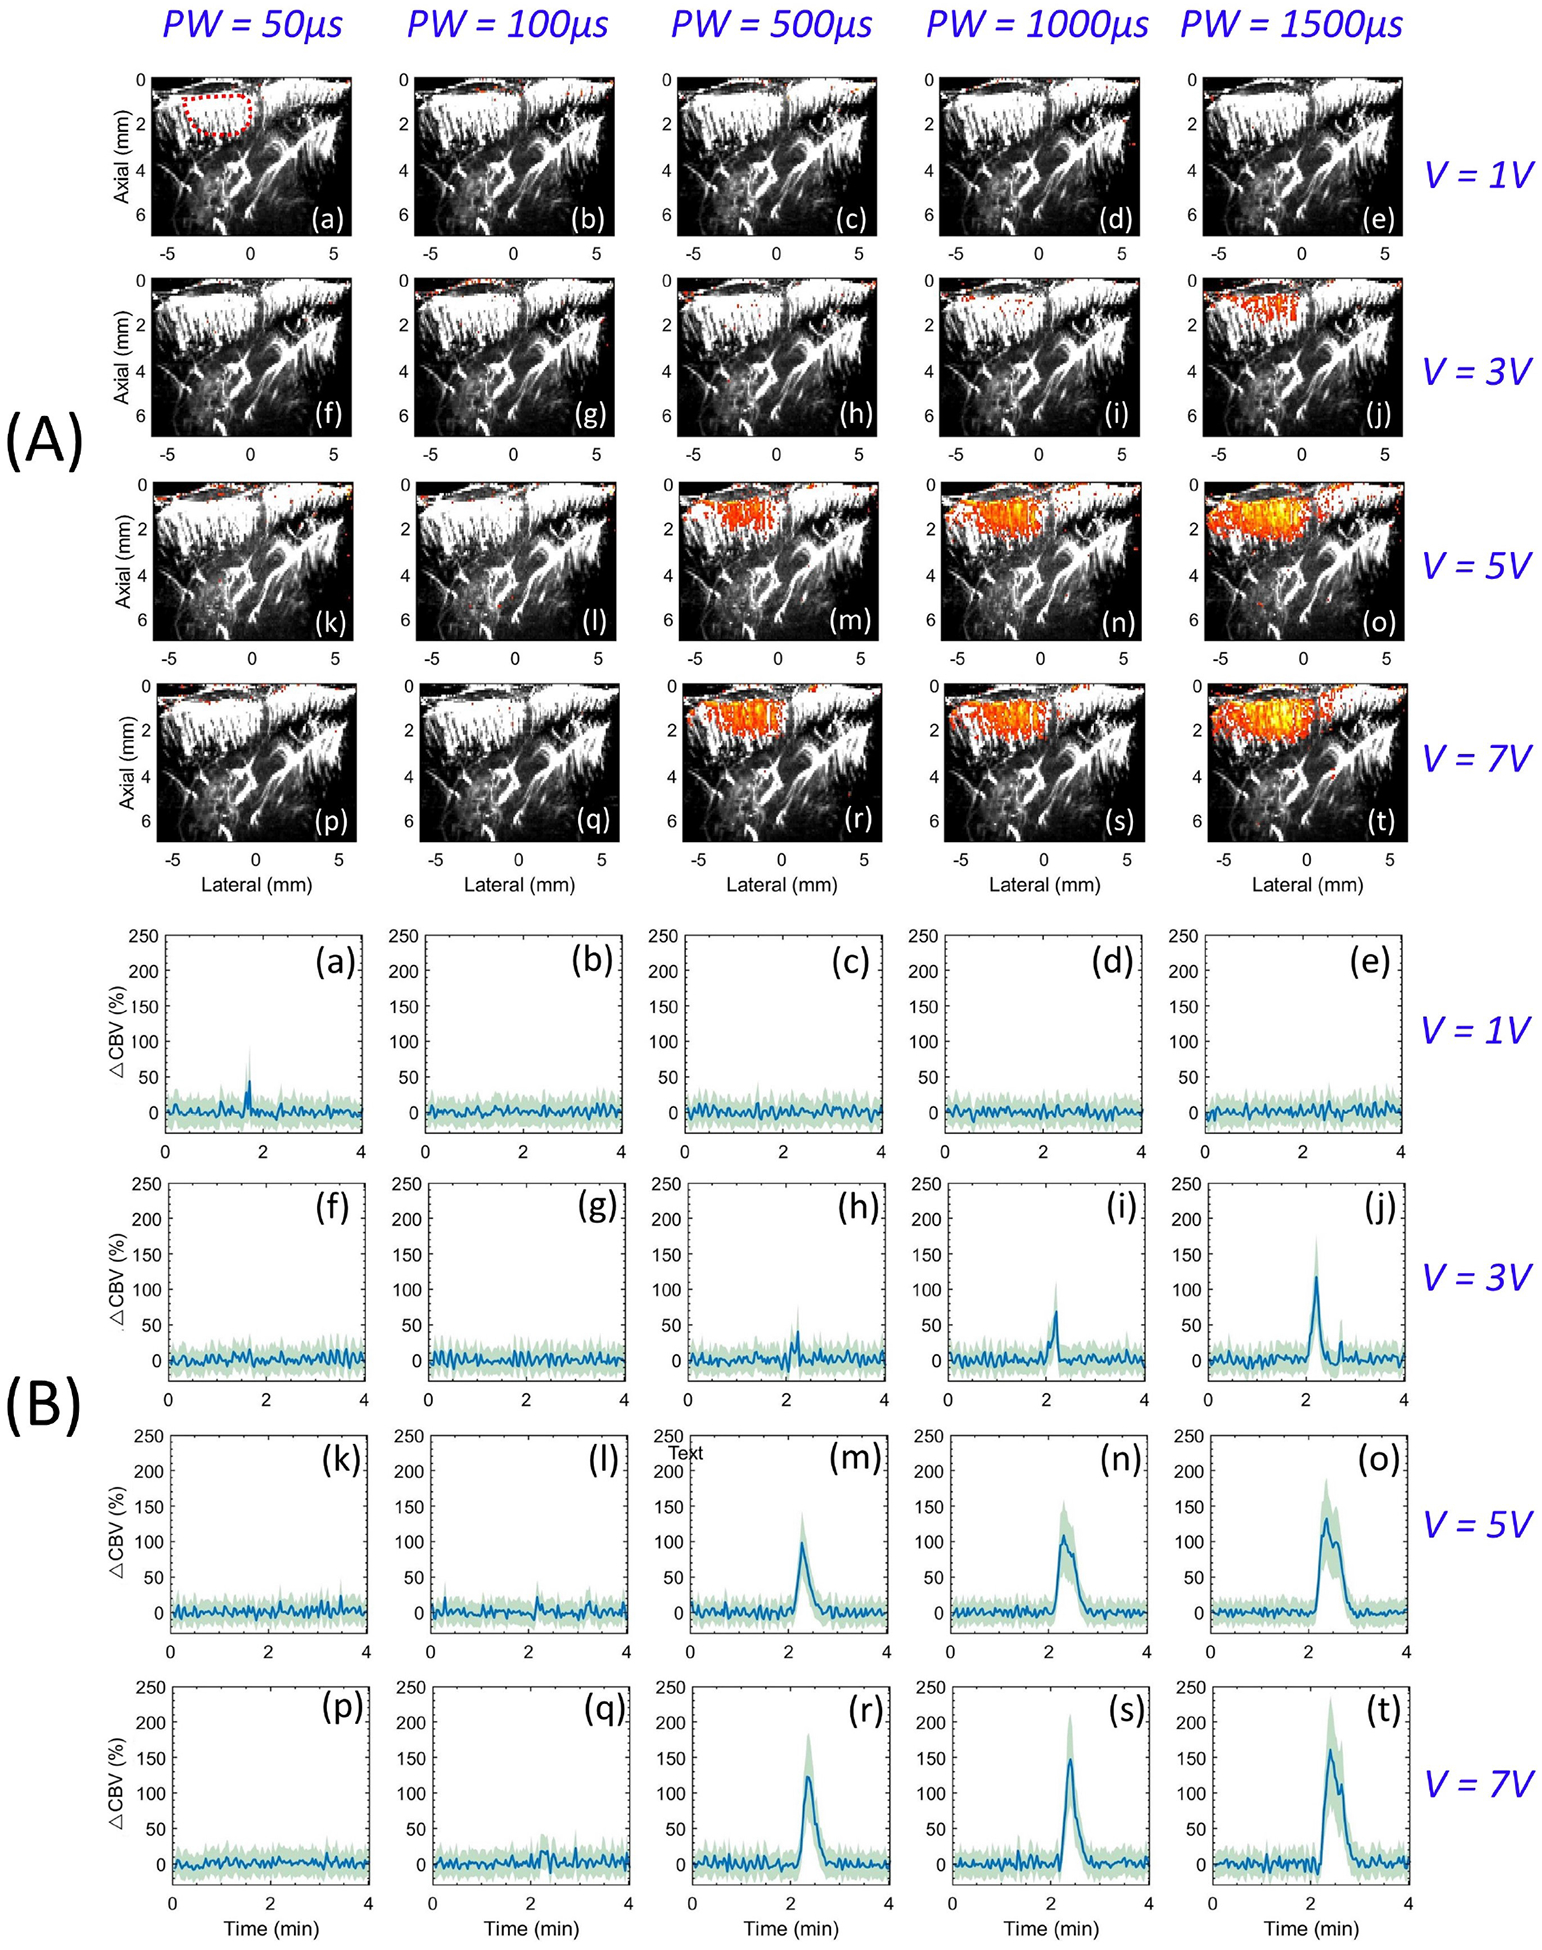
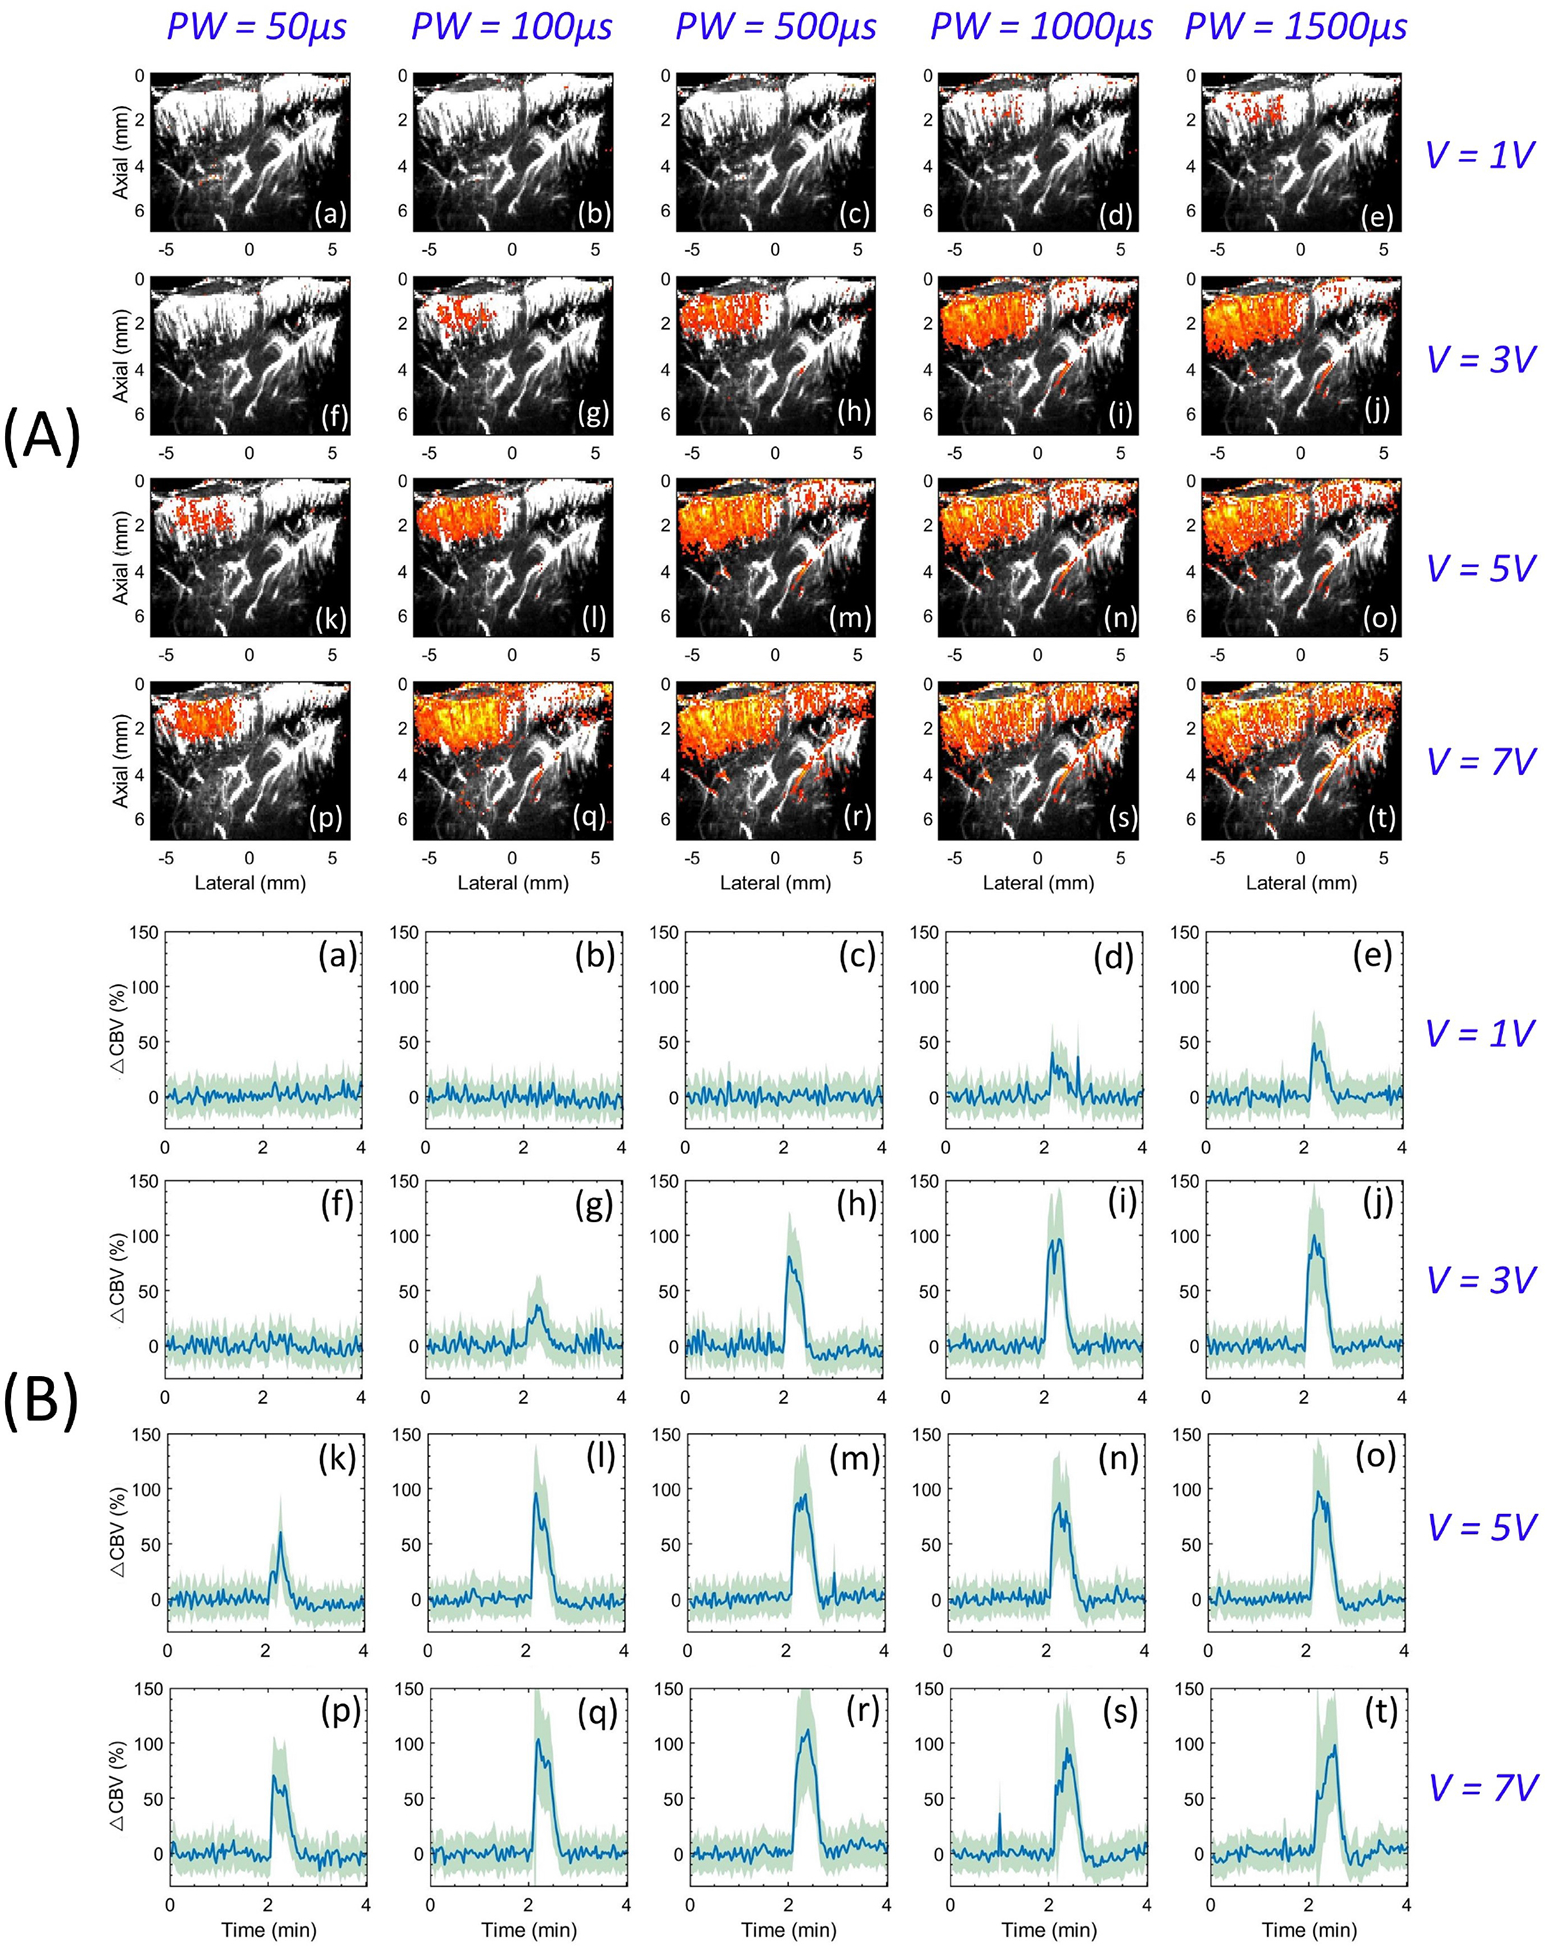
In this study, we explored the feasibility of using functional ultrasound (fUS) imaging to visualize cerebral activation associated with thalamic deep brain stimulation (DBS), in rodents. The ventrolateral (VL) thalamus was stimulated using electrical pulses of low and high frequencies of 10 and 100 Hz, respectively, and multiple voltages (1-7 V) and pulse widths (50-1500 μs). The fUS imaging demonstrated DBS-evoked activation of cerebral cortex based on changes of cerebral blood volume, specifically at the primary motor cortex (PMC). Low frequency stimulation (LFS) demonstrated significantly higher PMC activation compared to higher frequency stimulation (HFS), at intensities (5-7 V). Whereas, at lower intensities (1-3 V), only HFS demonstrated visible PMC activation. Further, LFS-evoked cerebral activation was was primarily located at the PMC. Our data presents the functionality and feasibility of fUS imaging as an investigational tool to identify brain areas associated with DBS. This preliminary study is an important stepping stone towards conducting real-time functional ultrasound imaging of DBS in awake and behaving animal models, which is of significant interest to the community for studying motor-related disorders.


Conflict of interest statement

Disclosure of conflict of interest

The authors have no financial interest to disclose related to the content of this article.

Figures

Figure 1:
Figure 1:
An illustrative depiction of the DBS-fUS experimental setup used in this study. Components (a-e) were created with BioRender.com. The schematic of the saggital cross-section of the rat brain corresponds to ML=1.4 mm [40], reproduced with permission of the copyright holder. The regions of interest PMC and VL are indicated in blue and green, respectively. The red ROI outlines the fUS imaging region considered in this study.
Figure 2:
Figure 2:
(a) A limited craniotomical window for functional imaging of rat brain, with implanted electrode indicated in white. (b) Experimental setup with a high frequency ultrasound transducer positioned over the craniotomical window, aligned with the midline. (d) A representative ultrasound microDopler image of the rat-brain, imaged at ML = 1.4 mm. The vertical and horizontal scales measure 2mm. The position of the inserted electrode is indicated in white. (e) displays an instance of fUS image super-imposed on microDoppler image, corresponding to the electrical stimuli at the ventrolateral thalamus. Temporal profile of primary motor cortex activation regulated with on/off phases of deep brain stimulation is displayed in (f), in response to four repeated instances. The blue and red plots indicates on-off DBS phases (activation function), and the corresponding mean fUS signal in the primary motor cortex, respectively. The black plot corresponds to temporally averaged fUS signal indicated in red. (g,h) depicts the correlation and z-score images, corresponding to (e).
Figure 3:
Figure 3:
(A). Montage of FAM images displaying fUS activation corresponding to low frequency deep brain stimulation at the ventrolateral thalamus. Rows correspond to voltages 1, 3, 5 and 7 volts, whereas columns correspond to pulse width of 50, 100, 500, 1000, 1500 μs. The colorbars are indicated in Figure 2 (d,e). (B). Montage of temporal profile of fUS activation in the primary motor cortex, corresponding to low frequency stimulation at the ventrolateral thalamus. Rows correspond to voltages 1, 3, 5 and 7 volts, whereas columns correspond to pulse width of 50, 100, 500, 1000, 1500 μs.
Figure 4:
Figure 4:
(A). Montage of FAM images displaying fUS activation corresponding to high frequency deep brain stimulation at the ventrolateral. Rows correspond to voltages 1, 3, 5 and 7 volts, whereas columns correspond to pulse width of 50, 100, 500, 1000, 1500 μs. The colorbars are indicated in Figure 2 (d,e). (B). Montage of temporal profile of fUS activation in the primary motor cortex, corresponding to low frequency stimulation at the ventrolateral thalamus. Rows correspond to voltages 1, 3, 5 and 7 volts, whereas columns correspond to pulse width of 50, 100, 500, 1000, 1500 μs.
Figure 5:
Figure 5:
Quantitative plots displaying the variation in the cortical fUS signal with respect to low (left column) and high (right column) frequency deep brain stimulation at the ventrolateral thalamus. Top row quantifies the increase in fUS activation in the primary motor cortex as a function of voltage, pulse width and frequency of electrical stimuli. Bottom row quantifies the increase in area cortical activation area, corresponding to variation in voltage, pulse width and frequency of the electrical stimuli. The low and high frequency stimulation were applied at 10 and 100 Hz, respectively. The area of cortical activation was quantified with a threshold of 30 dB signal drop relative to the peak.

Similar articles

Cited by

References

    1. Grill WM, Snyder AN and Miocinovic S 2004. Neuroreport 15 1137–1140 - PubMed
    1. McIntyre CC, Savasta M, Walter BL and Vitek JL 2004. Journal of clinical neurophysiology 21 40–50 - PubMed
    1. Johnson MD, Miocinovic S, McIntyre CC and Vitek JL 2008. Neurotherapeutics 5 294–308 - PMC - PubMed
    1. Jackson A and Zimmermann JB 2012. Nature Reviews Neurology 8 690. - PubMed
    1. Benabid AL, Chabardes S, Mitrofanis J and Pollak P 2009. The Lancet Neurology 8 67–81 - PubMed

Publication types

LinkOut - more resources