

Everything counts - a method to determine viral suppression among people living with HIV using longitudinal data for the HIV care continuum - results of two large, German, multi-center real-life cohort studies over 20 years (1999-2018)
- PMID: 33482773
- PMCID: PMC7825204
- DOI: 10.1186/s12889-020-10088-7
Everything counts - a method to determine viral suppression among people living with HIV using longitudinal data for the HIV care continuum - results of two large, German, multi-center real-life cohort studies over 20 years (1999-2018)
Abstract
Background: The aim of this study was to develop a standardized method to reconstruct persons' individual viral load (VL) courses to determine viral suppression and duration of viremia for the HIV care continuum in Germany using longitudinal cohort data.
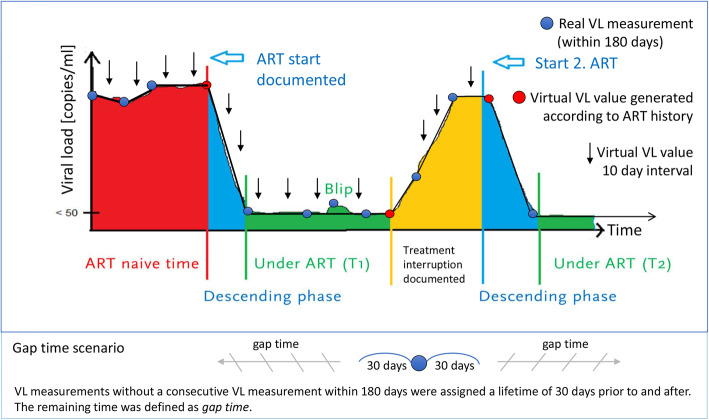
Methods: We analyzed data from two large, multi-center German cohort studies under the direction of the Robert Koch Institute. We included data from 1999 to 2018 of all diagnosed people and of people who initiated antiretroviral treatment (ART). We developed a model generating virtual VL values and an individual VL course corresponding to real VL measurements with a maximum distance of 180 days, considering ART status and VL dynamics. If the distance between VL measurements was > 180 days, the time between was defined as gap time. Additionally, we considered blips, which we defined as a single detectable VL < 1000 copies/ml within 180 days.
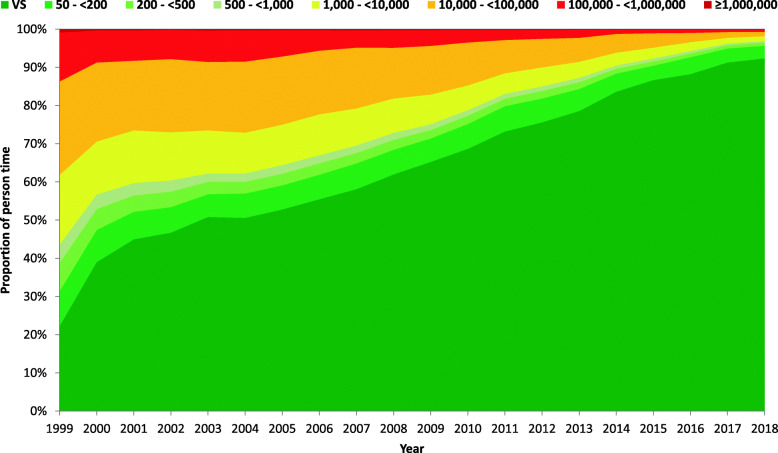
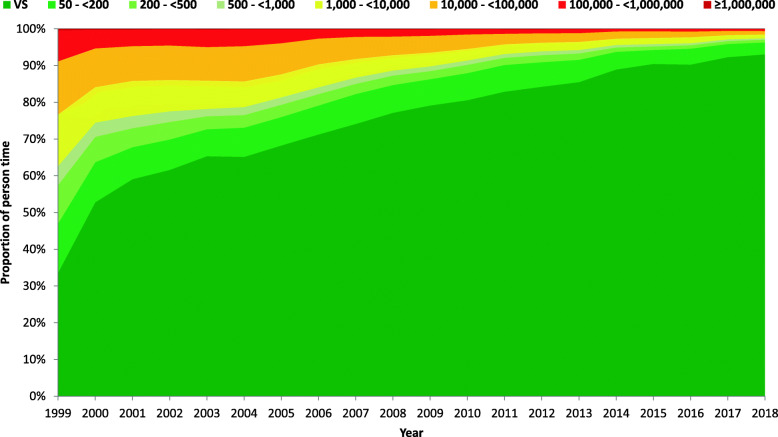
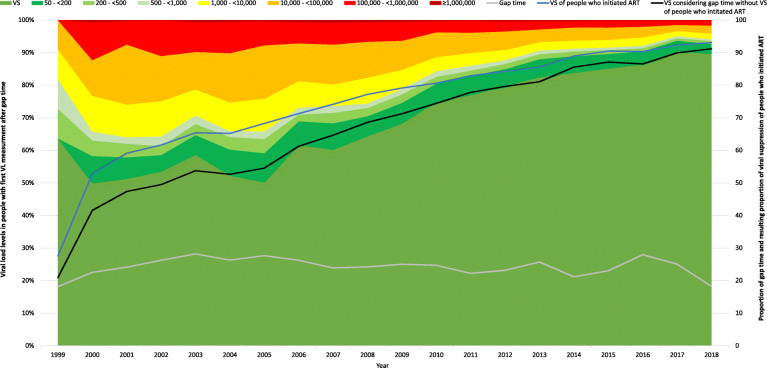
Results: A total of 22,120 people (164,691 person-years, PY) after ART initiation were included in the analyses. The proportion of people with viral suppression (VL < 50 copies/ml) increased from 34% in 1999 to 93% in 2018. The proportion of people with VL < 200 copies/ml increased from 47% in 1999 to 96% in 2018. The proportion of people with viremia > 1000 copies/ml decreased from 37% in 1999 to 3% in 2018. The proportion of people with gap time fluctuated and ranged between 18 and 28%. An analysis of the first VL after gap time showed that 90% showed viral suppression, 5% VL between 50- < 1000 copies/ml and 5% VL > 1000 copies/ml.
Conclusion: We provide a method for estimating viral suppression and duration of viremia using longitudinal VL data. We observed a continuous and remarkable increase of viral suppression. Furthermore, a notable proportion of those with viremia showed low-level viremia and were therefore unlikely to transmit HIV. Individual health risks and HIV drug resistance among those with low-level viremia are problematic, and viral suppression remains the goal. In 2018, 93 and 96% of people after ART initiation showed VL < 50 copies/ml and VL < 200 copies/ml, respectively. Therefore, using the threshold of VL < 200 copies/ml, Germany reached the UNAIDS 95 target of viral suppression since 2017.
Keywords: HIV care continuum; HIV cascade; Treatment success; Viral suppression.
Conflict of interest statement
DS, BGB, VB, OH and MS declare that they have no competing interests. CK is small shareholder in companies manufacturing antiretroviral drugs. TK reports outside of the submitted work to have received honoraria from Eli Lilly, Newsenselab, and Total for providing methodological advice, and from the BMJ for editorial services.
Figures
References
-
- The Joint United Nations Programme on HIV/AIDS (UNAIDS) 90–90-90: An ambitious treatment target to help end the AIDS epidemic. 2014.
-
- The Joint United Nations Programme on HIV/AIDS (UNAIDS) The Gap Report - Beginning of the end of the AIDS epidemic. Geneva: UNAIDS; 2014. p. 2014.
-
- Assembly UG. Political declaration on HIV and AIDS: on the fast-track to accelerate the fight against HIV and to end the AIDS epidemic by 2030. New York: United Nations; 2016.
-
- The Joint United Nations Programme on HIV/AIDS (UNAIDS) Global HIV & AIDS statistics - 2019 fact sheet. 2019.
-
- The Joint United Nations Programme on HIV/AIDS (UNAIDS). ENDING AIDS - Progress towards the 90–90–90 targets. GLOBAL AIDS UPDATE | 2017.
Publication types
MeSH terms
Substances
LinkOut - more resources
Full Text Sources
Other Literature Sources
Medical
Miscellaneous
