

The potential public health and economic value of a hypothetical COVID-19 vaccine in the United States: Use of cost-effectiveness modeling to inform vaccination prioritization
- PMID: 33483216
- PMCID: PMC7832653
- DOI: 10.1016/j.vaccine.2020.12.078
The potential public health and economic value of a hypothetical COVID-19 vaccine in the United States: Use of cost-effectiveness modeling to inform vaccination prioritization
Abstract
Background: Researchers are working at unprecedented speed to develop a SARS-CoV-2 vaccine. We aimed to assess the value of a hypothetical vaccine and its potential public health impact when prioritization is required due to supply constraints.
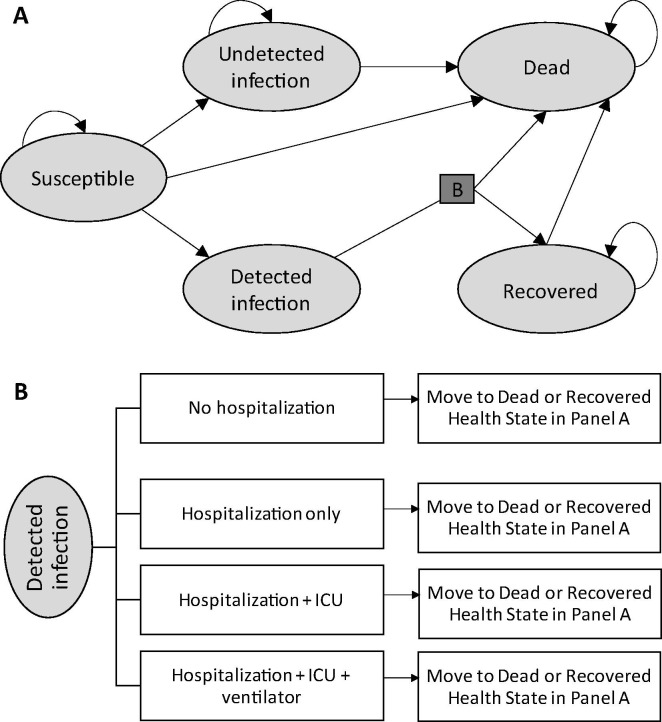
Methods: A Markov cohort model was used to estimate COVID-19 related direct medical costs and deaths in the United States (US), with and without implementation of a 60% efficacious vaccine. To prioritize the vaccine under constrained supply, the population was divided into tiers based on age; risk and age; and occupation and age; and outcomes were compared across one year under various supply assumptions. The incremental cost per quality-adjusted life-year (QALY) gained versus no vaccine was calculated for the entire adult population and for each tier in the three prioritization schemes.
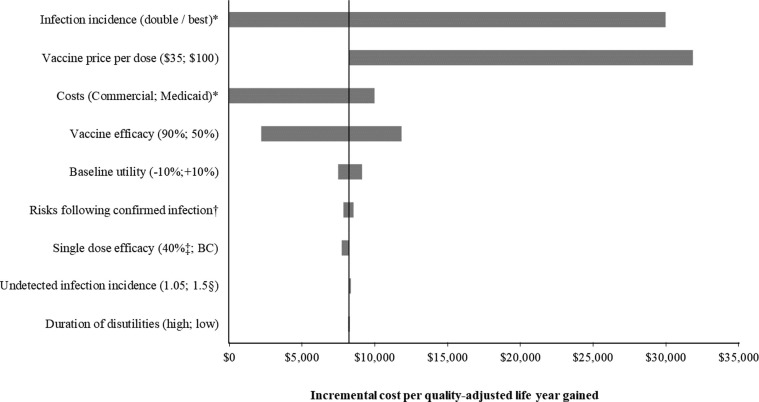
Results: The incremental cost per QALY gained for the US adult population was $8,200 versus no vaccination. For the tiers at highest risk of complications from COVID-19, such as those ages 65 years and older, vaccination was cost-saving compared to no vaccination. The cost per QALY gained increased to over $94,000 for those with a low risk of hospitalization and death following infection. Results were most sensitive to infection incidence, vaccine price, the cost of treating COVID-19, and vaccine efficacy. Under the most optimistic supply scenario, the hypothetical vaccine may prevent 31% of expected deaths. As supply becomes more constrained, only 23% of deaths may be prevented. In lower supply scenarios, prioritization becomes more important to maximize the number of deaths prevented.
Conclusions: A COVID-19 vaccine is predicted to be good value for money (cost per QALY gained <$50,000). The speed at which an effective vaccine can be made available will determine how much morbidity and mortality may be prevented in the US.
Keywords: COVID-19; Coronavirus; Cost-effectiveness analysis; Economic analysis; SARS-CoV-2; Vaccine.
Copyright © 2020. Published by Elsevier Ltd.
Conflict of interest statement
Declaration of Competing Interest MK and DB are shareholders in Quadrant Health Economics Inc. Quadrant Health Economics Inc. was contracted by Moderna, Inc. to conduct this study. MM and MCW are consultants at Quadrant Health Economics Inc.
Figures
References
-
- Johns Hopkins Coronavirus Resource Center. COVID-19 Map. Coronavirus COVID-19 global cases by the center for systems science and engineering; 2020. https://coronavirus.jhu.edu/ [accessed November 30, 2020].
-
- J. Corum, D. Grady, S. Wee, C. Zimmer. The New York Times: coronavirus vaccine tracker. https://www.nytimes.com/interactive/2020/science/coronavirus-vaccine-tra... [accessed August 10, 2020].
-
- Centers for Disease Control and Prevention. Interim updated planning guidance on allocating and targeting pandemic influenza vaccine during an influenza pandemic; 2018. https://www.cdc.gov/flu/pandemic-resources/pdf/2018-Influenza-Guidance.pdf [accessed June 25, 2020].
-
- World Health Organization (WHO). Ethics and COVID-19: resource allocation and priority-setting (WHO/RFH/20.2). https://www.who.int/ethics/publications/ethics-and-covid-19-resource-all... [accessed July 9, 2020].
Publication types
MeSH terms
Substances
LinkOut - more resources
Full Text Sources
Other Literature Sources
Medical
Research Materials
Miscellaneous
