

Developmental PCB Exposure Disrupts Synaptic Transmission and Connectivity in the Rat Auditory Cortex, Independent of Its Effects on Peripheral Hearing Threshold
- PMID: 33483323
- PMCID: PMC7901149
- DOI: 10.1523/ENEURO.0321-20.2021
Developmental PCB Exposure Disrupts Synaptic Transmission and Connectivity in the Rat Auditory Cortex, Independent of Its Effects on Peripheral Hearing Threshold
Abstract
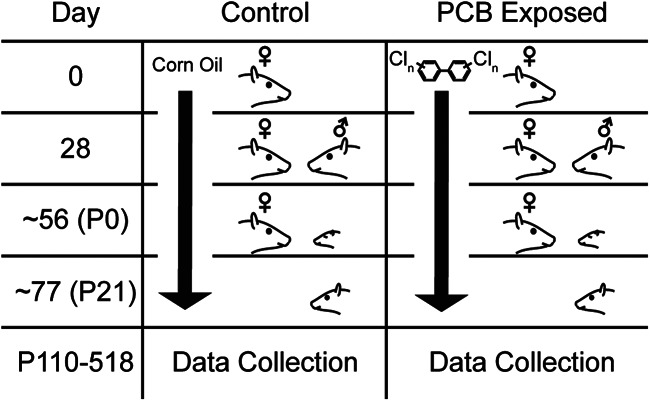
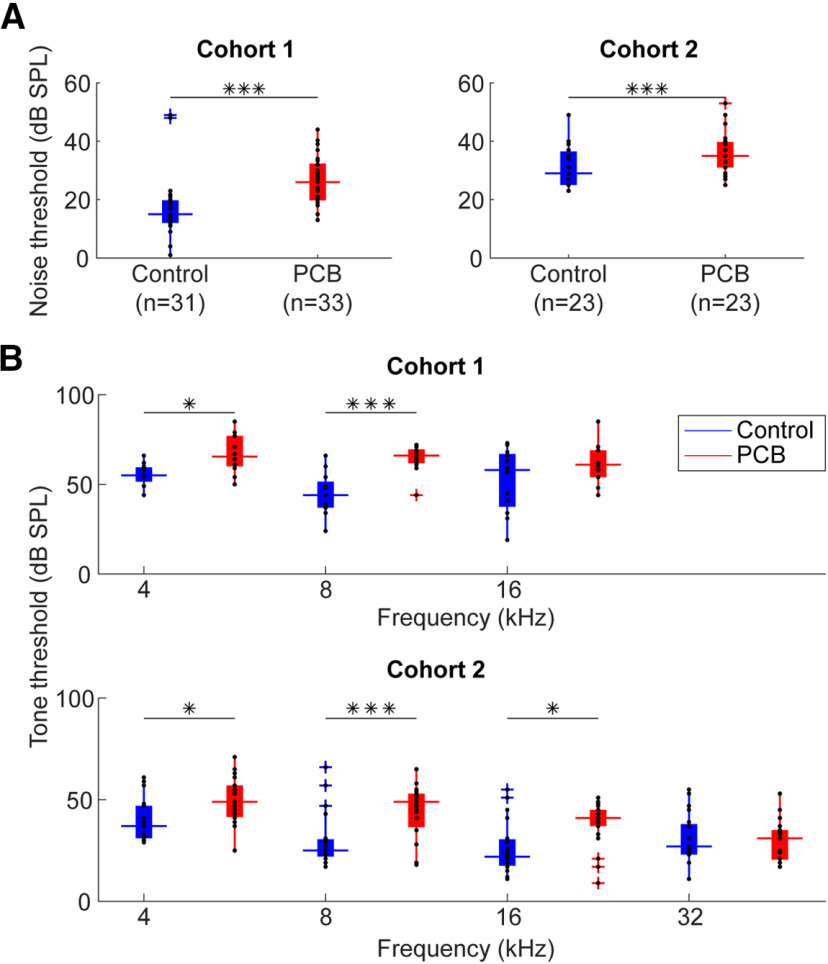
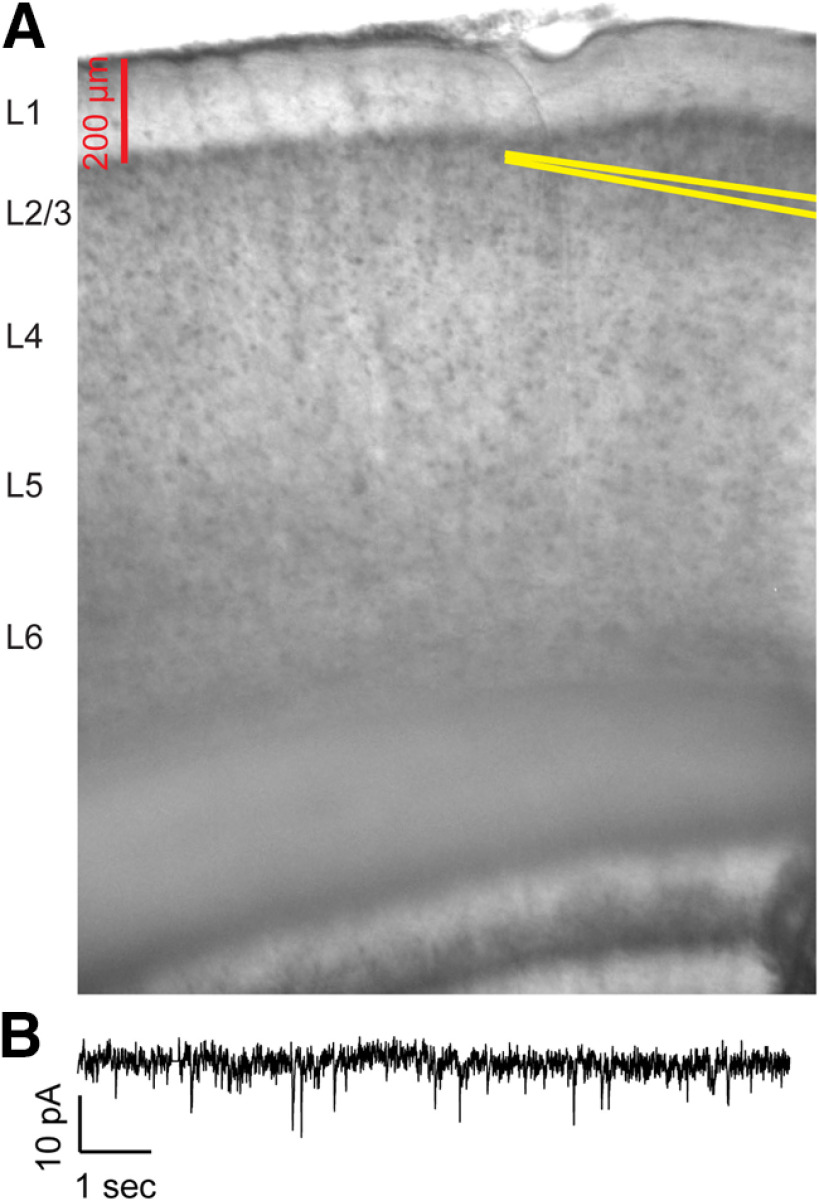
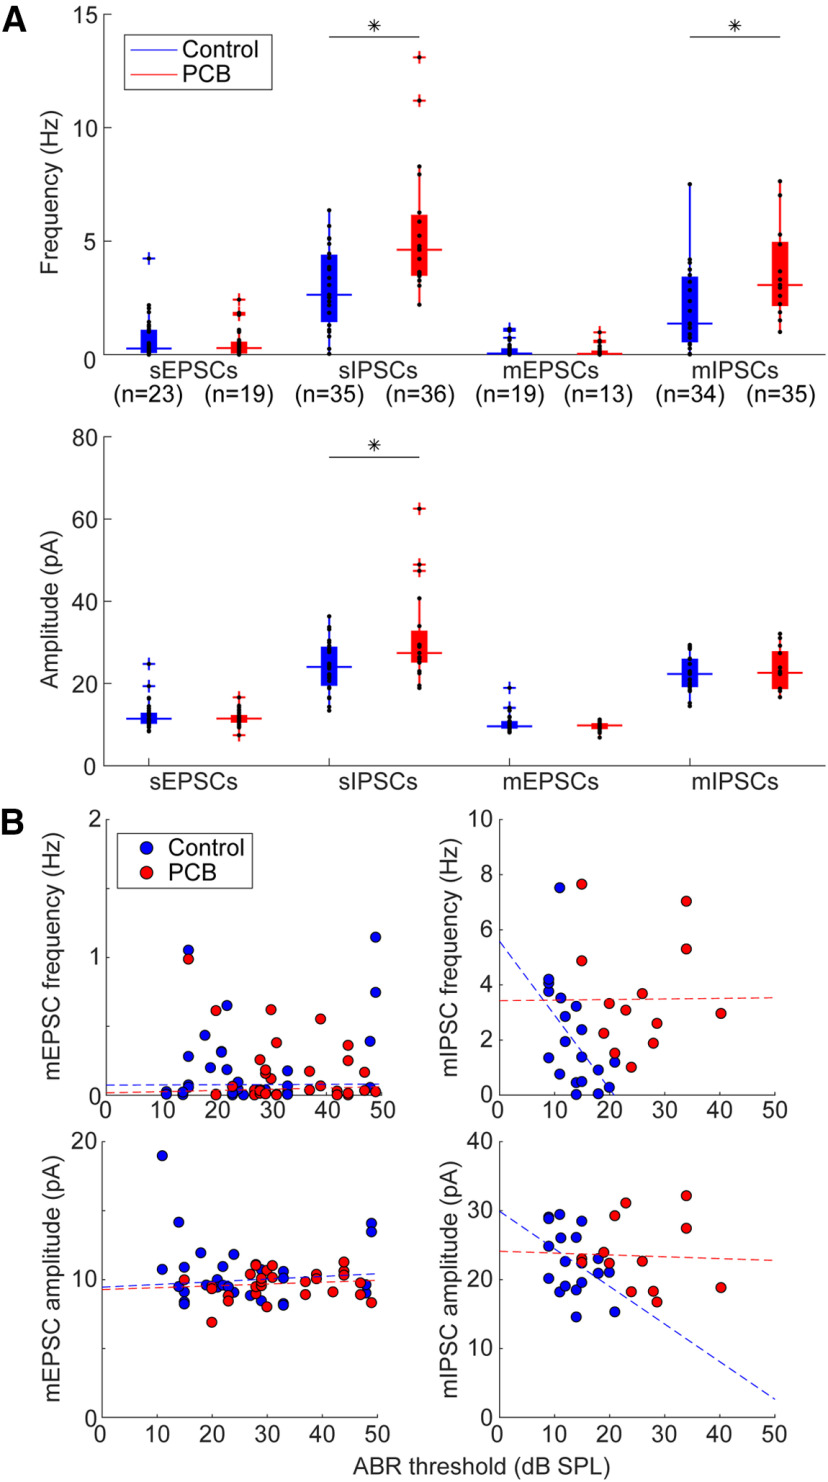
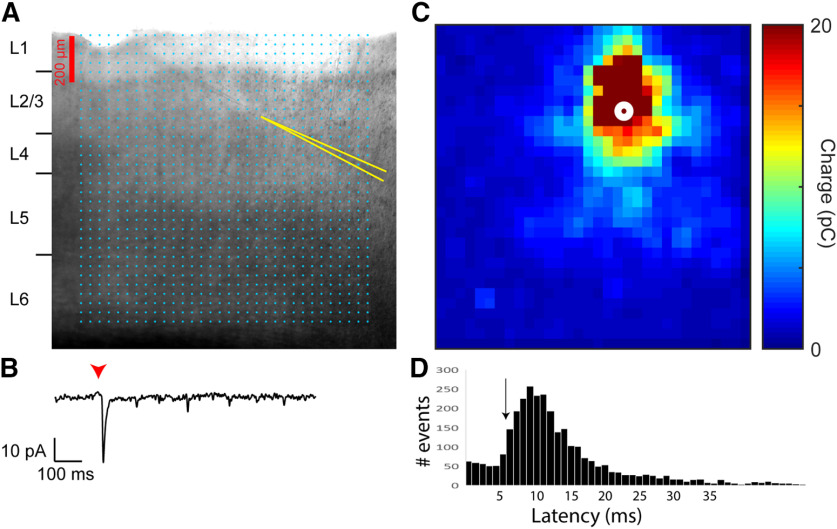
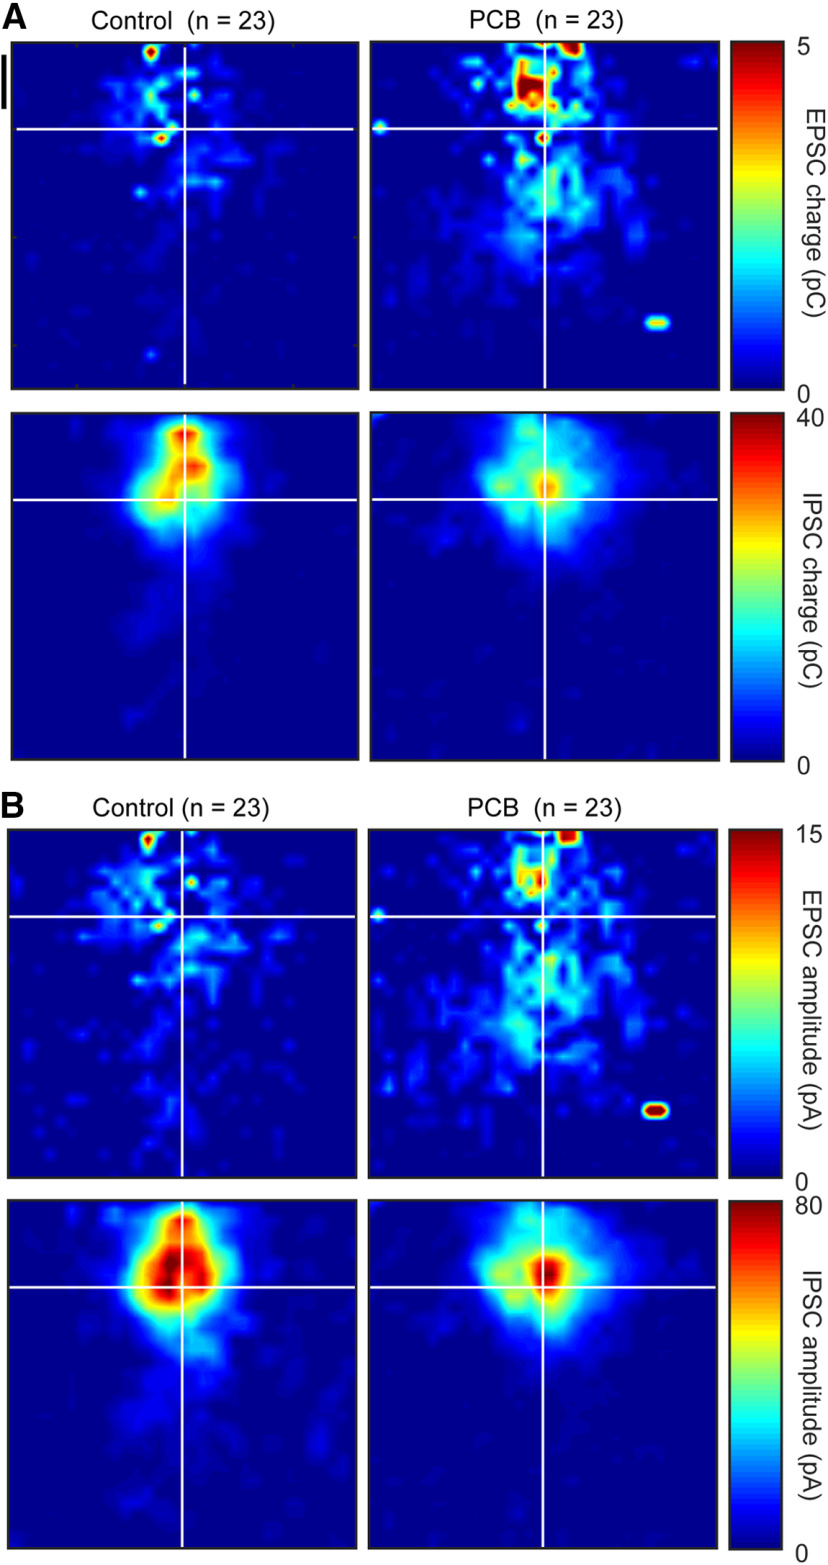
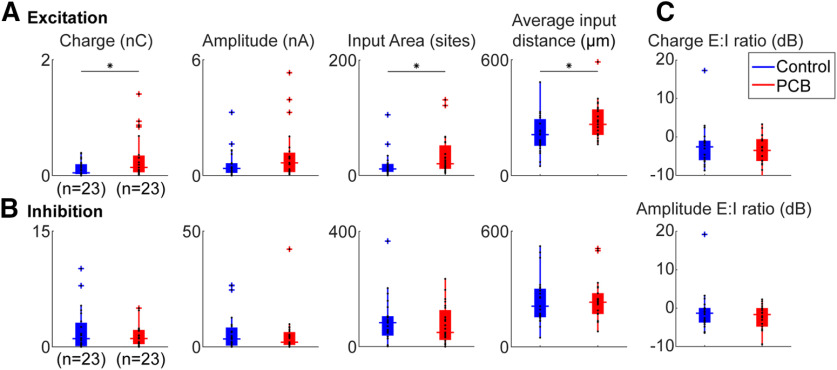
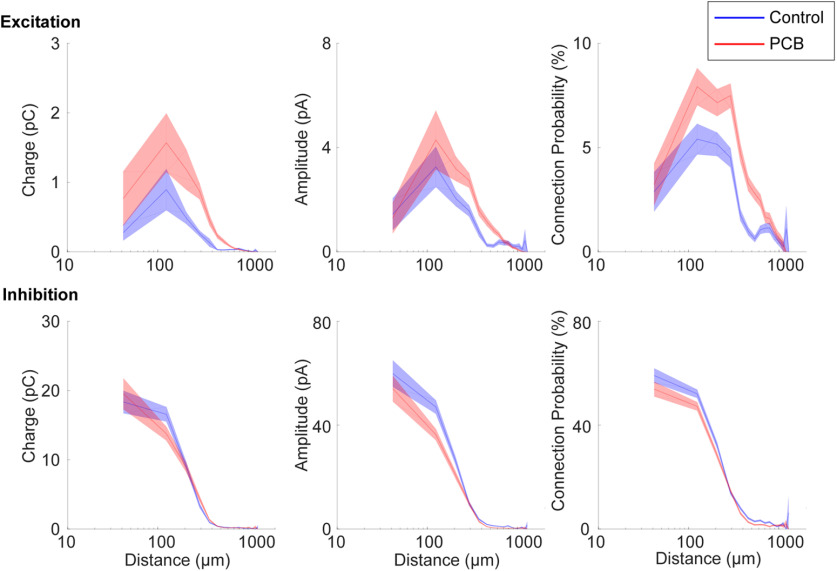
Polychlorinated biphenyls (PCBs) are enduring environmental toxicants and exposure is associated with neurodevelopmental deficits. The auditory system appears particularly sensitive, as previous work has shown that developmental PCB exposure causes both hearing loss and gross disruptions in the organization of the rat auditory cortex. However, the mechanisms underlying PCB-induced changes are not known, nor is it known whether the central effects of PCBs are a consequence of peripheral hearing loss. Here, we study changes in both peripheral and central auditory function in rats with developmental PCB exposure using a combination of optical and electrophysiological approaches. Female rats were exposed to an environmental PCB mixture in utero and until weaning. At adulthood, auditory brainstem responses (ABRs) were measured, and synaptic currents were recorded in slices from auditory cortex layer 2/3 neurons. Spontaneous IPSCs (sIPSCs) and miniature IPSCs (mIPSCs) were more frequent in PCB-exposed rats compared with controls and the normal relationship between IPSC parameters and peripheral hearing was eliminated in PCB-exposed rats. No changes in spontaneous EPSCs were found. Conversely, when synaptic currents were evoked by laser photostimulation of caged-glutamate, PCB exposure did not affect evoked inhibitory transmission, but increased the total excitatory charge, the number and distance of sites that evoke a significant response. Together, these findings indicate that early developmental exposure to PCBs causes long-lasting changes in both inhibitory and excitatory neurotransmission in the auditory cortex that are independent of peripheral hearing changes, suggesting the effects are because of the direct impact of PCBs on the developing auditory cortex.
Keywords: PCB; auditory cortex; laser photostimulation; patch-clamp; toxin; uncaging.
Copyright © 2021 Lee et al.
Figures
Similar articles
-
Developmental exposure to PCBs, MeHg, or both: long-term effects on auditory function.Environ Health Perspect. 2009 Jul;117(7):1101-7. doi: 10.1289/ehp.0800428. Epub 2009 Apr 3. Environ Health Perspect. 2009. PMID: 19654920 Free PMC article.
-
Auditory deficits in rats exposed to an environmental PCB mixture during development.Toxicol Sci. 2006 Feb;89(2):415-22. doi: 10.1093/toxsci/kfj051. Epub 2005 Nov 29. Toxicol Sci. 2006. PMID: 16317017
-
Developmental Exposure to Polychlorinated Biphenyls Prevents Recovery from Noise-Induced Hearing Loss and Disrupts the Functional Organization of the Inferior Colliculus.J Neurosci. 2023 Jun 21;43(25):4580-4597. doi: 10.1523/JNEUROSCI.0030-23.2023. Epub 2023 May 5. J Neurosci. 2023. PMID: 37147134 Free PMC article.
-
Effects of polychlorinated biphenyls on the nervous system.Toxicol Ind Health. 2000 Sep;16(7-8):305-33. doi: 10.1177/074823370001600708. Toxicol Ind Health. 2000. PMID: 11693948 Review.
-
Neurochemical effects of polychlorinated biphenyls: an overview and identification of research needs.Neurotoxicology. 1997;18(3):727-43. Neurotoxicology. 1997. PMID: 9339820 Review.
Cited by
-
Longitudinal study of seafood and fish oil supplement intake and risk of persistent tinnitus.Am J Clin Nutr. 2024 Dec;120(6):1409-1418. doi: 10.1016/j.ajcnut.2024.09.028. Epub 2024 Sep 28. Am J Clin Nutr. 2024. PMID: 39349293
-
Developmental exposure to polychlorinated biphenyls prevents recovery from noise-induced hearing loss and disrupts the functional organization of the inferior colliculus.bioRxiv [Preprint]. 2023 Mar 25:2023.03.23.534008. doi: 10.1101/2023.03.23.534008. bioRxiv. 2023. Update in: J Neurosci. 2023 Jun 21;43(25):4580-4597. doi: 10.1523/JNEUROSCI.0030-23.2023. PMID: 36993666 Free PMC article. Updated. Preprint.
-
Developmental polychlorinated biphenyl (PCB) exposure alters voiding physiology in young adult male and female mice.Am J Clin Exp Urol. 2022 Apr 15;10(2):82-97. eCollection 2022. Am J Clin Exp Urol. 2022. PMID: 35528463 Free PMC article.
-
Electroacupuncture alleviated depression-like behaviors in ventromedial prefrontal cortex of chronic unpredictable mild stress-induced rats: Increasing synaptic transmission and phosphorylating dopamine transporter.CNS Neurosci Ther. 2023 Sep;29(9):2608-2620. doi: 10.1111/cns.14200. Epub 2023 Apr 1. CNS Neurosci Ther. 2023. PMID: 37002793 Free PMC article.
-
Germ-free status but not subacute polychlorinated biphenyl (PCB) exposure altered hepatic phosphatidylcholine and ether-phosphatidylcholine levels in mice.Toxicology. 2024 May;504:153790. doi: 10.1016/j.tox.2024.153790. Epub 2024 Mar 27. Toxicology. 2024. PMID: 38552894 Free PMC article.
References
-
- Agency for Toxic Substances and Disease Registry (2000) Toxicological profile for polychlorinated biphenyls (PCBs). Washington, DC: United States Department of Health Services, Public Health Service. - PubMed
MeSH terms
Substances
Grants and funding
LinkOut - more resources
Full Text Sources
Other Literature Sources