. 2021 Apr 12;8(2):ENEURO.0395-20.2020.
doi: 10.1523/ENEURO.0395-20.2020. Print 2021 Mar-Apr.

Color Tuning of Face-Selective Neurons in Macaque Inferior Temporal Cortex

Affiliations

Color Tuning of Face-Selective Neurons in Macaque Inferior Temporal Cortex

Marianne Duyck et al. eNeuro. .

Abstract

What role does color play in the neural representation of complex shapes? We approached the question by measuring color responses of face-selective neurons, using fMRI-guided microelectrode recording of the middle and anterior face patches of inferior temporal cortex (IT) in rhesus macaques. Face-selective cells responded weakly to pure color (equiluminant) photographs of faces. But many of the cells nonetheless showed a bias for warm colors when assessed using images that preserved the luminance contrast relationships of the original photographs. This bias was also found for non-face-selective neurons. Fourier analysis uncovered two components: the first harmonic, accounting for most of the tuning, was biased toward reddish colors, corresponding to the L>M pole of the L-M cardinal axis. The second harmonic showed a bias for modulation between blue and yellow colors axis, corresponding to the S-cone axis. To test what role face-selective cells play in behavior, we related the information content of the neural population with the distribution of face colors. The analyses show that face-selective cells are not optimally tuned to discriminate face colors, but are consistent with the idea that face-selective cells contribute selectively to processing the green-red contrast of faces. The research supports the hypothesis that color-specific information related to the discrimination of objects, including faces, is handled by neural circuits that are independent of shape-selective cortex, as captured by the multistage parallel processing framework of IT (Lafer-Sousa and Conway, 2013).

Keywords: color vision; face perception; inferior temporal cortex; inferotemporal cortex; neurophysiology; social signaling.


Figures

Figure 1.
Figure 1.
Simulated population of 50 cells responding to a circular variable and corresponding Fisher information. A population with von Mises tuning curves of width t’, amplitude a’, and distribution of peaks p’ yields a Fisher information with one peak. Each of these three parameters can be individually adjusted to create a population with a different Fisher information. Uniformly increasing tuning width (t’’) while holding a’ and p’ constant yields a two-peaked Fisher information. Independently adjusting the distribution of tuning curve amplitudes (a”) or the distribution of the peaks (p”) creates an asymmetric Fisher information.
Figure 2.
Figure 2.
FMRI-guided microelectrode recording of face-selective cells in macaque IT. A, MR Images with recording microelectrodes; superimposed is shown the fMRI contrast maps of faces>bodies uncover the face patches (ML-M2, top; AL-M3, bottom). Electrodes appear black in the MRI images, and target the face patches. B, PSTH for an example cell in ML (top) and AL (bottom) showing the responses to achromatic images used to identify face cells. The red line along the x-axis shows the stimulus duration. C, Histogram showing the FSI for the population of face cells in ML (top) and AL (bottom); the dashed vertical line shows the mean FSI. All cells with an FSI > 1/3 were included in the analysis.
Figure 3.
Figure 3.
Stimuli used to measure the color responses of face-selective cells in macaque IT. A, Color space illustrating the procedure for generating the colored images. Each colored image was generated by replacing the pixels in the original achromatic image with a given hue that preserved the luminance of original pixel. B, Sixteen colored versions were generated; the chromaticity of the most saturated pixel in each version is shown in CIELUV (u*, v*; top panel) and cone-opponent color space (DKL, bottom panel).
Figure 4.
Figure 4.
Responses to color of six face-selective cells in macaque IT (two cells for each monkey M1: #2, 3; M2: #1, 5; M3: #4, 6). A, Average responses to images of faces, bodies, and fruits. The time period during which the responses were quantified in subsequent analyses is shown by the blue bar along the x-axis. B, PSTH (top panels) showing the average responses to colored images of faces; blue bar along the time axis as in panel A. Average response to face images of each color (bottom), quantified during the time period indicated by the blue bar in A, B. Error bars show 95% confidence intervals; the red line shows the best fitting sine wave, and an asterisk is provided if the color tuning for the neuron was significant (see Methods). C, Polar plot showing normalized responses to all hues; the sum of the responses to the 16 colors is normalized to equal 1. The bold black text states the norm of the vector sum. The red line shows the normalized amplitude and phase of the best fitting sine wave for neurons whose best fit was a first or second harmonic; the red text states the value of the normalized amplitude of the best-fitting sine. The small black lines on the edges of the circle show the cardinal axes of the cone-opponent color space.
Figure 5.
Figure 5.
Power spectrum of the Fourier analysis of the color-tuning responses of face-selective neurons in macaque IT. Average normalized amplitude of each harmonic component for the population of 173 cells (in black) and for significantly color-tuned cells (in red). Surrounding shaded areas show 95% confidence intervals. Dashed and dotted lines represent the averages for, respectively, ML and AL and solid lines the average across both face patches.
Figure 6.
Figure 6.
Responses to face images in each of 16 colors, for each cell in the ML face patch (left) and the AL face patch (right). Each row shows data for one cell. Cells are ordered from the top by descending color selectivity (p value indicated by the color scale). The plot shows normalized responses: the sum of the responses to the 16 colors for each row adds up to one (darker gray indicates relatively stronger responses).
Figure 7.
Figure 7.
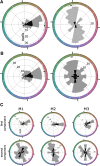
Fourier analysis of the color responses of face-selective cells in macaque IT. A, left panel, Distribution of the phase angle of the first harmonic component for cells with higher amplitude in the first harmonic than the second harmonic (126/173 cells; mean: −4.40° CI = [−17.0,+8.5]). Right panel, Phase angle of the second harmonic component for cells with higher amplitude in the second harmonic compared with the first harmonic (47/173 cells; mean: +102.7° CI = [+94.5,+111.1]). B, Distribution of the phase angle for the whole population (173 cells) for the first harmonic (left panel; mean +13.3° CI = [−0.1,+27.9]) and the second harmonic (right panel; mean: +99.6° CI = [+94.2,+105.3]). The color space is CIELUV; black tick marks are provided for the cardinal axes of the cone-opponent DKL color space (these are offset from the axes of CIELUV by 6.7°). C, Distribution of the phase angles of the two first Fourier components across all cells for each monkey plotted separately.
Figure 8.
Figure 8.
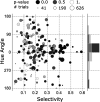
Quantification of the color responses of face-selective cells. Preferred hue angle (direction of the average vector) is plotted as a function of the strength of the color preference (norm of the average vector). Each face-selective cell is represented by a dot. The symbol size corresponds to the median number of stimulus presentations per hue. The gray value of the symbols reflects the significance of the color modulation (p value). The marginal distribution shows the normalized distribution of the preferred hue for significantly (dark gray) and non-significantly (light gray) color-tuned cells.
Figure 9.
Figure 9.
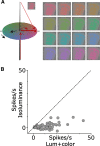
Response to equiluminant stimuli. A, Illustration of the construction of an L>M colored image. The range of gray values in the original image were replaced with colors defined by a vector along an equiluminant plane in the color space; white pixels of the original image were rendered in a saturated hue, black pixels were rendered in gray, and gray pixels were rendered in a hue of intermediate saturation. B, Firing rate above background of a population of face-selective neurons to equiluminant stimuli (x-axis) versus luminance-preserved colored stimuli (y-axis; N = 71 cells, ML = 35, AL = 36), each dot represents one cell.
Figure 10.
Figure 10.
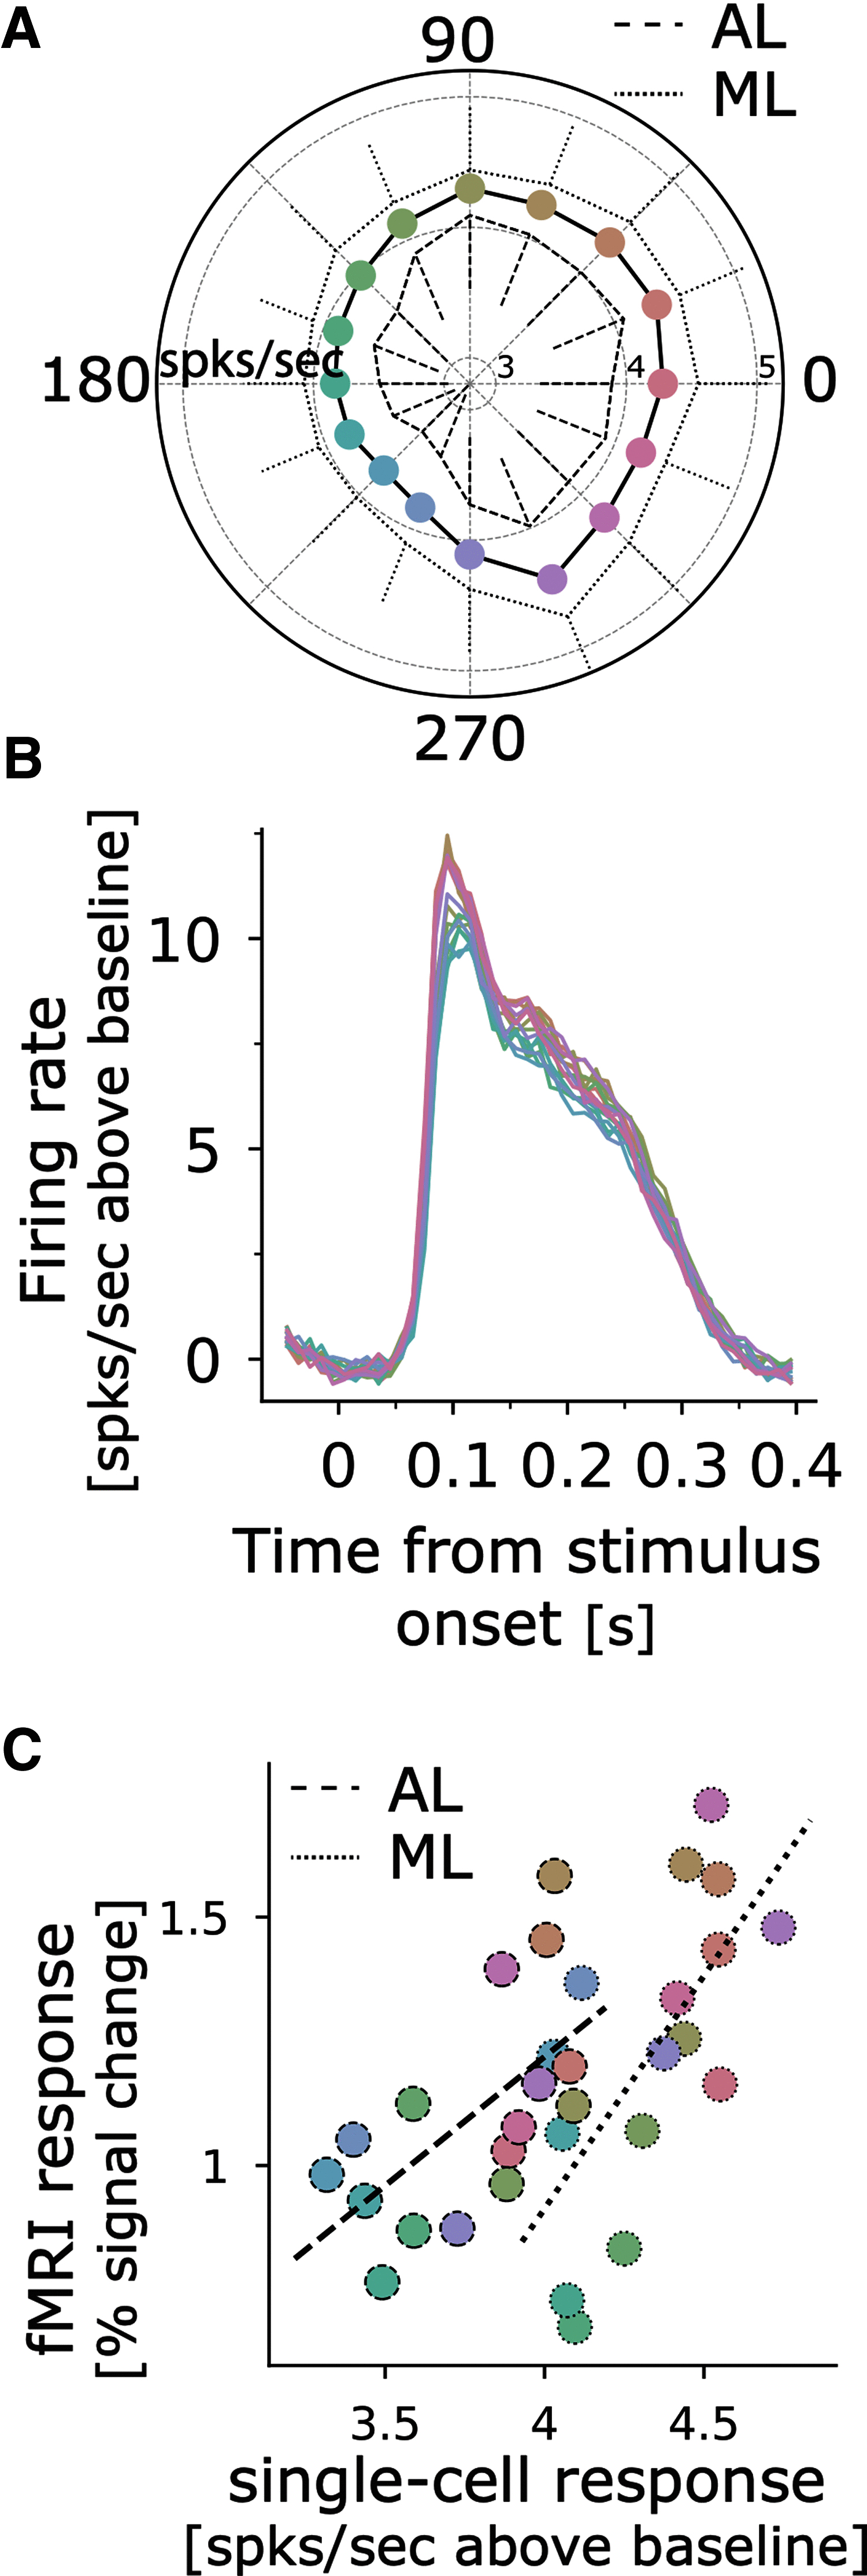
Comparison of color tuning measured using microelectrode recording of single cells in face patches and fMRI. A, Average above-background firing rate computed over a 400-ms time window that begins with the stimulus onset (peak responses away from 0 can be accounted for by summing the first two harmonics of the response). B, Average above-background response for all face-selective cells (N = 173) to face images in 16 colors (the color of the traces corresponds to the colors of the images, see Fig. 3). C, Correlation between average response across the population of single units and fMRI color tuning assessed in the face patches of monkeys M1 and M2 (see Materials and Methods).
Figure 11.
Figure 11.
Analysis of the Information represented in the population. A, Parameters of the von Mises fits over the 173 face-selective cells used to compute the population information. B, Average net firing rate across the population. C, Population Fisher information (thin line), smoothed Fisher information (thick line), and 95% confidence intervals. On both panels, the dashed line represents the distribution of natural face skin color, and the y-axis limits for Fisher information is kept constant across all three analyses. The left column corresponds to the analysis performed in CIELUV space, the middle one to the analysis projected along the greener to redder chromatic axis (positive values indicating redder), and the last one to the analysis projected along the bluer to yellower chromatic axis (positive values indicating yellower).
Figure 12.
Figure 12.
Hue preference by FSI. Each dot represents one cell in one bin of 0.2. Median and 95% confidence intervals on the median for each bin are represented above the kernel density estimate of the distribution. The mean FSI across all 234 cells is 0.55.

References

    1. Bohon KS, Hermann KL, Hansen T, Conway BR (2016) Representation of perceptual color space in macaque posterior inferior temporal cortex (the V4 complex). eNeuro 3:ENEURO.0039-16.2016. 10.1523/ENEURO.0039-16.2016 - DOI - PMC - PubMed
    1. Changizi MA, Zhang Q, Shimojo S (2006) Bare skin, blood and the evolution of primate colour vision. Biol Lett 2:217–221. 10.1098/rsbl.2006.0440 - DOI - PMC - PubMed
    1. Chauhan T, Xiao K, Yates J, Wuerger S (2015) Estimating discrimination ellipsoids for skin images. J Vis 15:820. 10.1167/15.12.820 - DOI
    1. Conway BR (2009) Color vision, cones, and color-coding in the cortex. Neuroscientist 15:274–290. 10.1177/1073858408331369 - DOI - PubMed
    1. Conway BR (2001) Spatial structure of cone inputs to color cells in alert macaque primary visual cortex (V-1). J Neurosci 21:2768–2783. - PMC - PubMed

LinkOut - more resources