. 2021 Jan 22;6(55):eabf4001.
doi: 10.1126/sciimmunol.abf4001.

Antigen identification for HLA class I- and HLA class II-restricted T cell receptors using cytokine-capturing antigen-presenting cells

Affiliations

Antigen identification for HLA class I- and HLA class II-restricted T cell receptors using cytokine-capturing antigen-presenting cells

Mark N Lee et al. Sci Immunol. .

Abstract

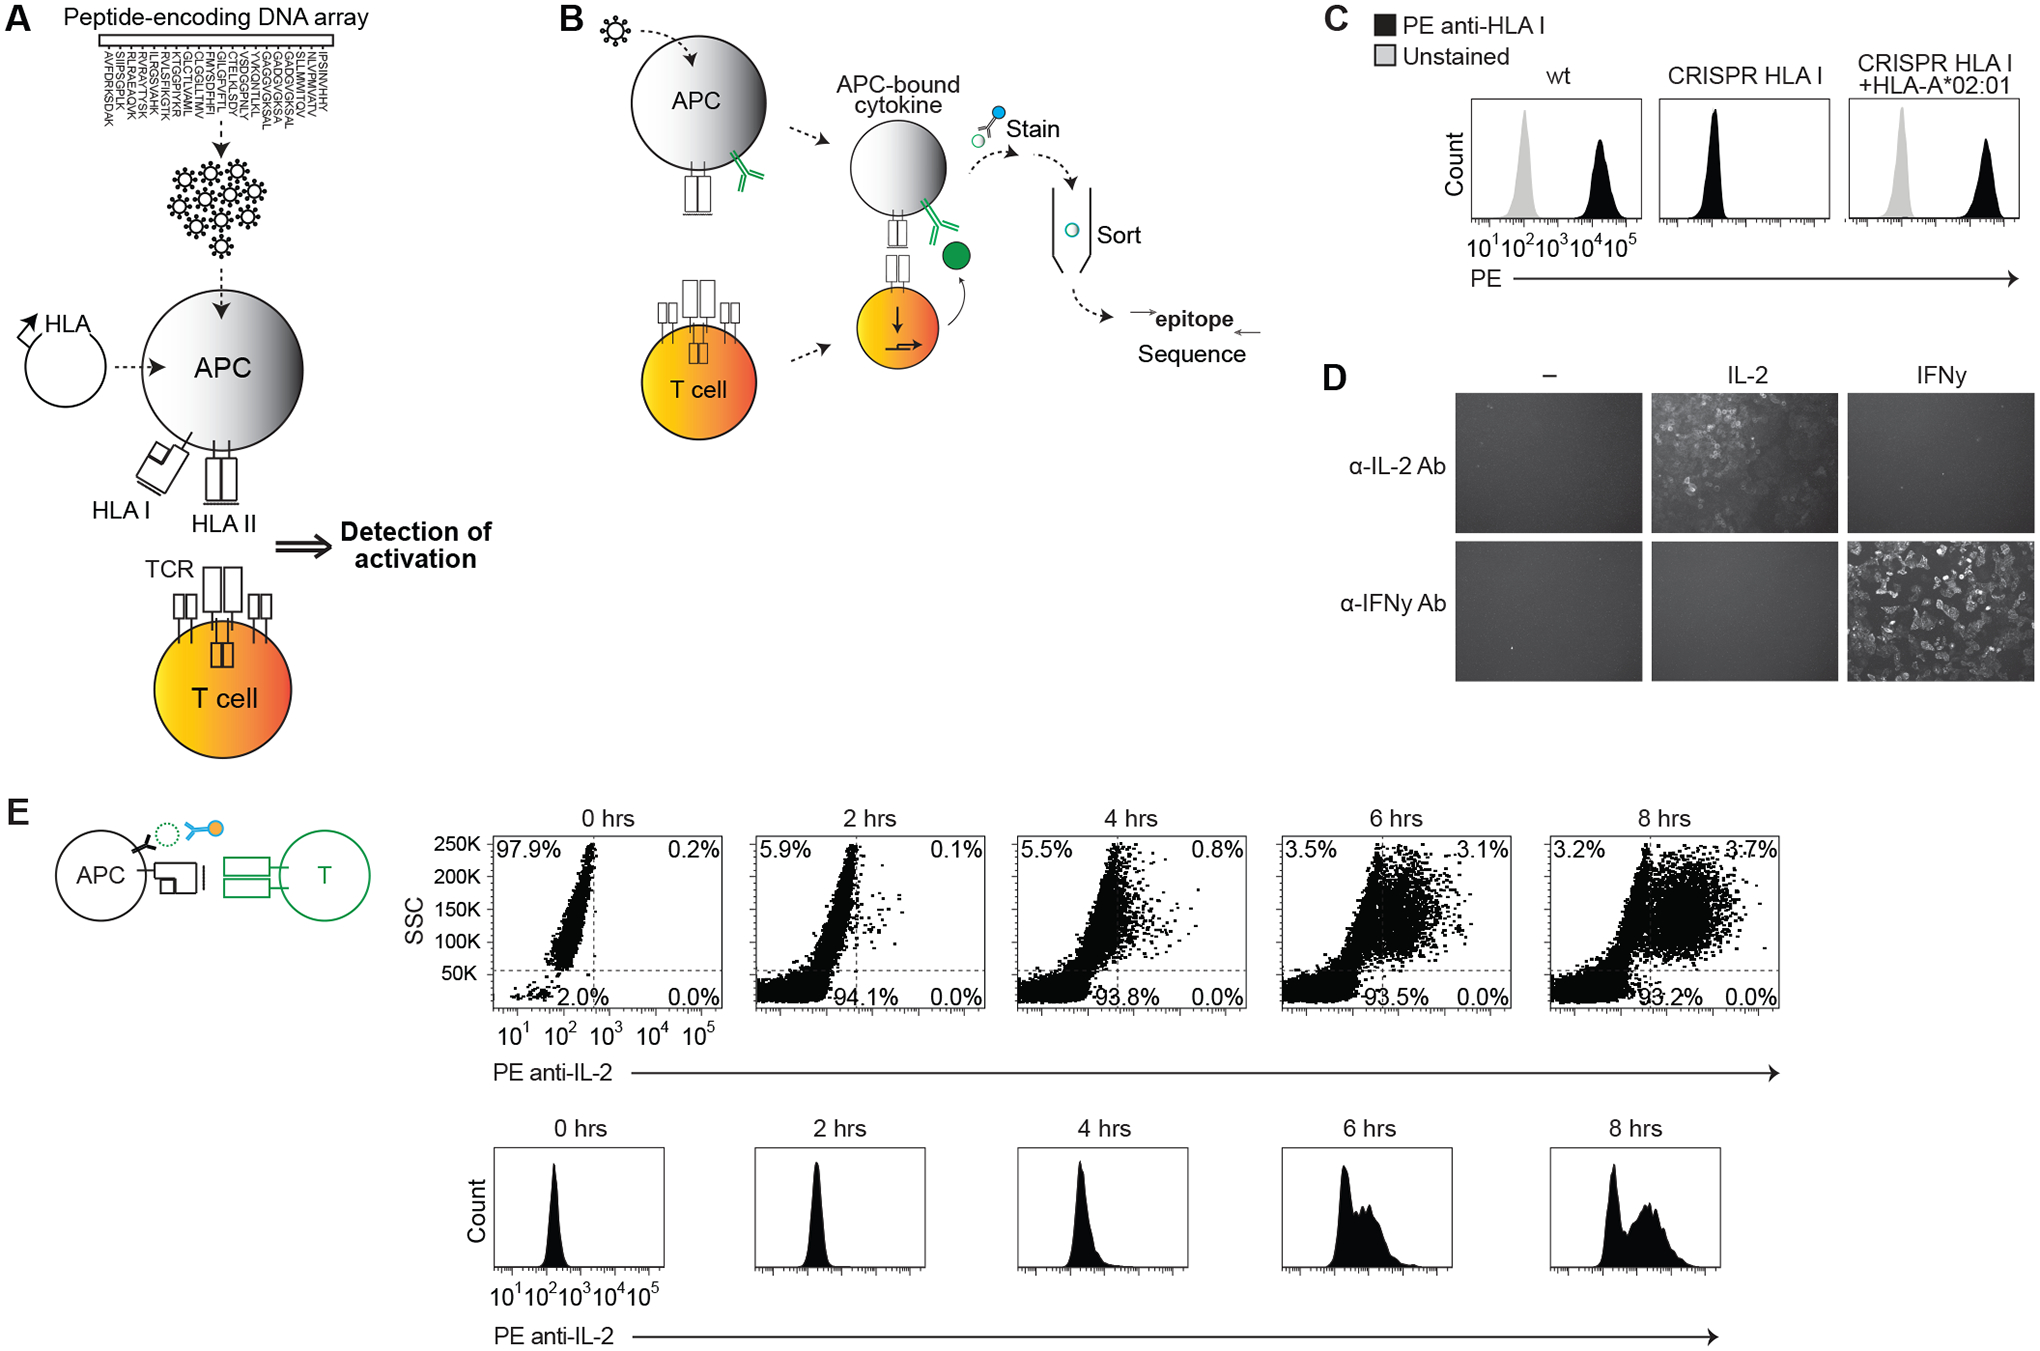
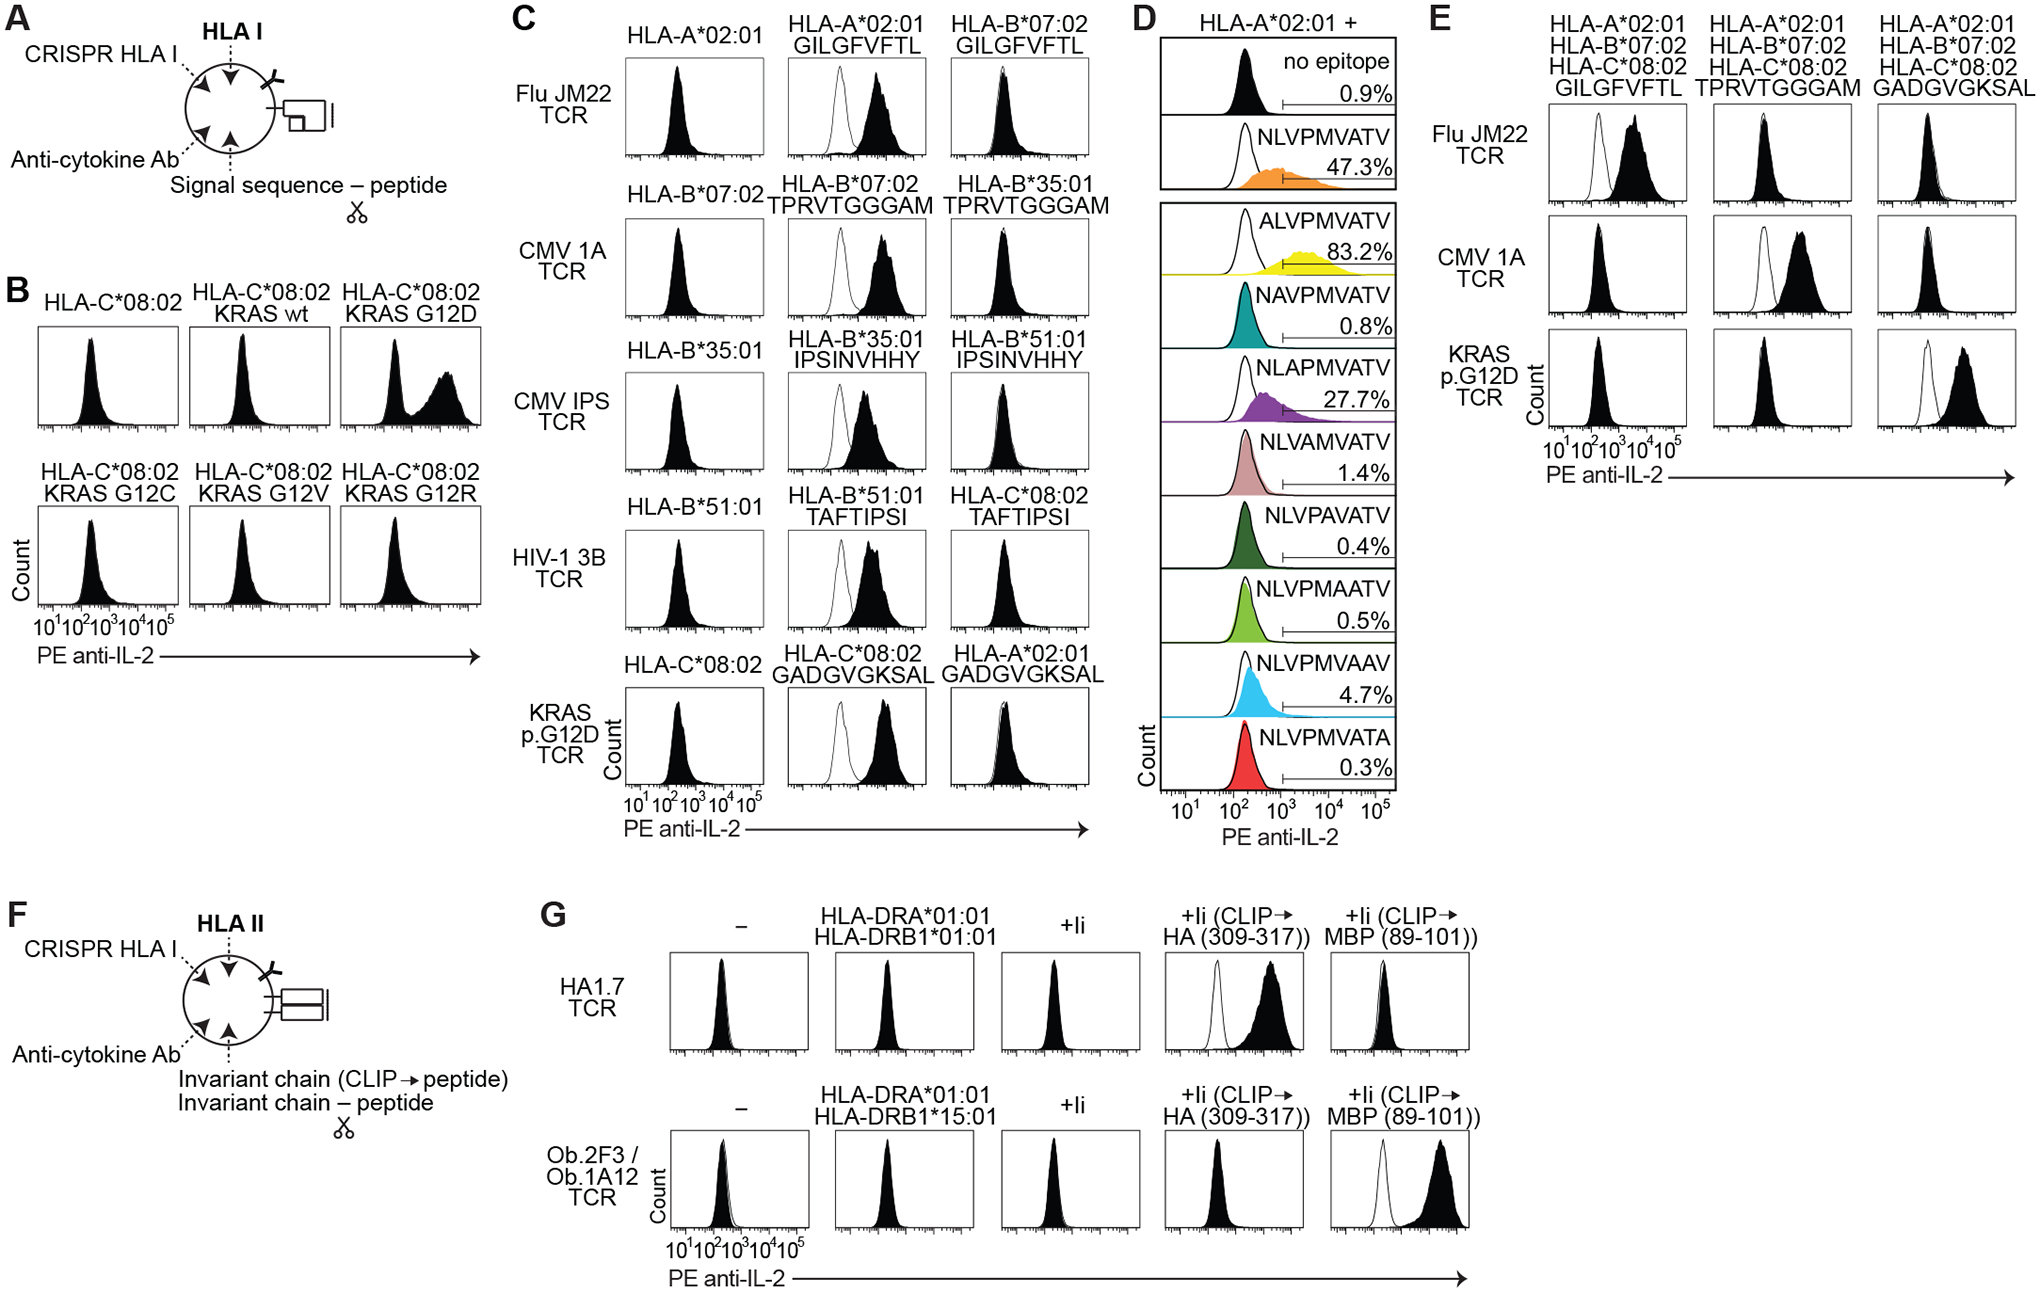
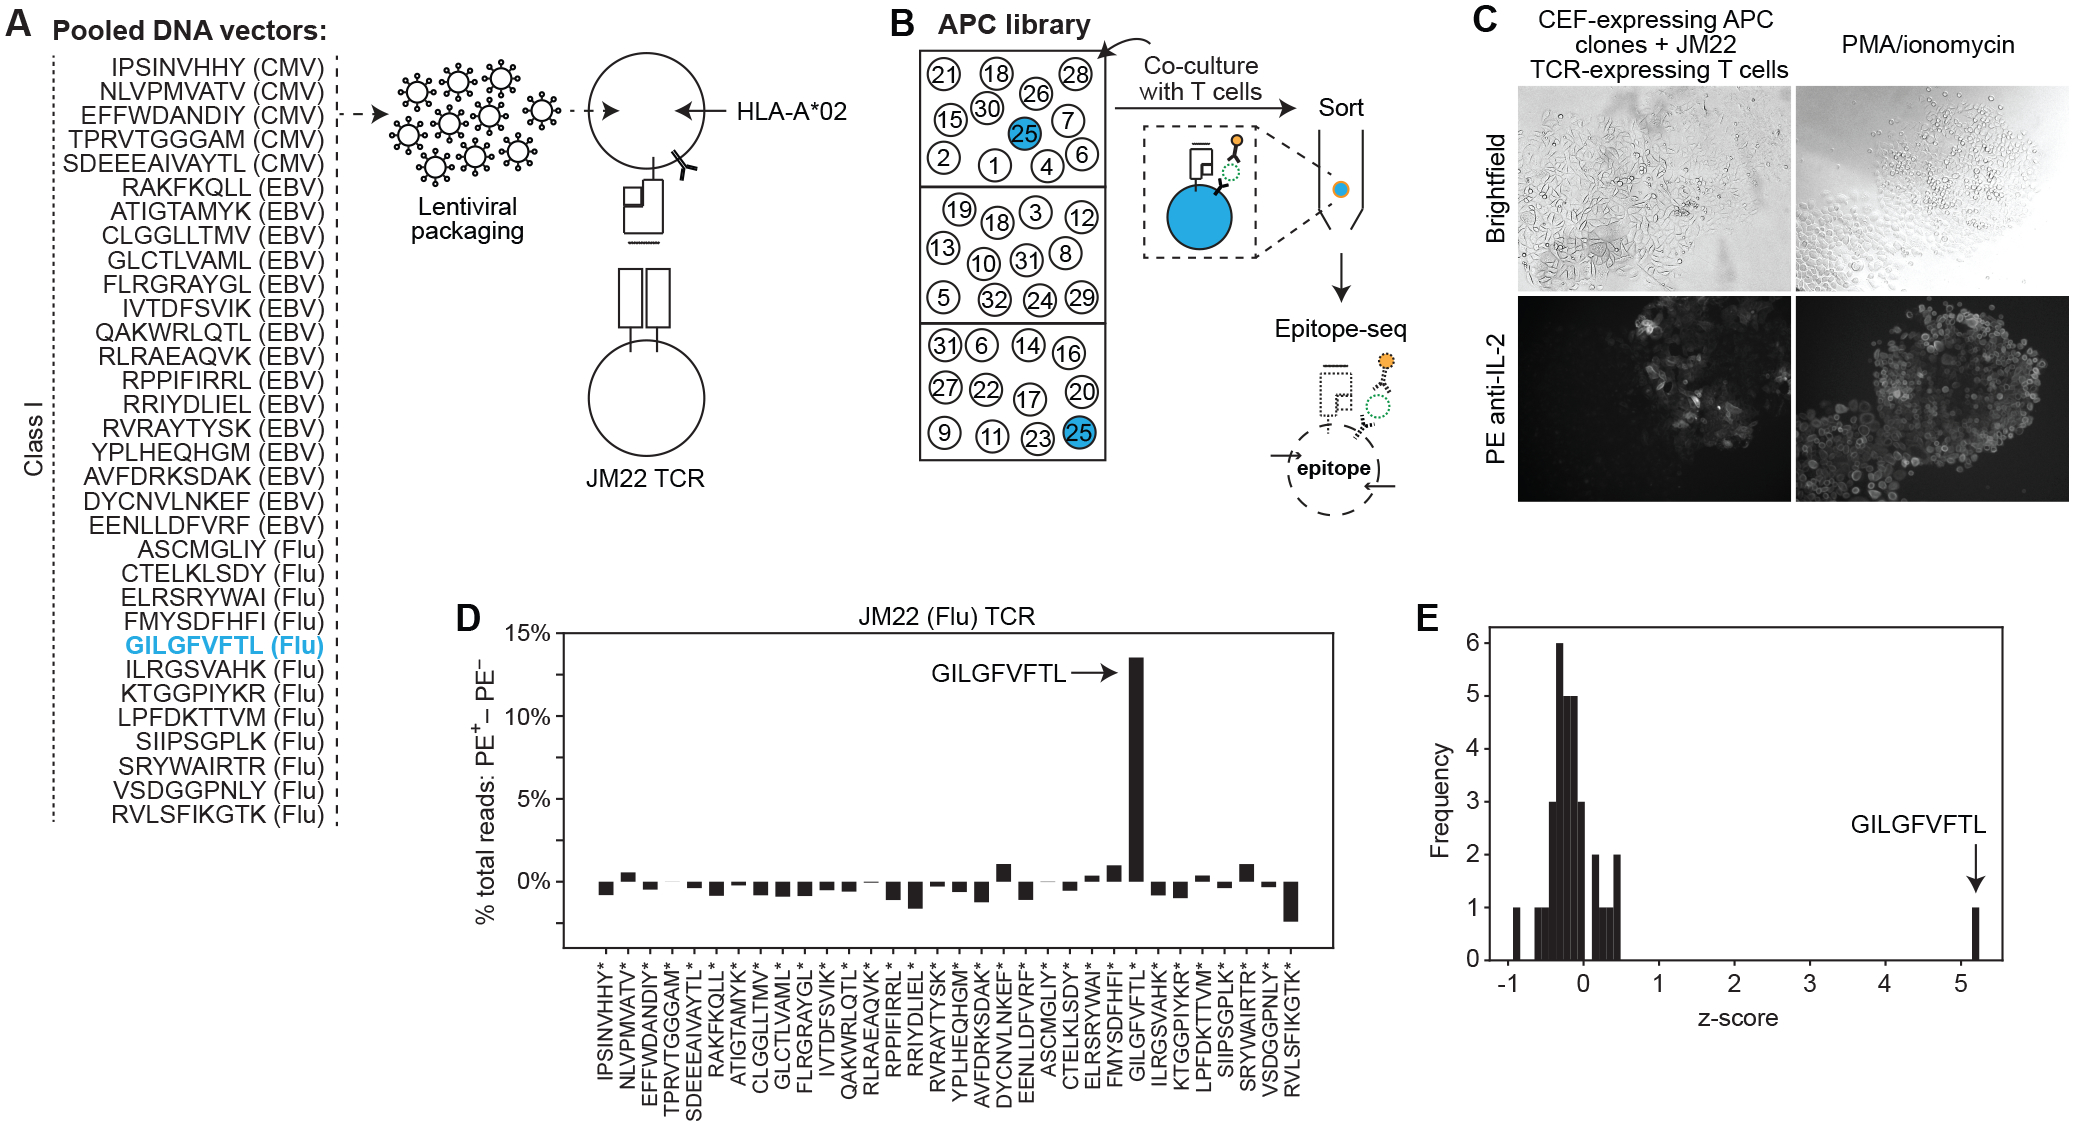
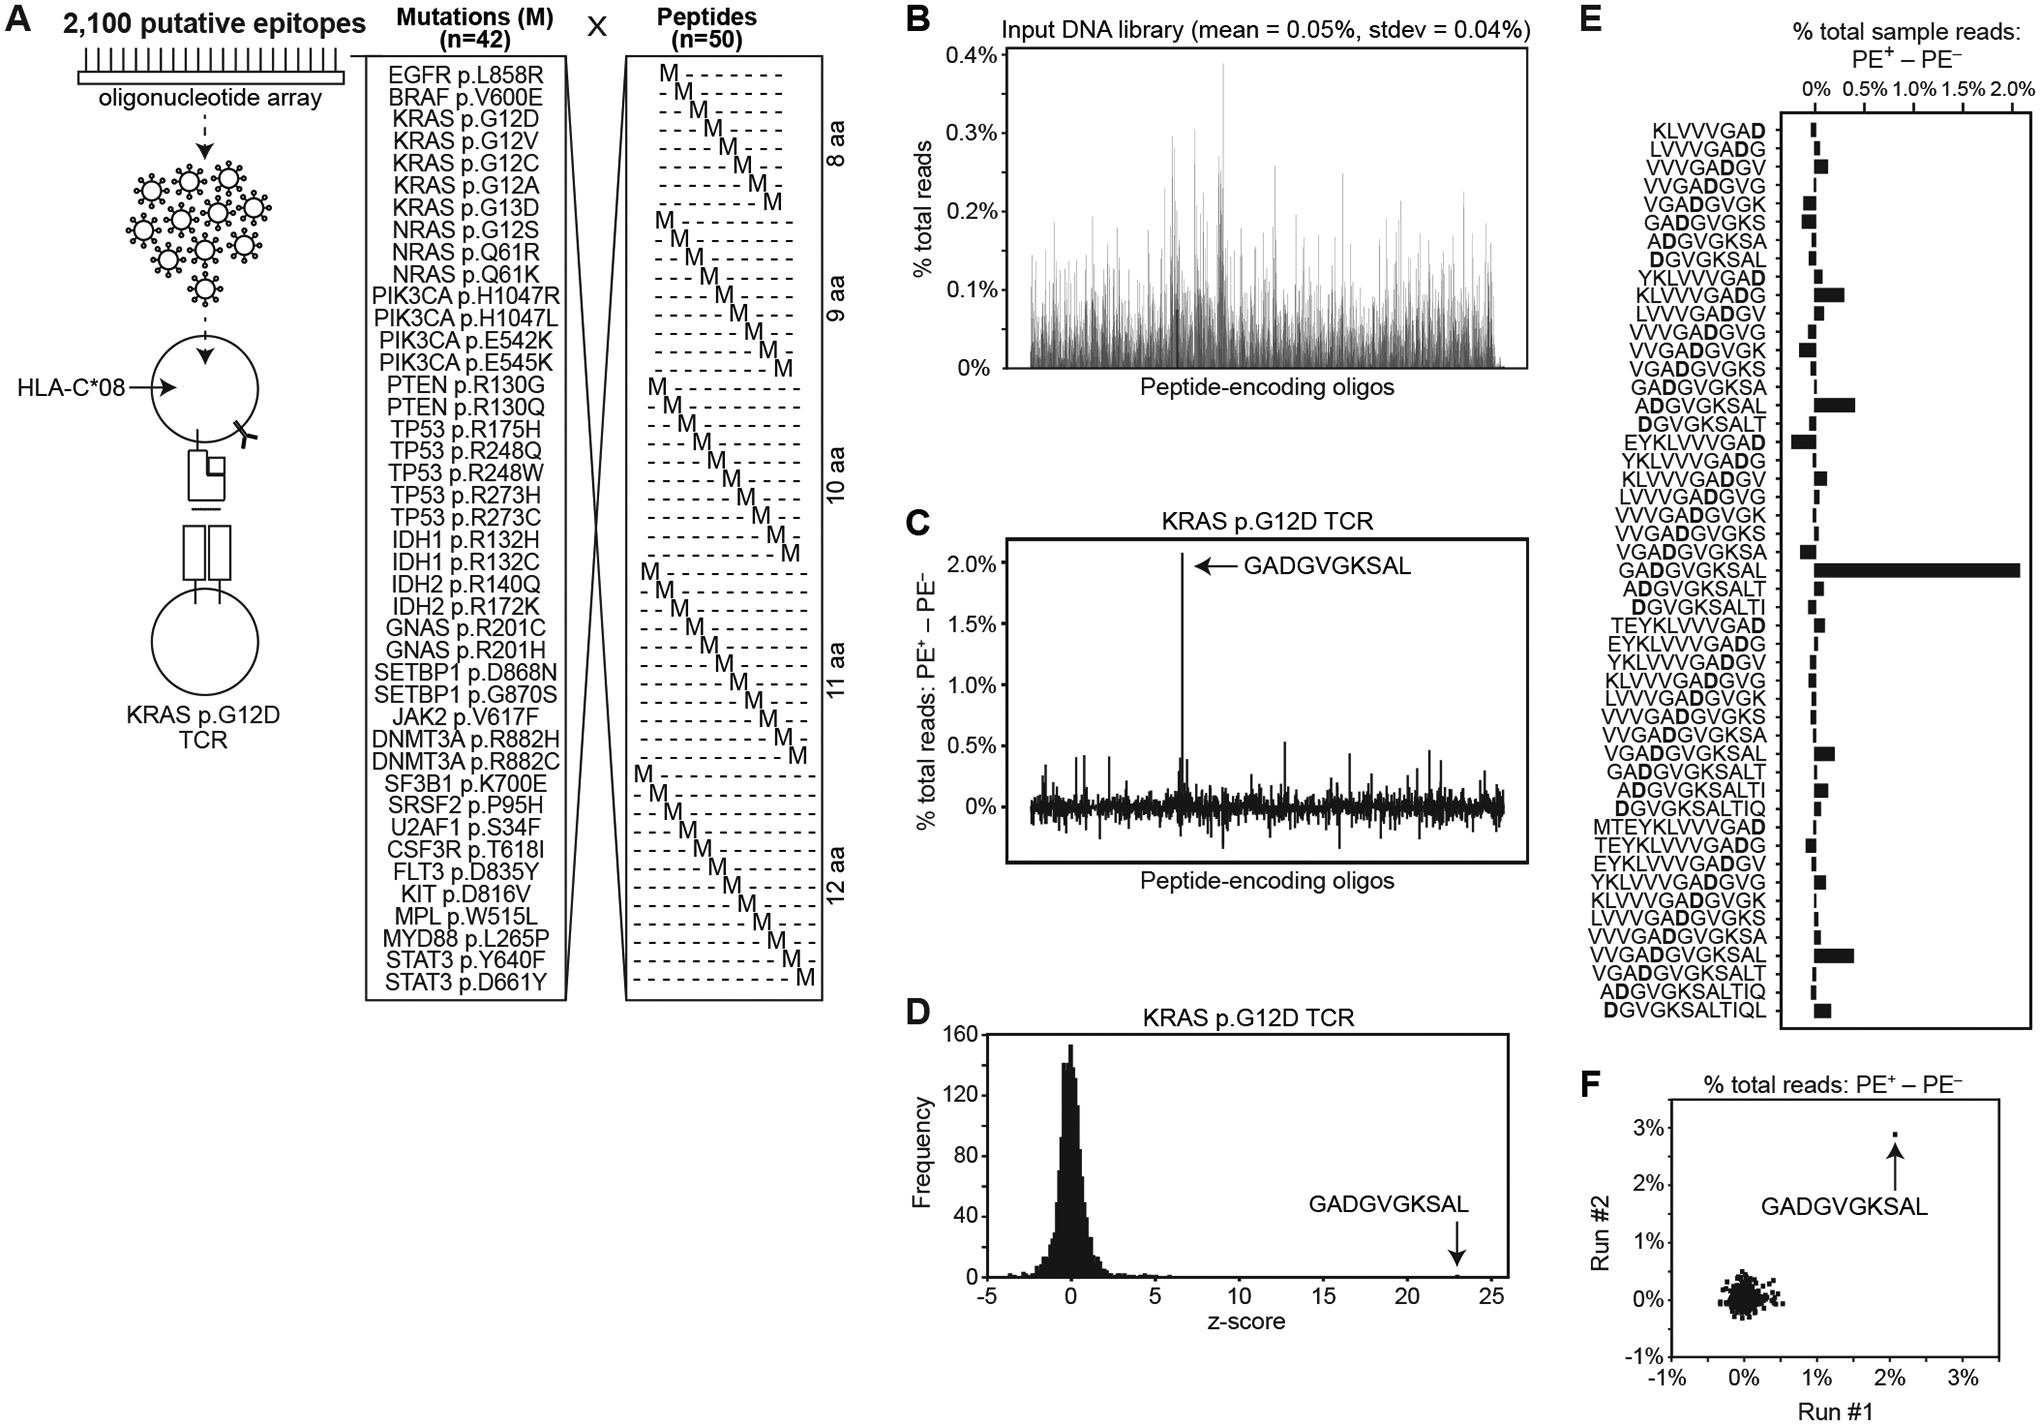
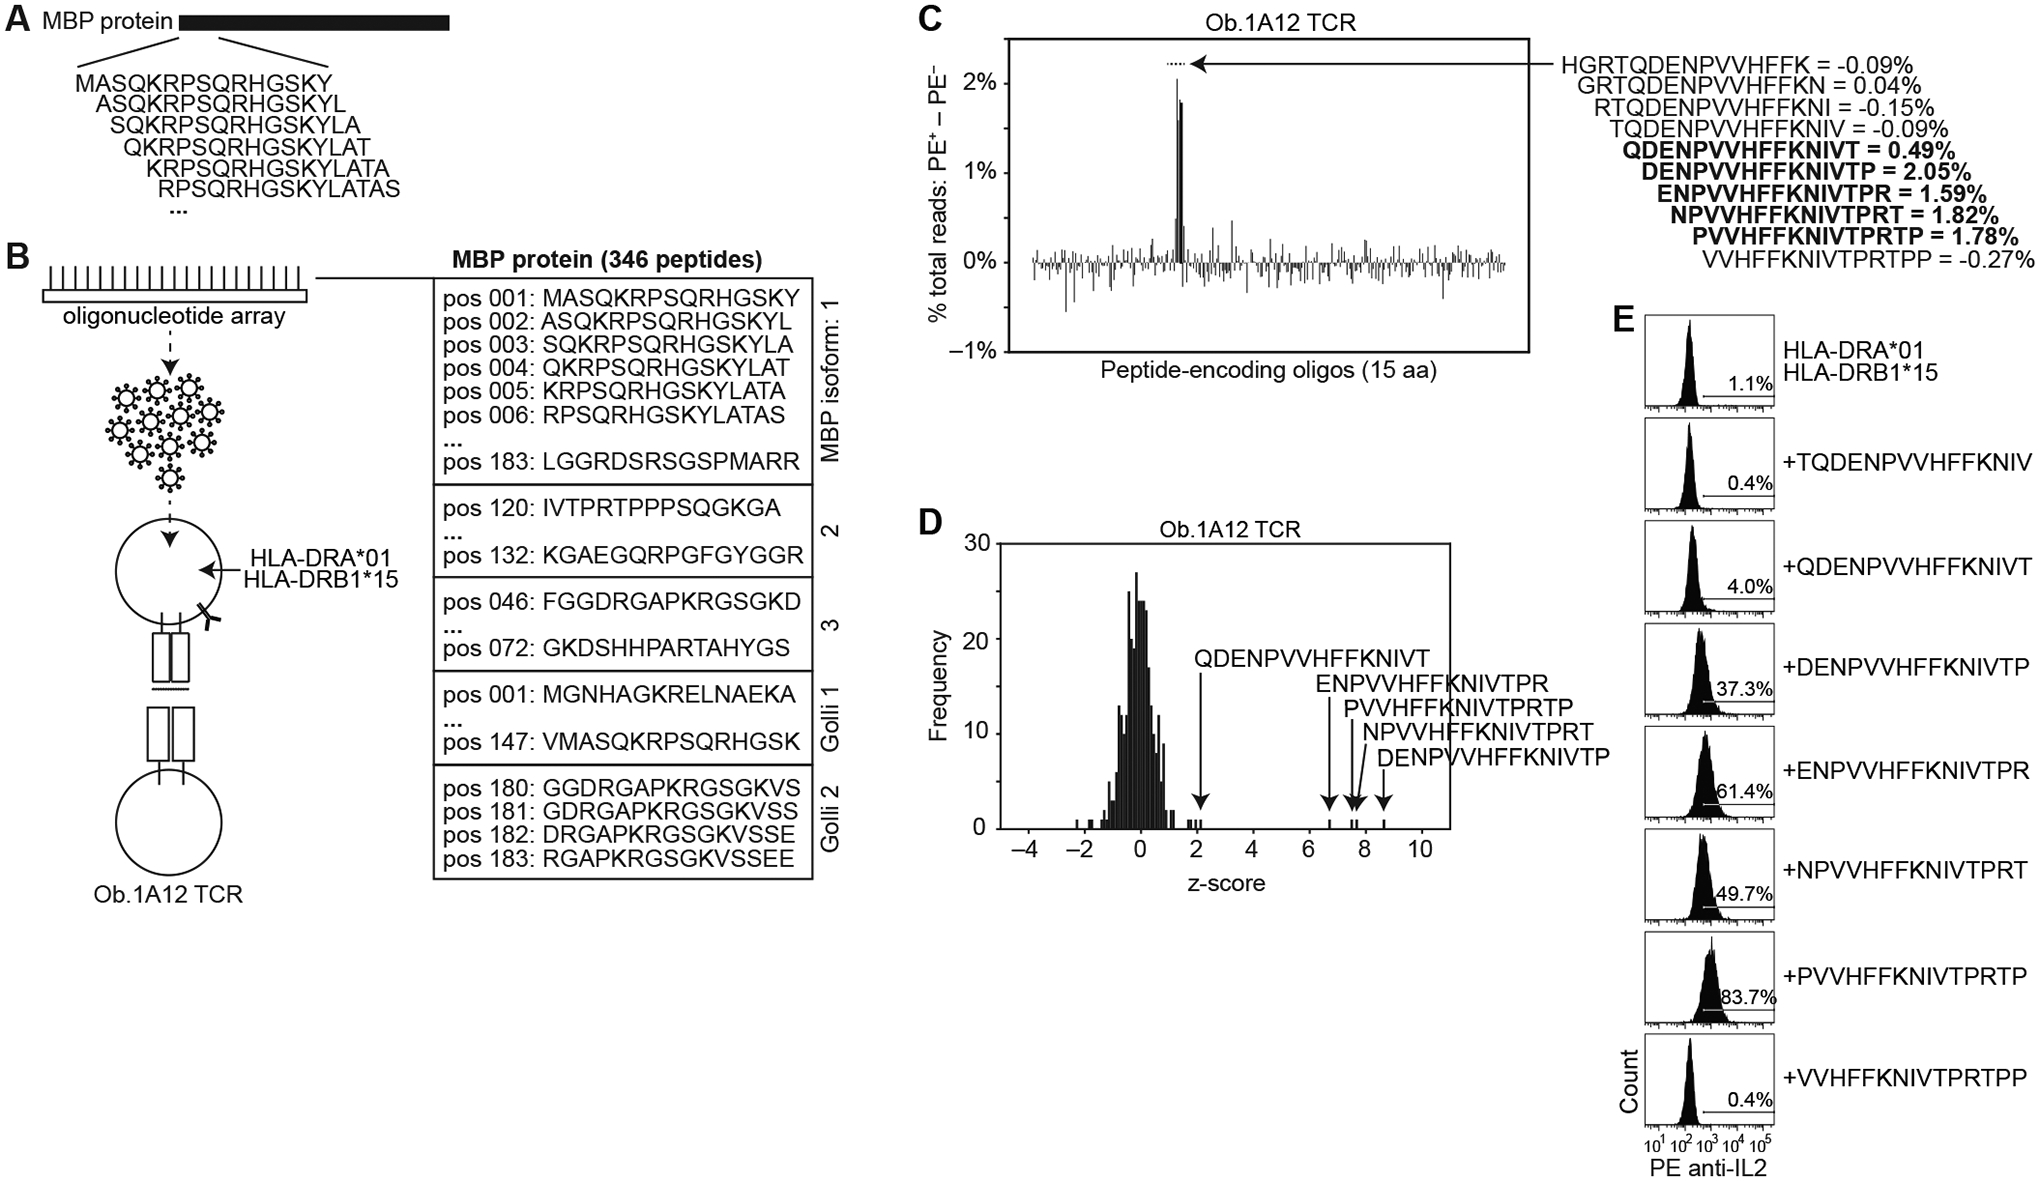
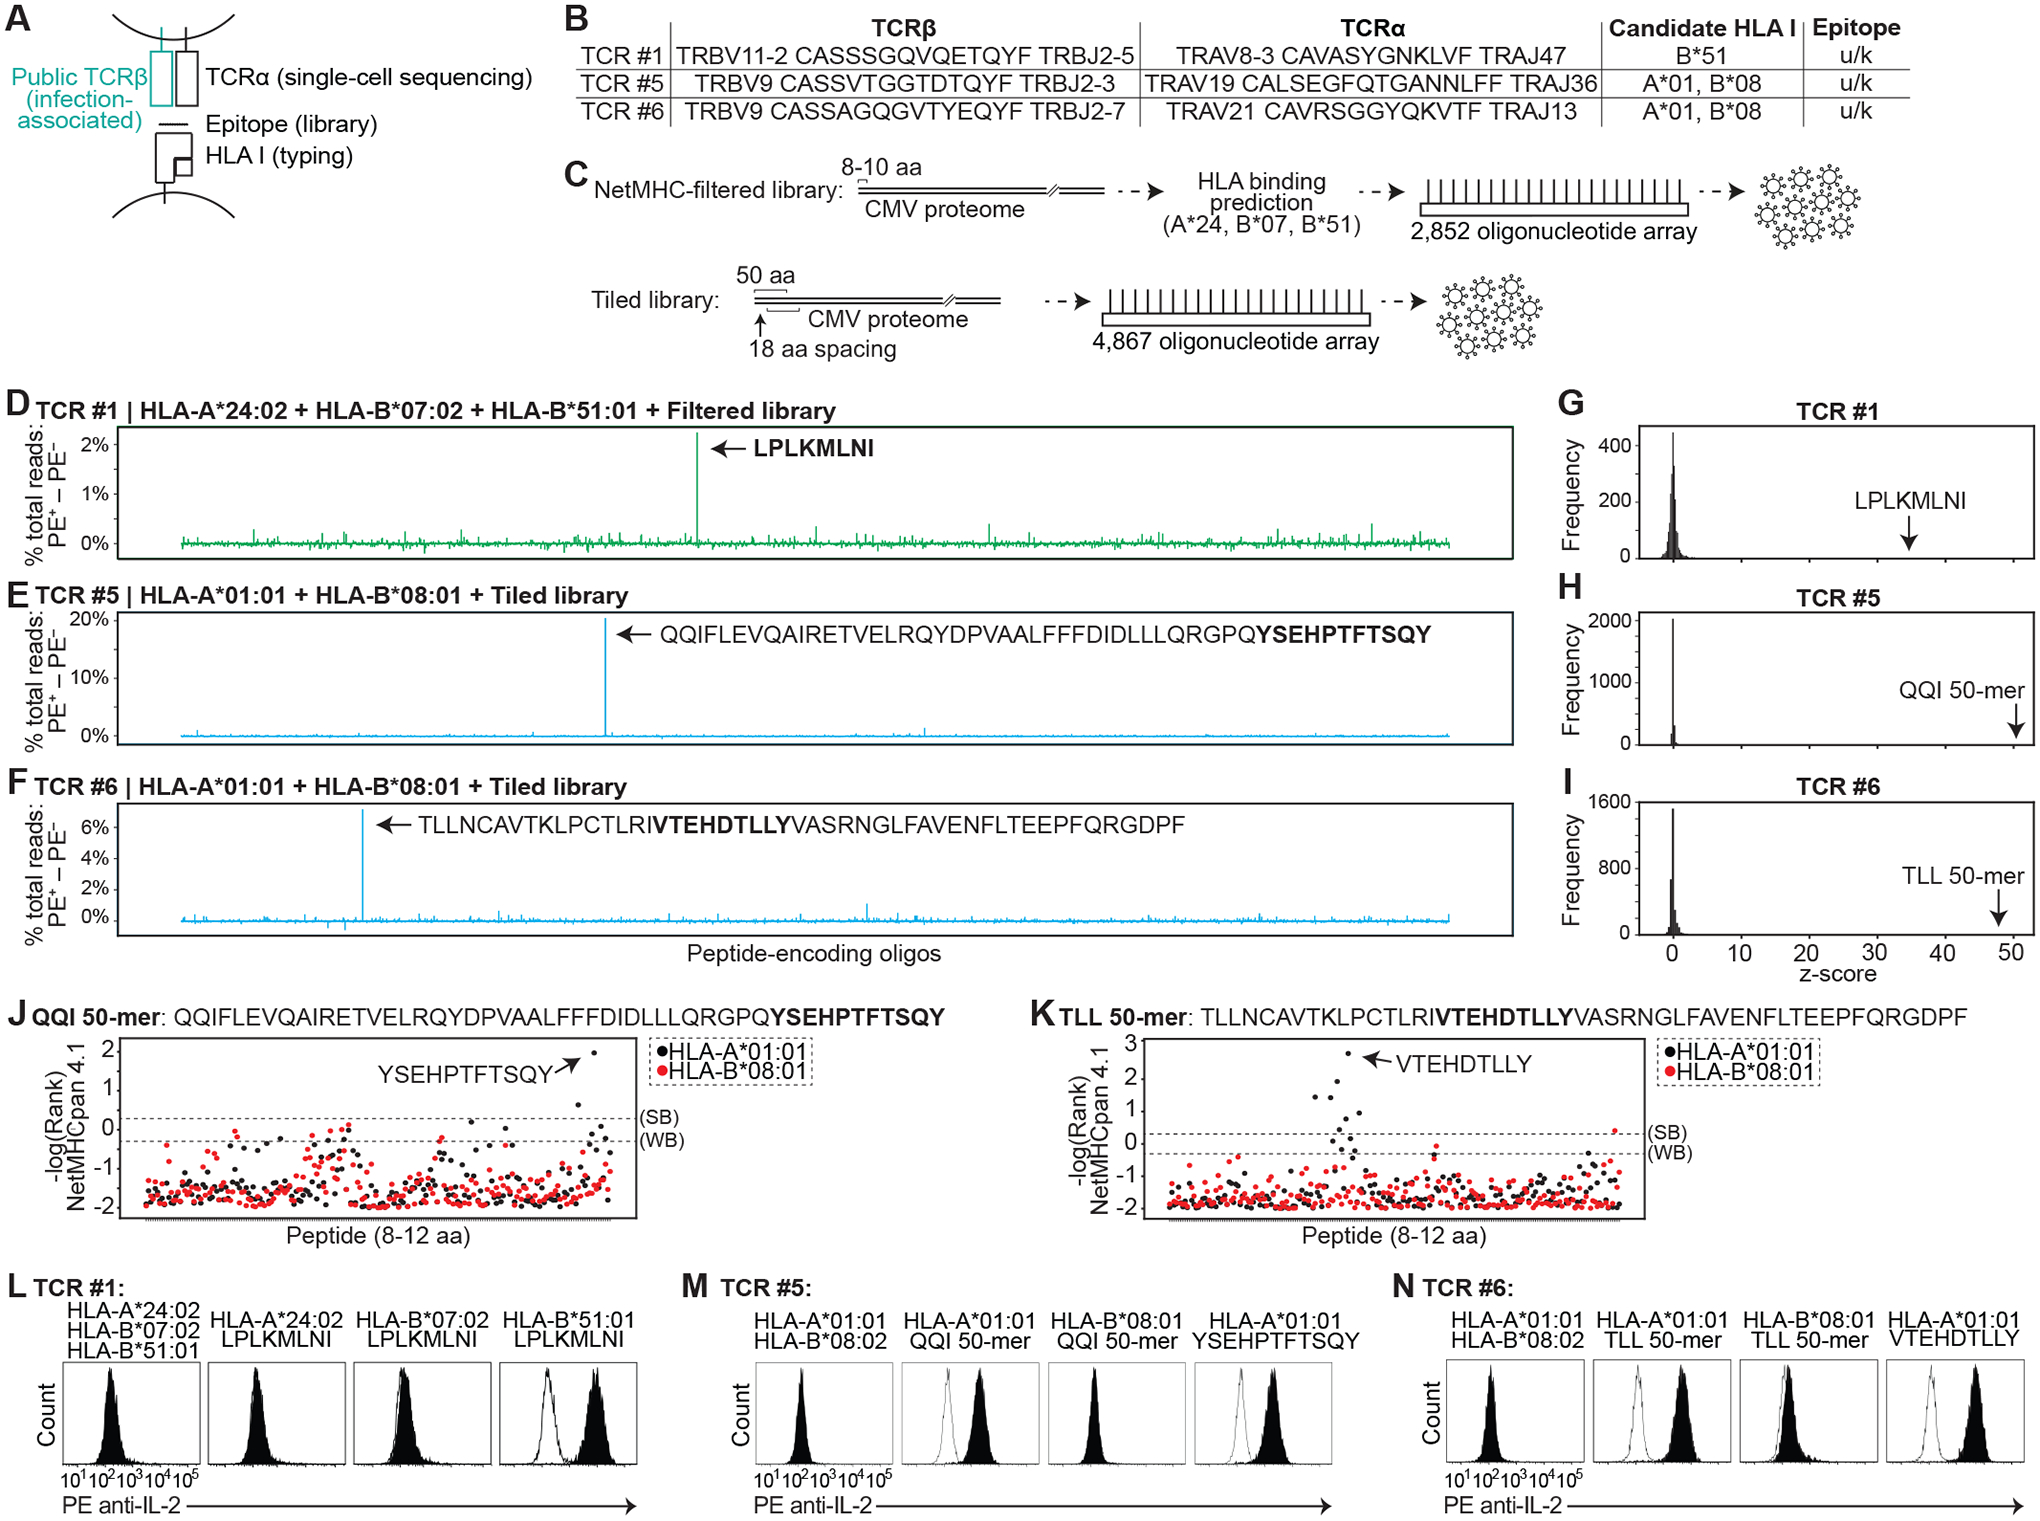
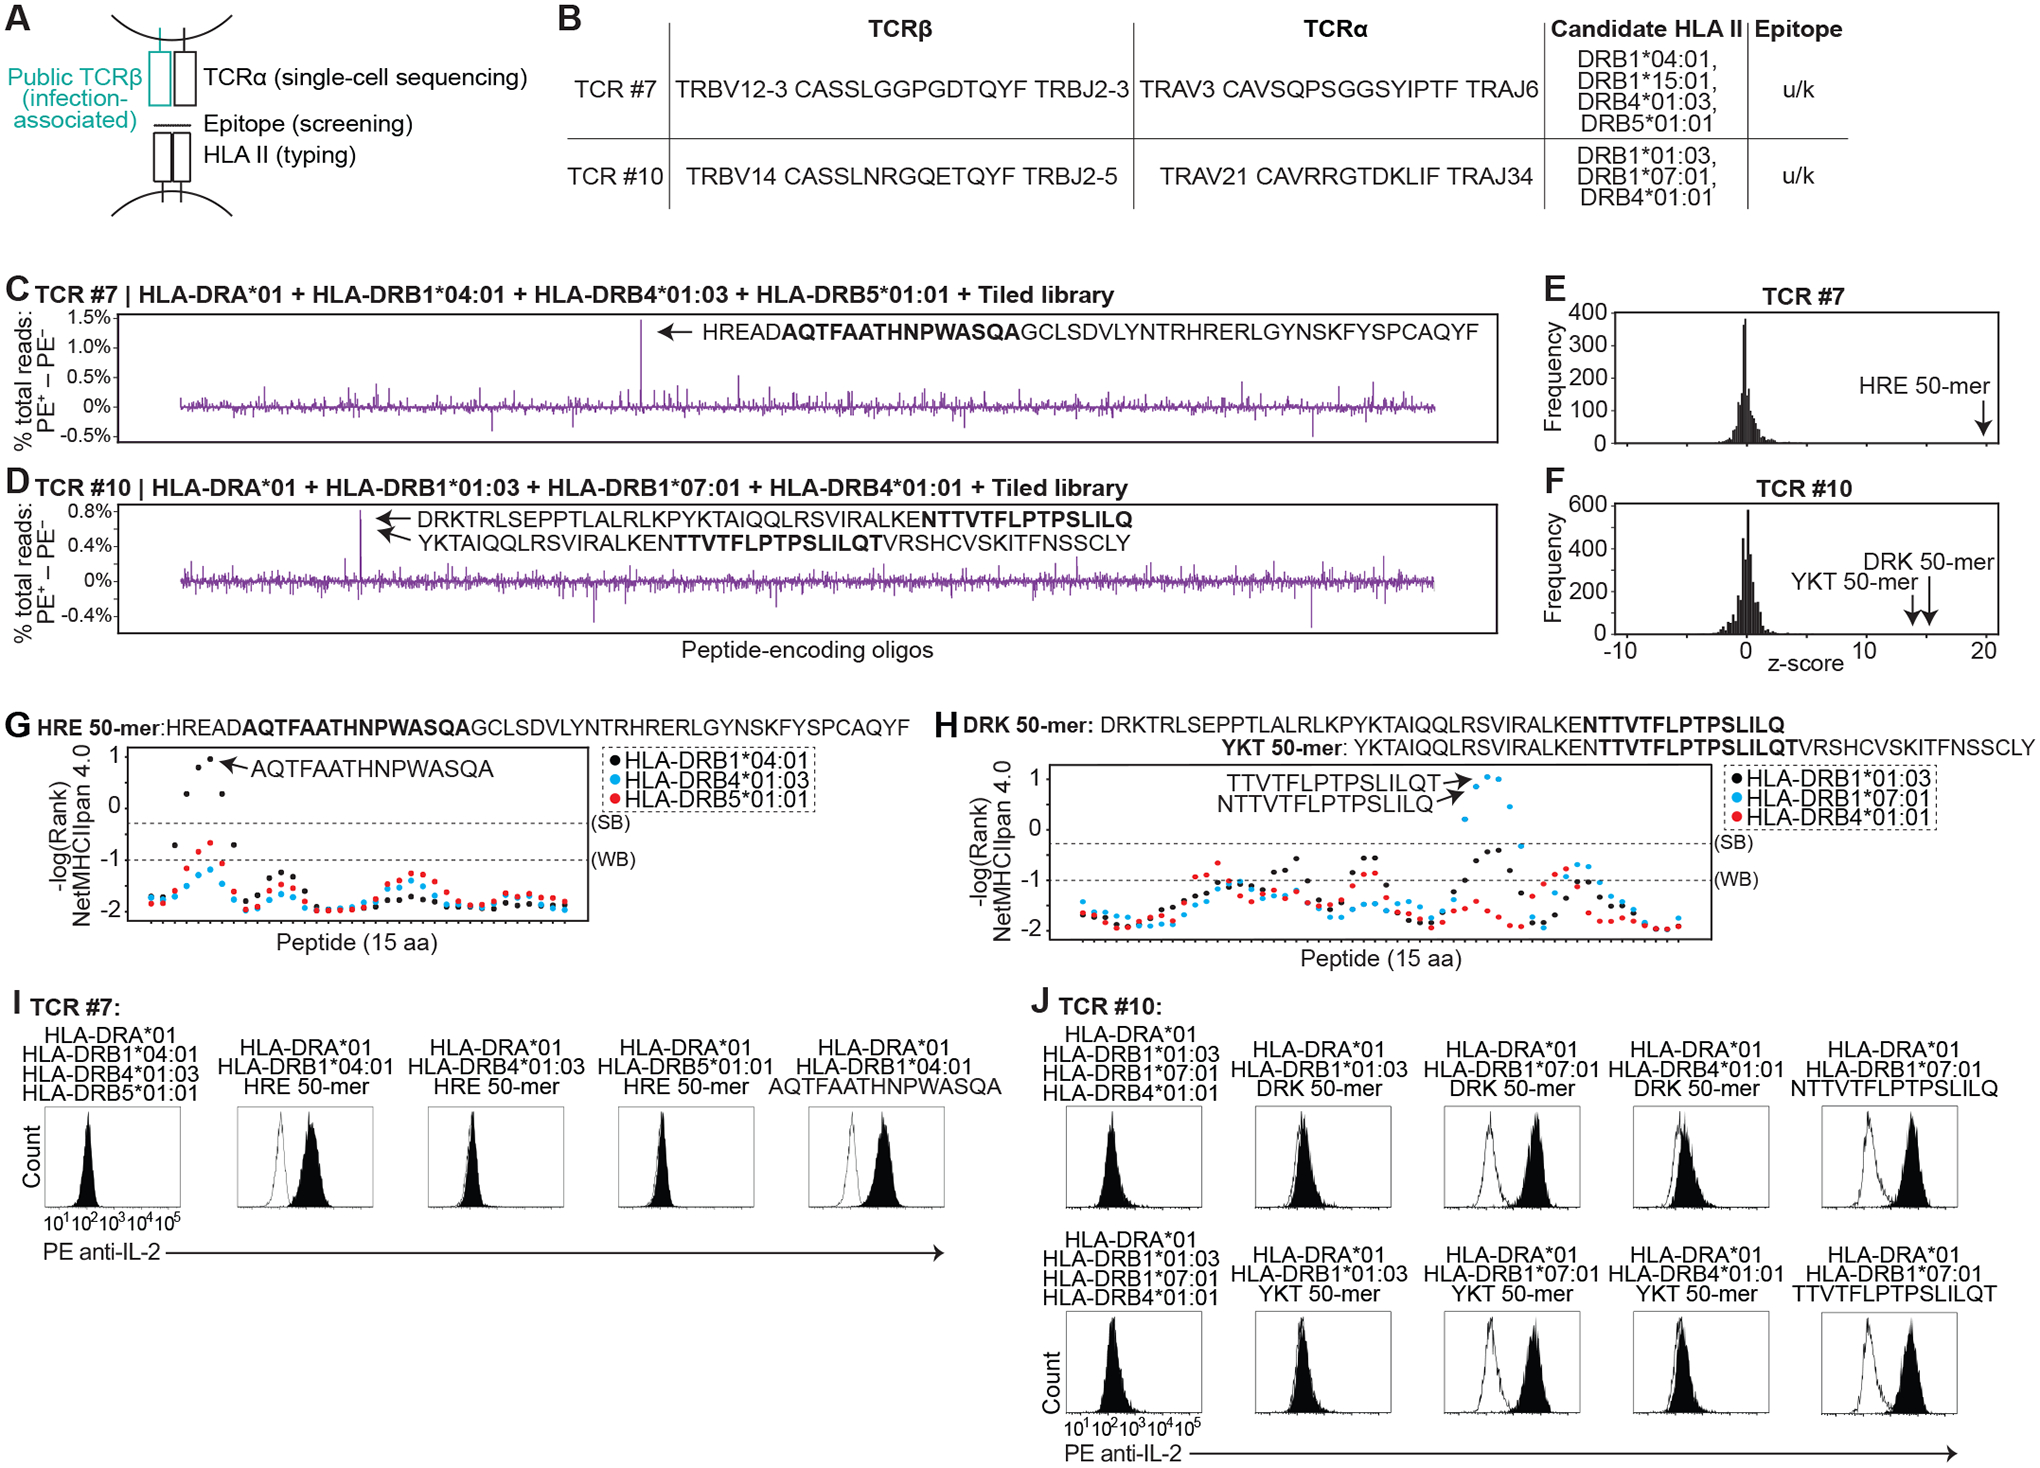
A major limitation to understanding the associations of human leukocyte antigen (HLA) and CD8+ and CD4+ T cell receptor (TCR) genes with disease pathophysiology is the technological barrier of identifying which HLA molecules, epitopes, and TCRs form functional complexes. Here, we present a high-throughput epitope identification system that combines capture of T cell-secreted cytokines by barcoded antigen-presenting cells (APCs), cell sorting, and next-generation sequencing to identify class I- and class II-restricted epitopes starting from highly complex peptide-encoding oligonucleotide pools. We engineered APCs to express anti-cytokine antibodies, a library of DNA-encoded peptides, and multiple HLA class I or II molecules. We demonstrate that these engineered APCs link T cell activation-dependent cytokines with the DNA that encodes the presented peptide. We validated this technology by showing that we could select known targets of viral epitope-, neoepitope-, and autoimmune epitope-specific TCRs, starting from mixtures of peptide-encoding oligonucleotides. Then, starting from 10 TCRβ sequences that are found commonly in humans but lack known targets, we identified seven CD8+ or CD4+ TCR-targeted epitopes encoded by the human cytomegalovirus (CMV) genome. These included known epitopes, as well as a class I and a class II CMV epitope that have not been previously described. Thus, our cytokine capture-based assay makes use of a signal secreted by both CD8+ and CD4+ T cells and allows pooled screening of thousands of encoded peptides to enable epitope discovery for orphan TCRs. Our technology may enable identification of HLA-epitope-TCR complexes relevant to disease control, etiology, or treatment.


Figures

Fig. 1.
Fig. 1.. Establishing a system for epitope identification by APC cytokine capture.
(A and B) Schematic representation of system to express a library of peptide-encoding genes on specified HLA proteins (A), and to identify APCs that present epitopes by capturing T cell activation-dependent cytokines on the APC surface (B). (C) Flow cytometric analysis of HLA class I expression on wild-type HeLa cells, class I KO cells (CRISPR HLA I), or class I KO cells stably expressing HLA-A*02:01. (D) Fluorescent microscopy of HeLa cells expressing membrane-bound anti-IL-2 or anti-IFN-γ antibody, and incubated for 2 hours with 100 ng/mL recombinant IL-2, 100 ng/mL recombinant IFN-γ, or with no cytokine. Cells were stained with respective PE anti-cytokine antibodies. (E) Flow cytometric analysis showing SSC versus PE anti-IL-2 antibody staining (top) or PE histogram (bottom) for indicated time intervals after co-culture of C25 TCR-expressing T cells with APCs expressing HLA-A*02:01 and a CMV epitope-encoding gene. Data are representative of two or three independent experiments.
Fig. 2.
Fig. 2.. Engineered APCs capture cytokine in an HLA class I or II epitope-specific manner.
(A) Schematic of genetic alterations to engineer cytokine-capturing APCs. Each class I minigene is fused to a signal sequence. (B) Flow cytometric analysis of IL-2 cell surface capture after co-culture of KRAS p.G12D-reactive TCR-expressing T cells with APCs expressing HLA-C*08:02 with or without encoded KRAS peptides. (C to E) Histogram of IL-2 cell surface capture after co-culture of indicated TCR-expressing T cells with APCs expressing indicated HLA and encoded peptides, including encoded peptides that bind to different HLA (C); alanine substitution variants of NLVPMVATV (D); or encoded peptides co-expressed with multiple HLA genes (E). (F) Schematic of genetic alterations to engineer cytokine-capturing APCs for class II presentation. Class II encoded peptides are fused to the invariant chain (Ii) either replacing CLIP or with an intervening cathepsin-cleavage sequence. (G) Histogram of IL-2 cell surface capture after co-culture of indicated TCR-expressing T cells with APCs expressing indicated HLA and peptide-encoding genes. Peptides were encoded in place of CLIP. Wild-type Ii was used as a control. For each TCR, histogram of HLA alone is overlaid in white. Data are representative of two or three independent experiments.
Fig. 3.
Fig. 3.. Identification of a target epitope from a pooled oligonucleotide library.
(A) Schematic showing the pooled set of 32 CEF epitope-encoding genes. HLA-A*02:01-expressing APCs were transduced with the pooled peptide-encoding genes at m.o.i. <1, and co-cultured with T cells expressing JM22 TCR. (B) Schematic of strategy to identify the target epitope. The APC library is seeded into wells in numbers less than the diversity of the encoded peptide library. T cells are added to all wells. APCs expressing the target epitope-encoding gene become labeled with cytokine and can be selected. (C) Brightfield (top) and fluorescent (bottom) microscopy of HLA-A*02:01- and CEF epitope-expressing (m.o.i. <1) APC clones that were clonally expanded, co-cultured with JM22 TCR-expressing T cells, and then stained with PE anti-IL-2 antibody. PMA (80 ng/mL) and ionomycin (1000 ng/mL) were added to the T cells and APCs as a positive control (right). (D) Difference between sorted and flow-through cells in percentage of total read counts for each encoded peptide. (E) Frequency of z-score measurements from screening data. Data are representative of two independent experiments.
Fig. 4.
Fig. 4.. Scale-up to identify a targeted neoepitope from an oligonucleotide array.
(A) Schematic showing the set of 2,100 peptide-encoding minigenes encoding each of 42 common somatic mutations in all possible positions in 8–12 aa peptides. HLA-C*08:02-expressing APCs were transduced with the pooled peptide-encoding genes at m.o.i. <1, and co-cultured with T cells expressing KRAS p.G12D-reactive TCR. (B) Read count of amplified peptide-encoding sequences from the input DNA library. GADGVGKSAL epitope is shown in blue. (C) Difference between sorted and flow-through cells in percent total read count for each encoded peptide. (D) Frequency of z-score measurements from screening data. (E) Difference between sorted and flow-through cells in percent total read count for each encoded peptide; only epitopes containing the KRAS p.G12D mutation are shown. (F) Comparison between run #1 and run #2 of differences in percent total read count between sorted and flow-through cells for each encoded peptide. Data are representative of two independent experiments.
Fig. 5.
Fig. 5.. Fine mapping epitope sequences using tiled encoded peptides.
(A) Schematic showing in silico construction of an encoded peptide library consisting of all 15 aa peptides in the MBP protein. (B) Schematic showing the positions (pos) of the 346 unique encoded peptides from indicated MBP isoforms. Peptide-encoding genes were cloned 3’ of CD74 with an intervening cathepsin-cleavage sequence. HLA-DRA*01:01- and HLA-DRB1*15:01-expressing APCs were transduced with the pooled peptide-encoding genes at m.o.i. <1, and co-cultured with T cells expressing Ob.1A12 TCR. (C) Difference between sorted and flow-through cells in percent total read count for each encoded peptide. Values of selected peptide sequences are shown on the right. (D) Frequency of z-score measurements from screening data (left). (E) Histogram of IL-2 cell surface capture after co-culture of Ob.1A12 TCR-expressing T cells with APCs expressing HLA-DRA*01 and HLA-DRB1*15:01 alone, or with indicated peptide-encoding genes. Screening data are representative of one independent experiment run in triplicate. Flow cytometry data are representative of three independent experiments.
Fig. 6.
Fig. 6.. Identification of epitopes targeted by orphan T cell receptors.
(A) Schematic showing sources of genes used to functionally test HLA-peptide-TCR interactions. (B) Table of TCRβ and TCRα genes screened below, with candidate HLA I. (C) Two CMV peptide-encoding libraries were synthesized. The “NetMHC-filtered” library consisted of 2,852 8–10 aa peptides selected for binding to HLA-A24:02, HLA-B07:02, or HLA-B51:01. The “tiled” library consisted of 4,867 50 aa peptides tiling the CMV proteome, each with 18 aa spacing from the adjacent peptide. (D to F) Difference between sorted and flow-through cells in percent total read count for each encoded peptide sequence screened with TCR #1 (D), TCR #5 (E), or TCR #6 (F). (G to I) Frequency of z-score measurements from screening data for TCR #1 (G), TCR #5 (H), and TCR #6 (I). (J and K) %Rank scores (-log) from NetMHCpan 4.1 for QQI (J) and TLL (K) 50-mers. Thresholds for strong binders (SB) and weak binders (WB) are marked. (L to N) Histogram of IL-2 cell surface capture after co-culture of TCR #1- (L), TCR #5- (M), and TCR #6 (N)-expressing T cells with APCs expressing indicated HLA with or without indicated encoded peptides. For each TCR, histogram of HLA alone is overlaid in white. Data are representative of two or three independent experiments.
Fig. 7.
Fig. 7.. Identification of epitopes targeted by orphan, class II-restricted T cell receptors.
(A) Schematic showing sources of TCRβ and TCRα genes, encoded peptides, and HLA II genes used to functionally test HLA-peptide-TCR interactions. (B) Table of TCRβ and TCRα genes screened below, with candidate HLA II. (C and D) Difference between sorted and flow-through cells in percent total read count for each encoded peptide screened with TCR #7 (C) or TCR #10 (D). (E and F) Frequency of z-score measurements from screening data for TCR #7 (E) and TCR #10 (F). Z-scores were calculated from the screening data (left). (G and H) %Rank scores (-log) from NetMHCIIpan 4.0 for HRE (G) and DRK/YKT 50-mers (H). (I and J) Histogram of IL-2 cell surface capture after co-culture of TCR #7- (I) or TCR #10 (J)-expressing T cells with APCs expressing indicated HLA with or without indicated encoded peptides. For each TCR, histogram of HLA alone is overlaid in white. Data are representative of two or three independent experiments.

Similar articles

Cited by

References

    1. International HIV Controllers Study et al., The major genetic determinants of HIV-1 control affect HLA class I peptide presentation. Science. 330, 1551–7 (2010). - PMC - PubMed
    1. Miyadera H, Tokunaga K, Associations of human leukocyte antigens with autoimmune diseases: Challenges in identifying the mechanism. J. Hum. Genet 60, 697–702 (2015). - PubMed
    1. Zaretsky JM et al., Mutations Associated with Acquired Resistance to PD-1 Blockade in Melanoma. N. Engl. J. Med 375, 819–829 (2016). - PMC - PubMed
    1. Chowell D et al., Patient HLA class I genotype influences cancer response to checkpoint blockade immunotherapy. Science. 359, 582–587 (2018). - PMC - PubMed
    1. Latorre D et al., T cells in patients with narcolepsy target self-antigens of hypocretin neurons. Nature. 562, 63–68 (2018). - PubMed

Publication types

MeSH terms