. 2021 Mar 15;81(6):1583-1594.
doi: 10.1158/0008-5472.CAN-20-3477. Epub 2021 Jan 22.

Ferroptosis Inducers Are a Novel Therapeutic Approach for Advanced Prostate Cancer

Affiliations

Ferroptosis Inducers Are a Novel Therapeutic Approach for Advanced Prostate Cancer

Ali Ghoochani et al. Cancer Res. .

Abstract

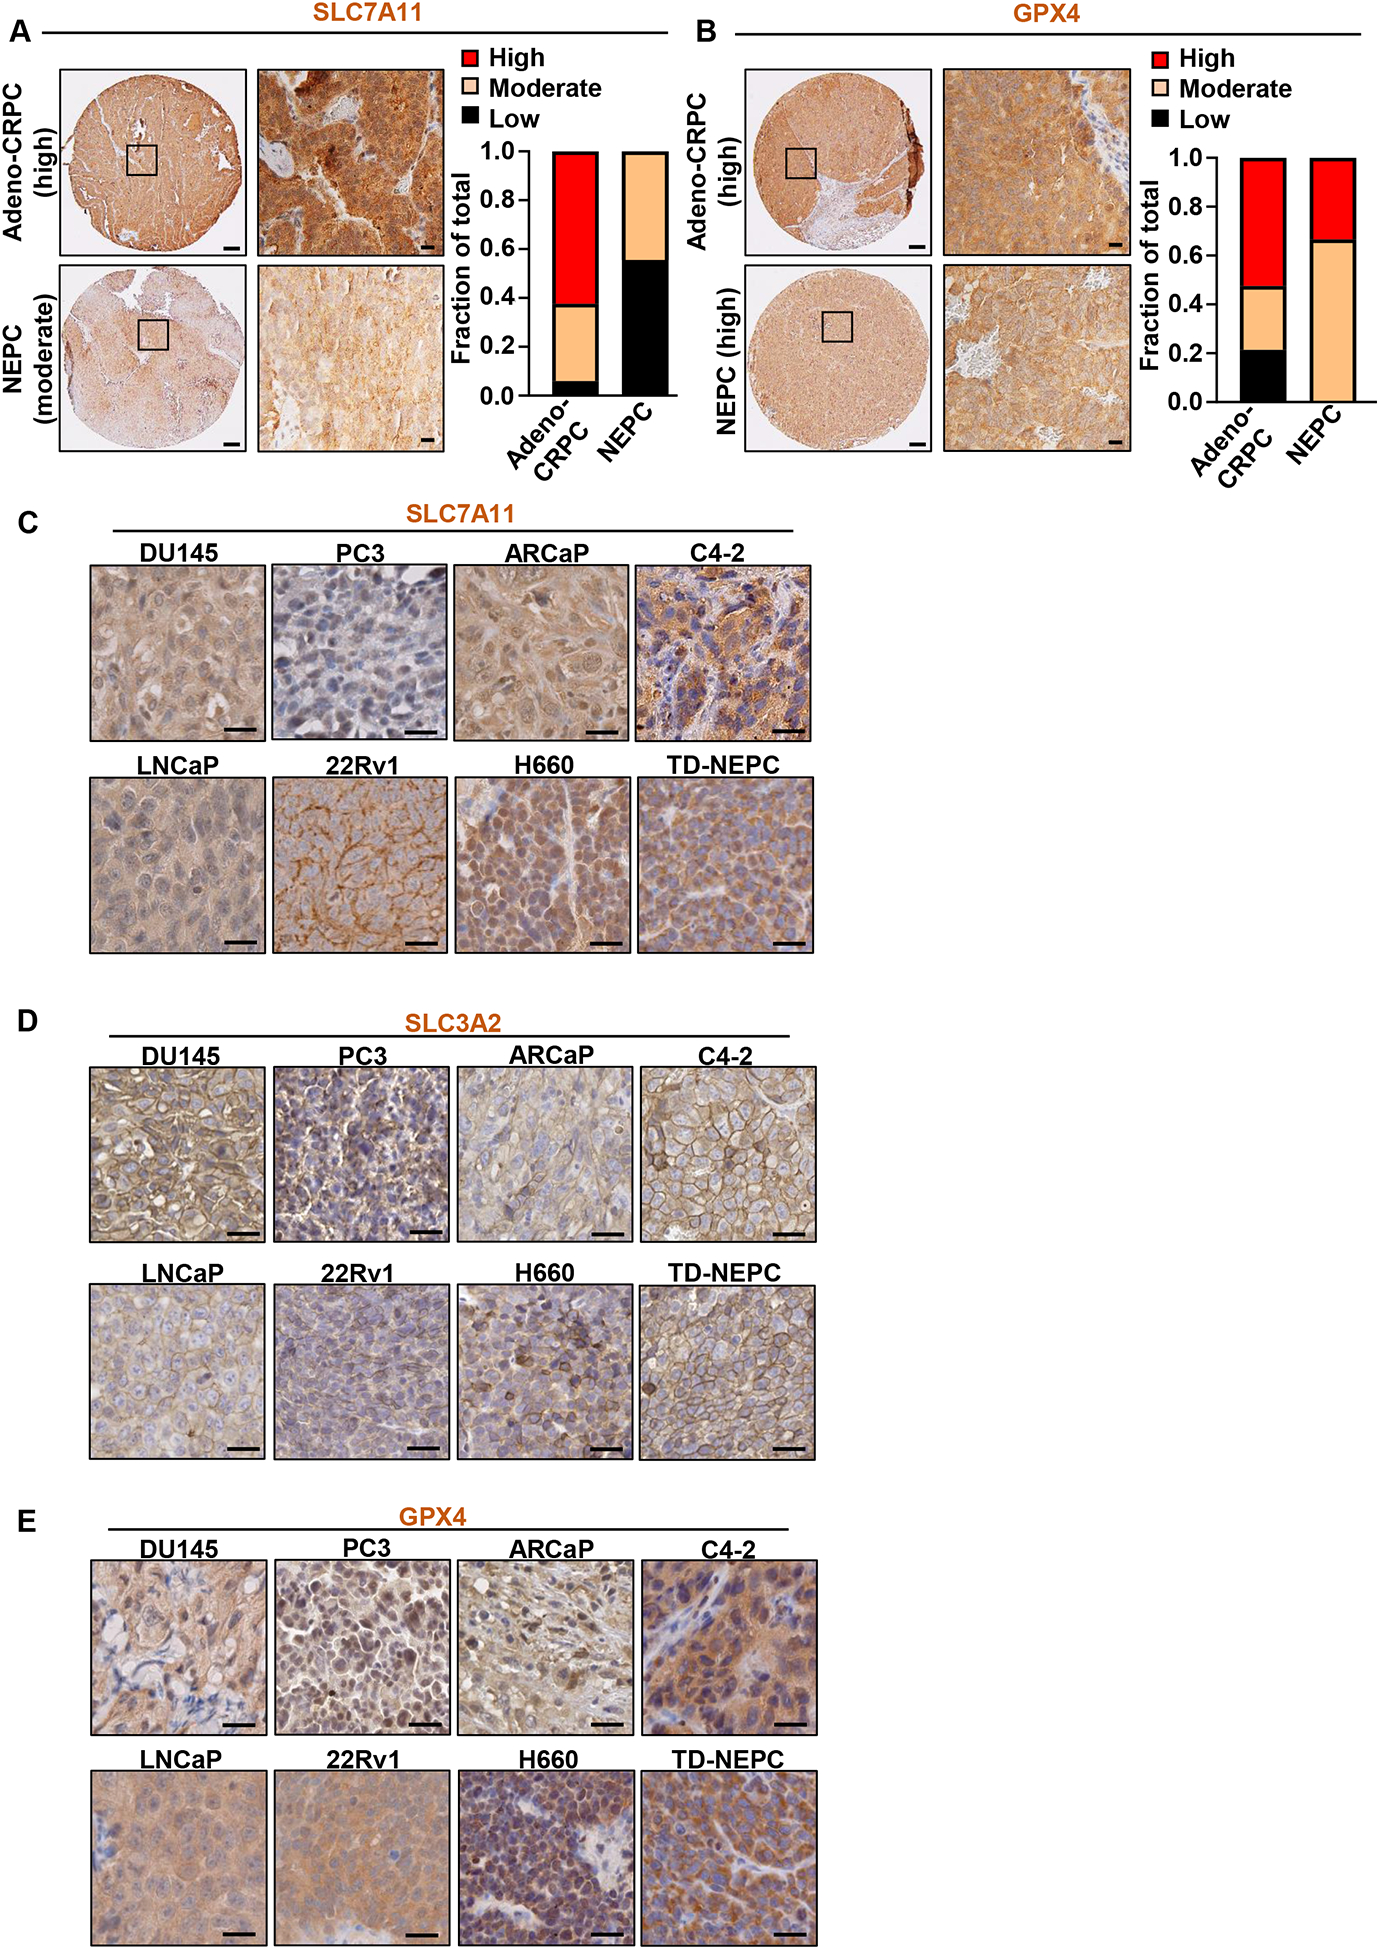
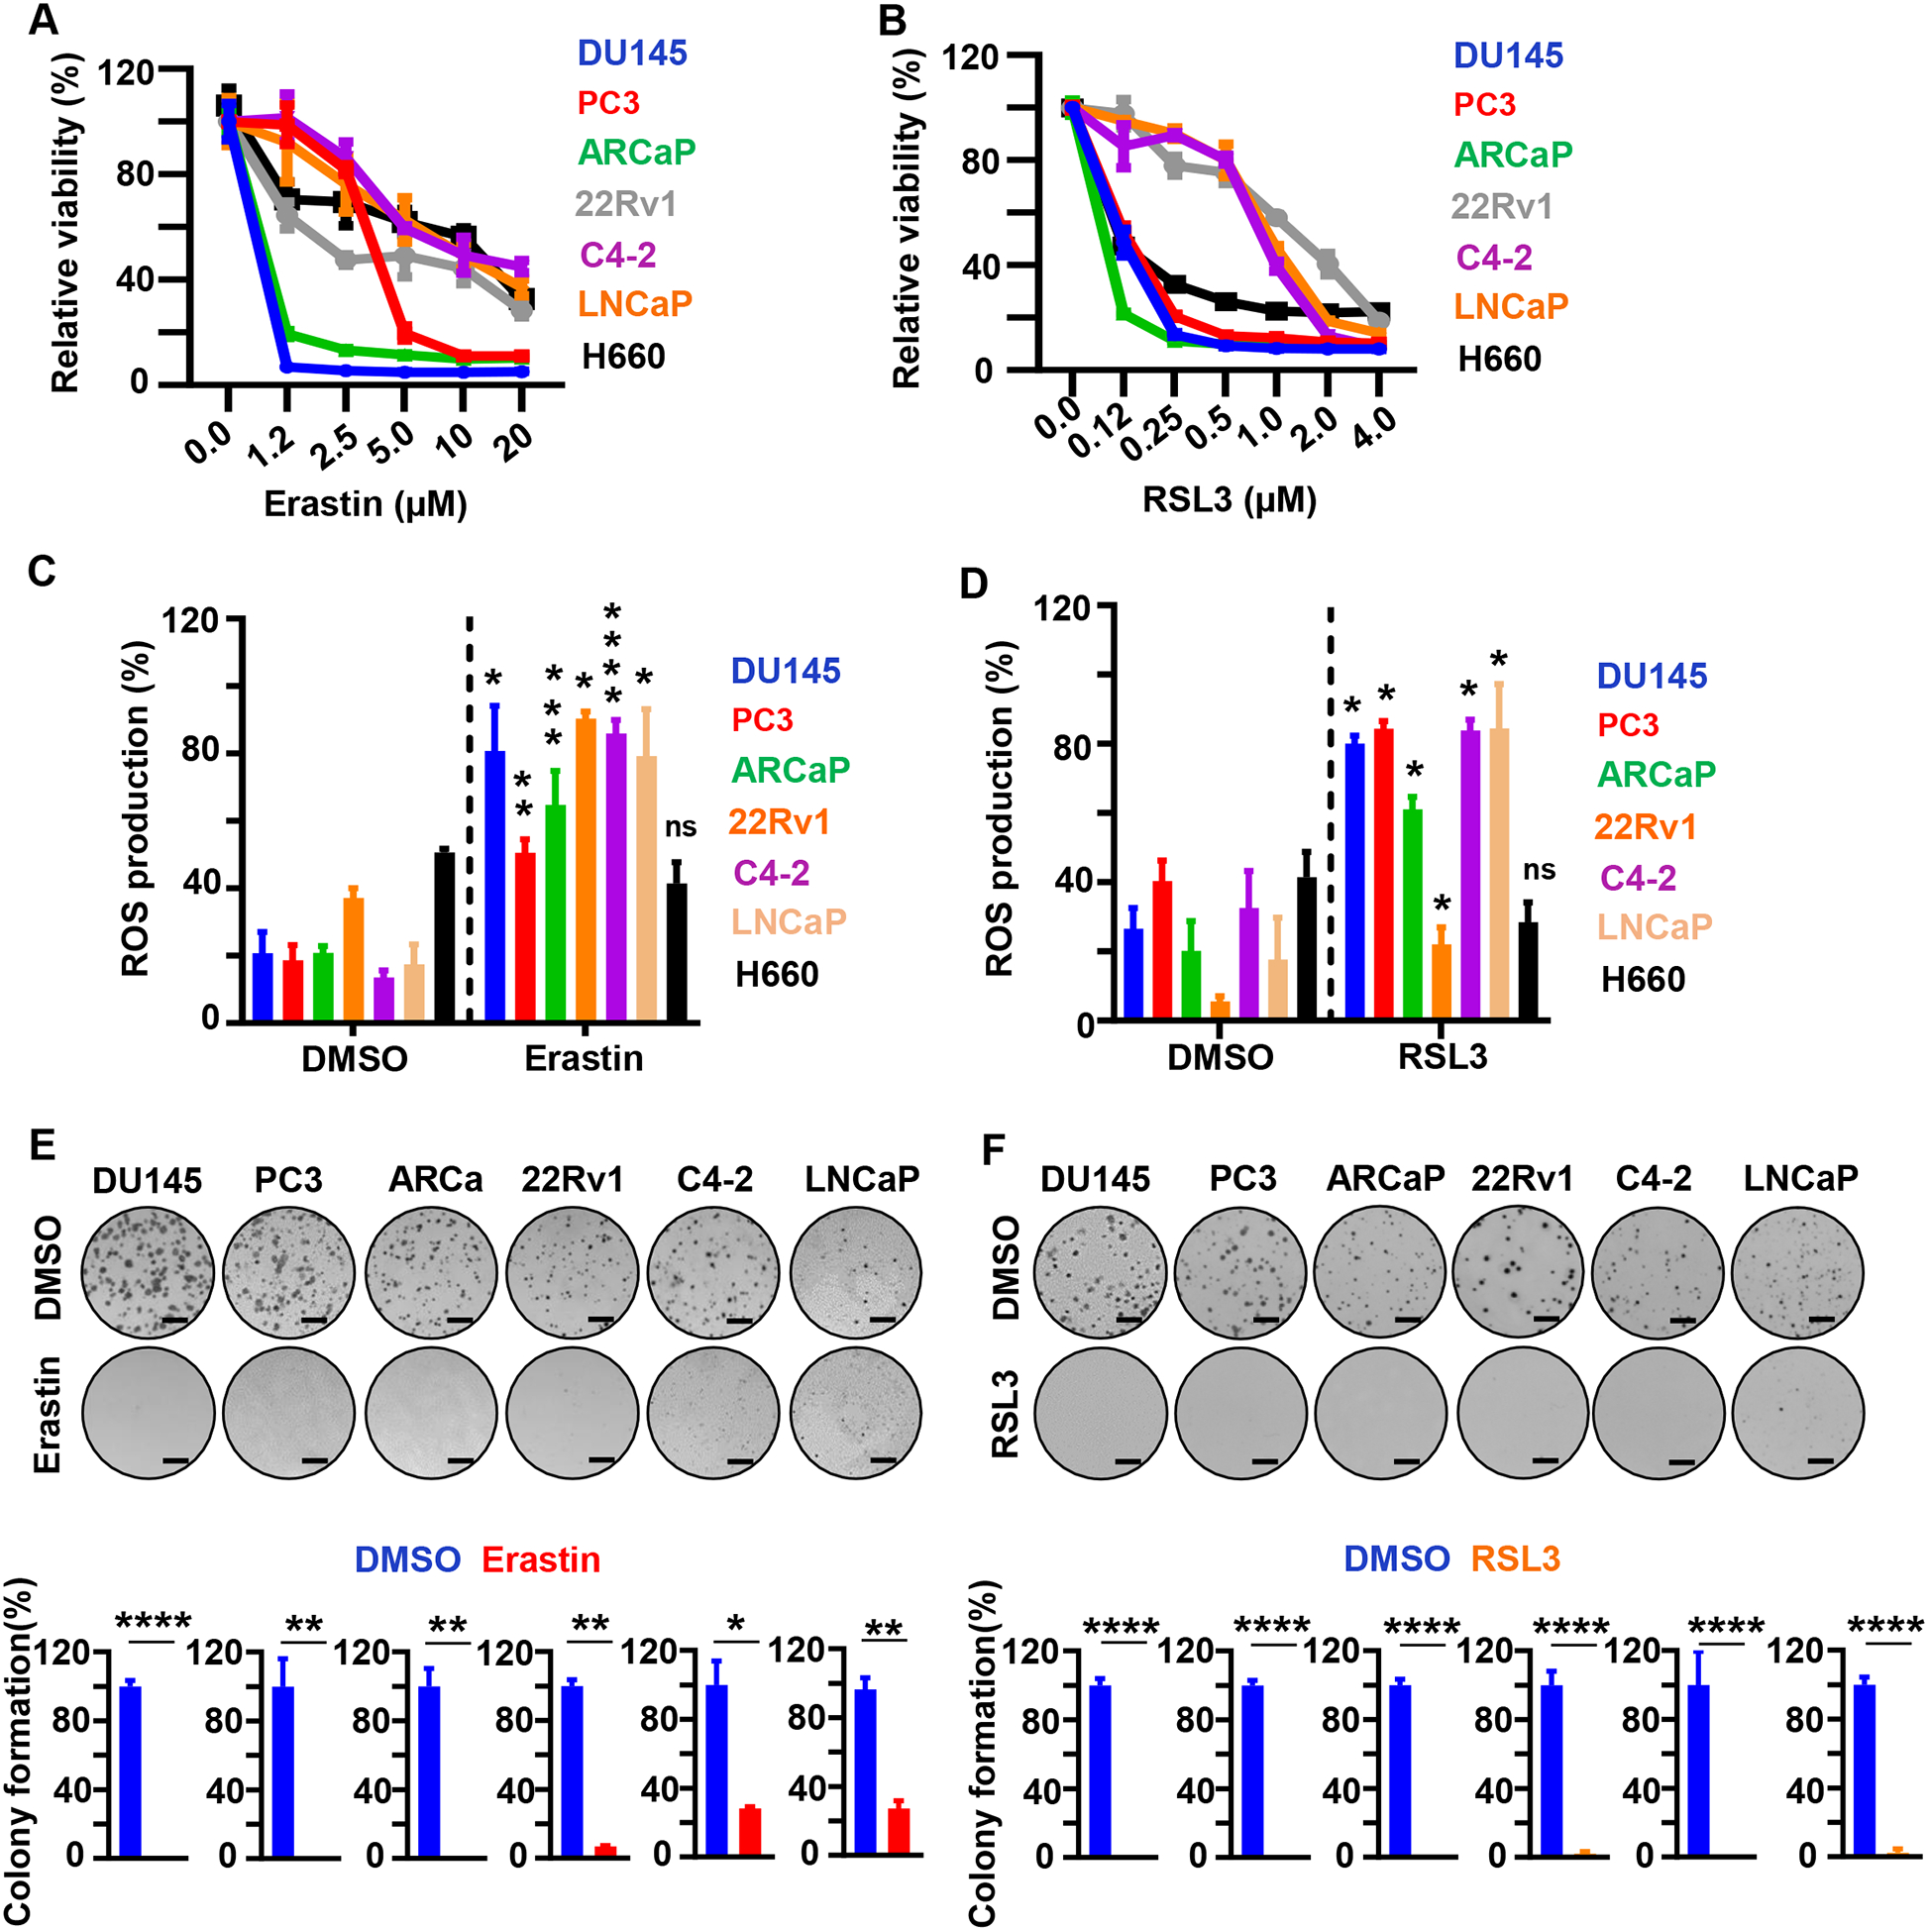
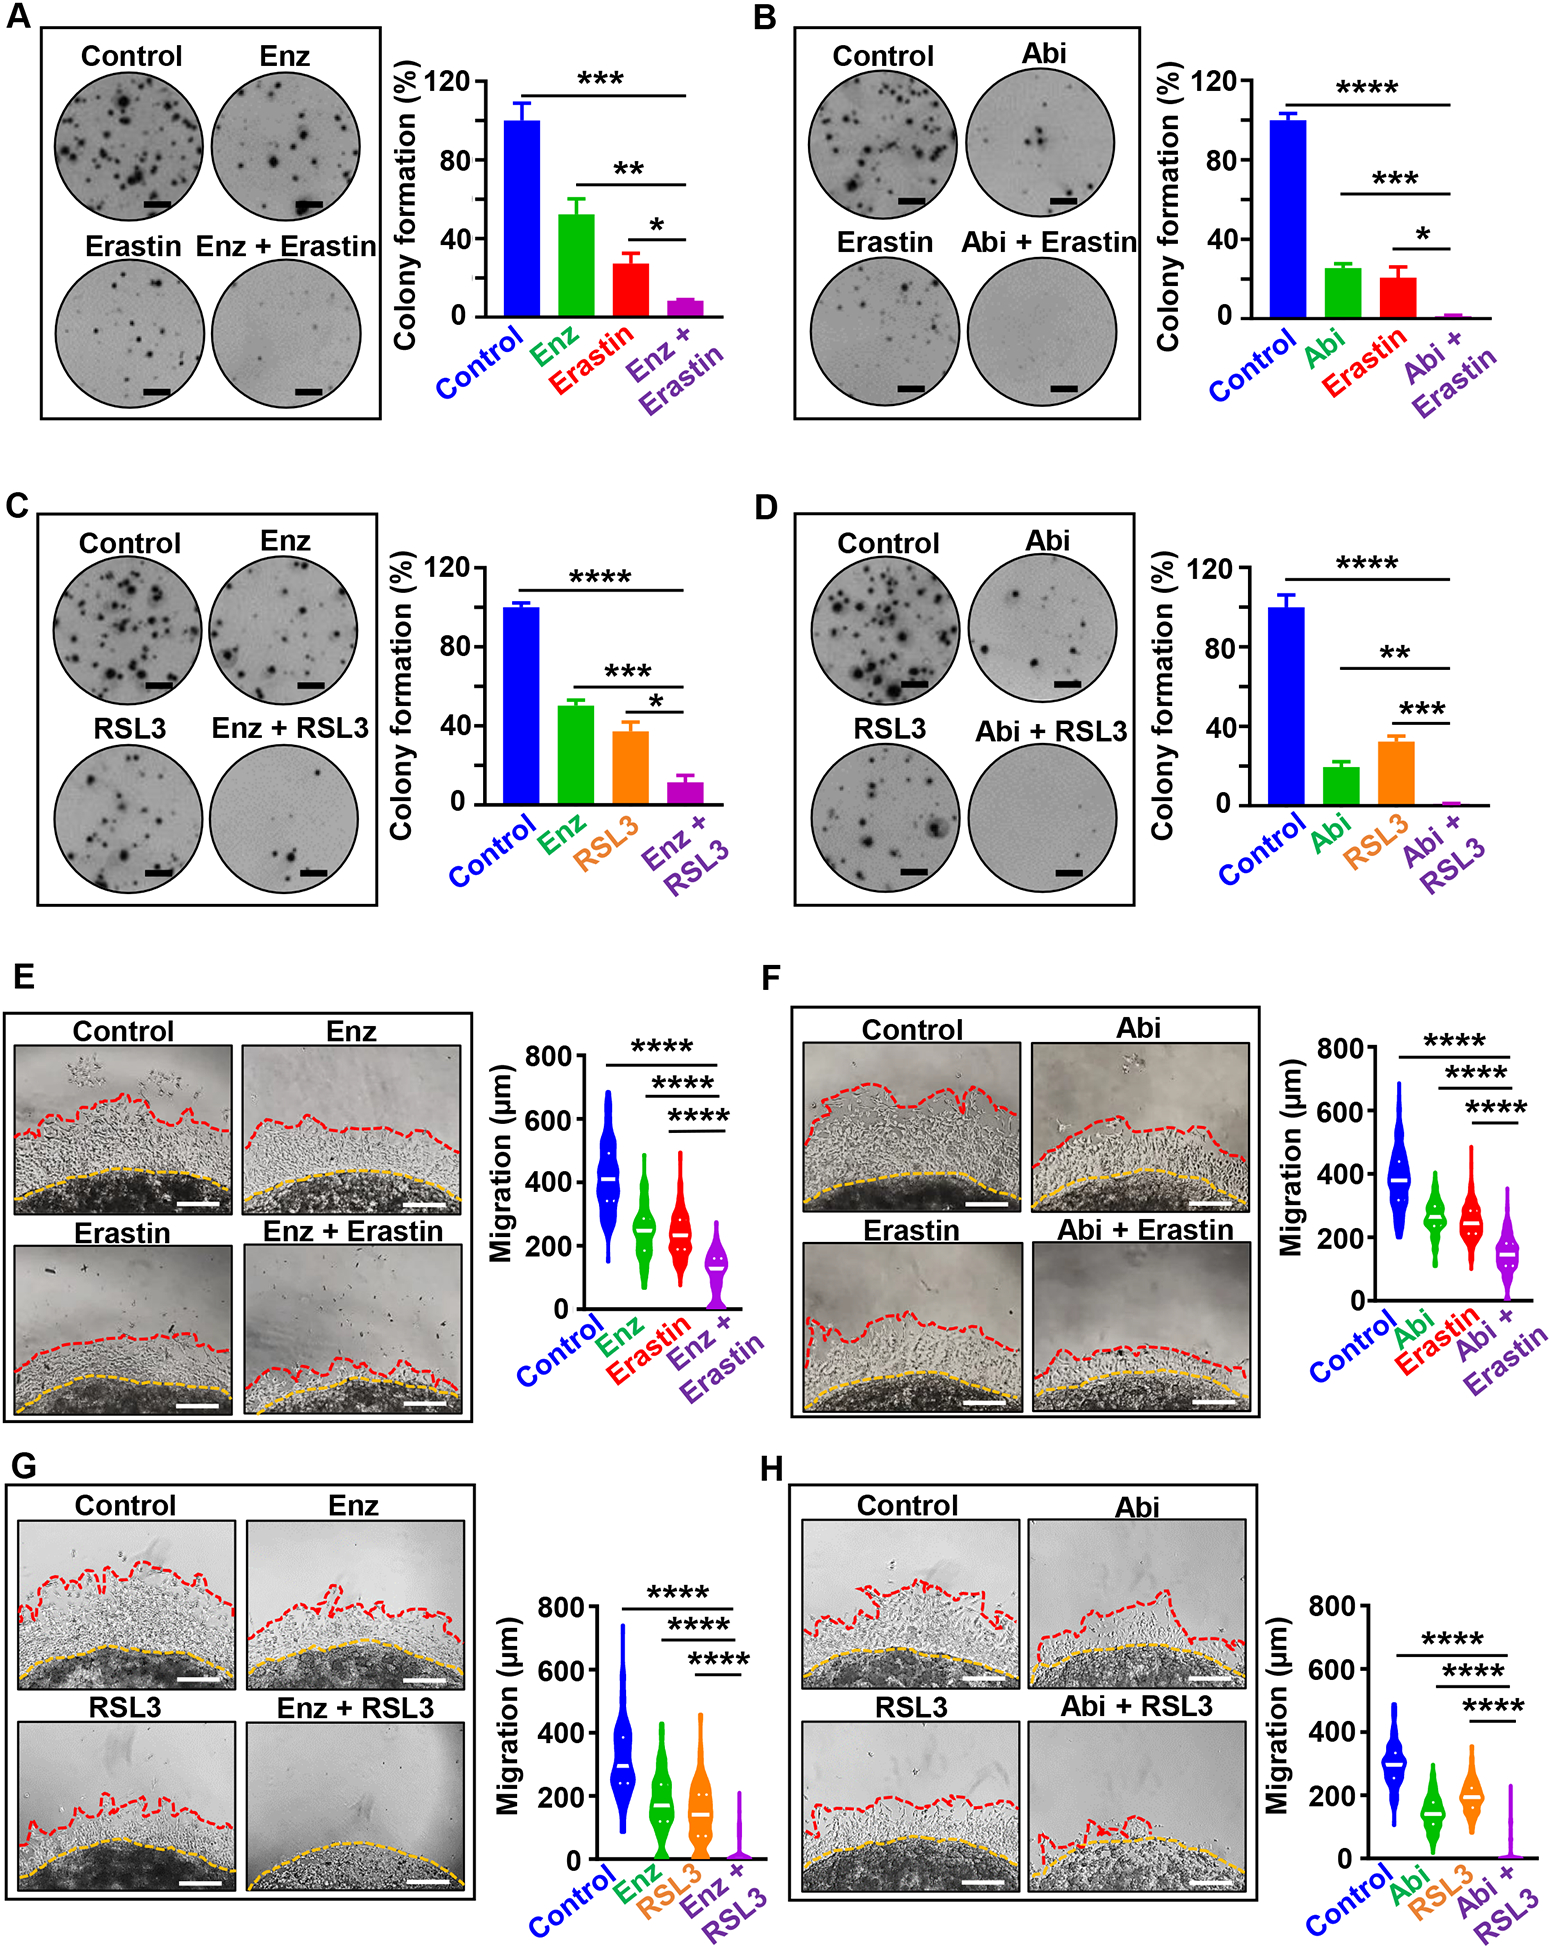
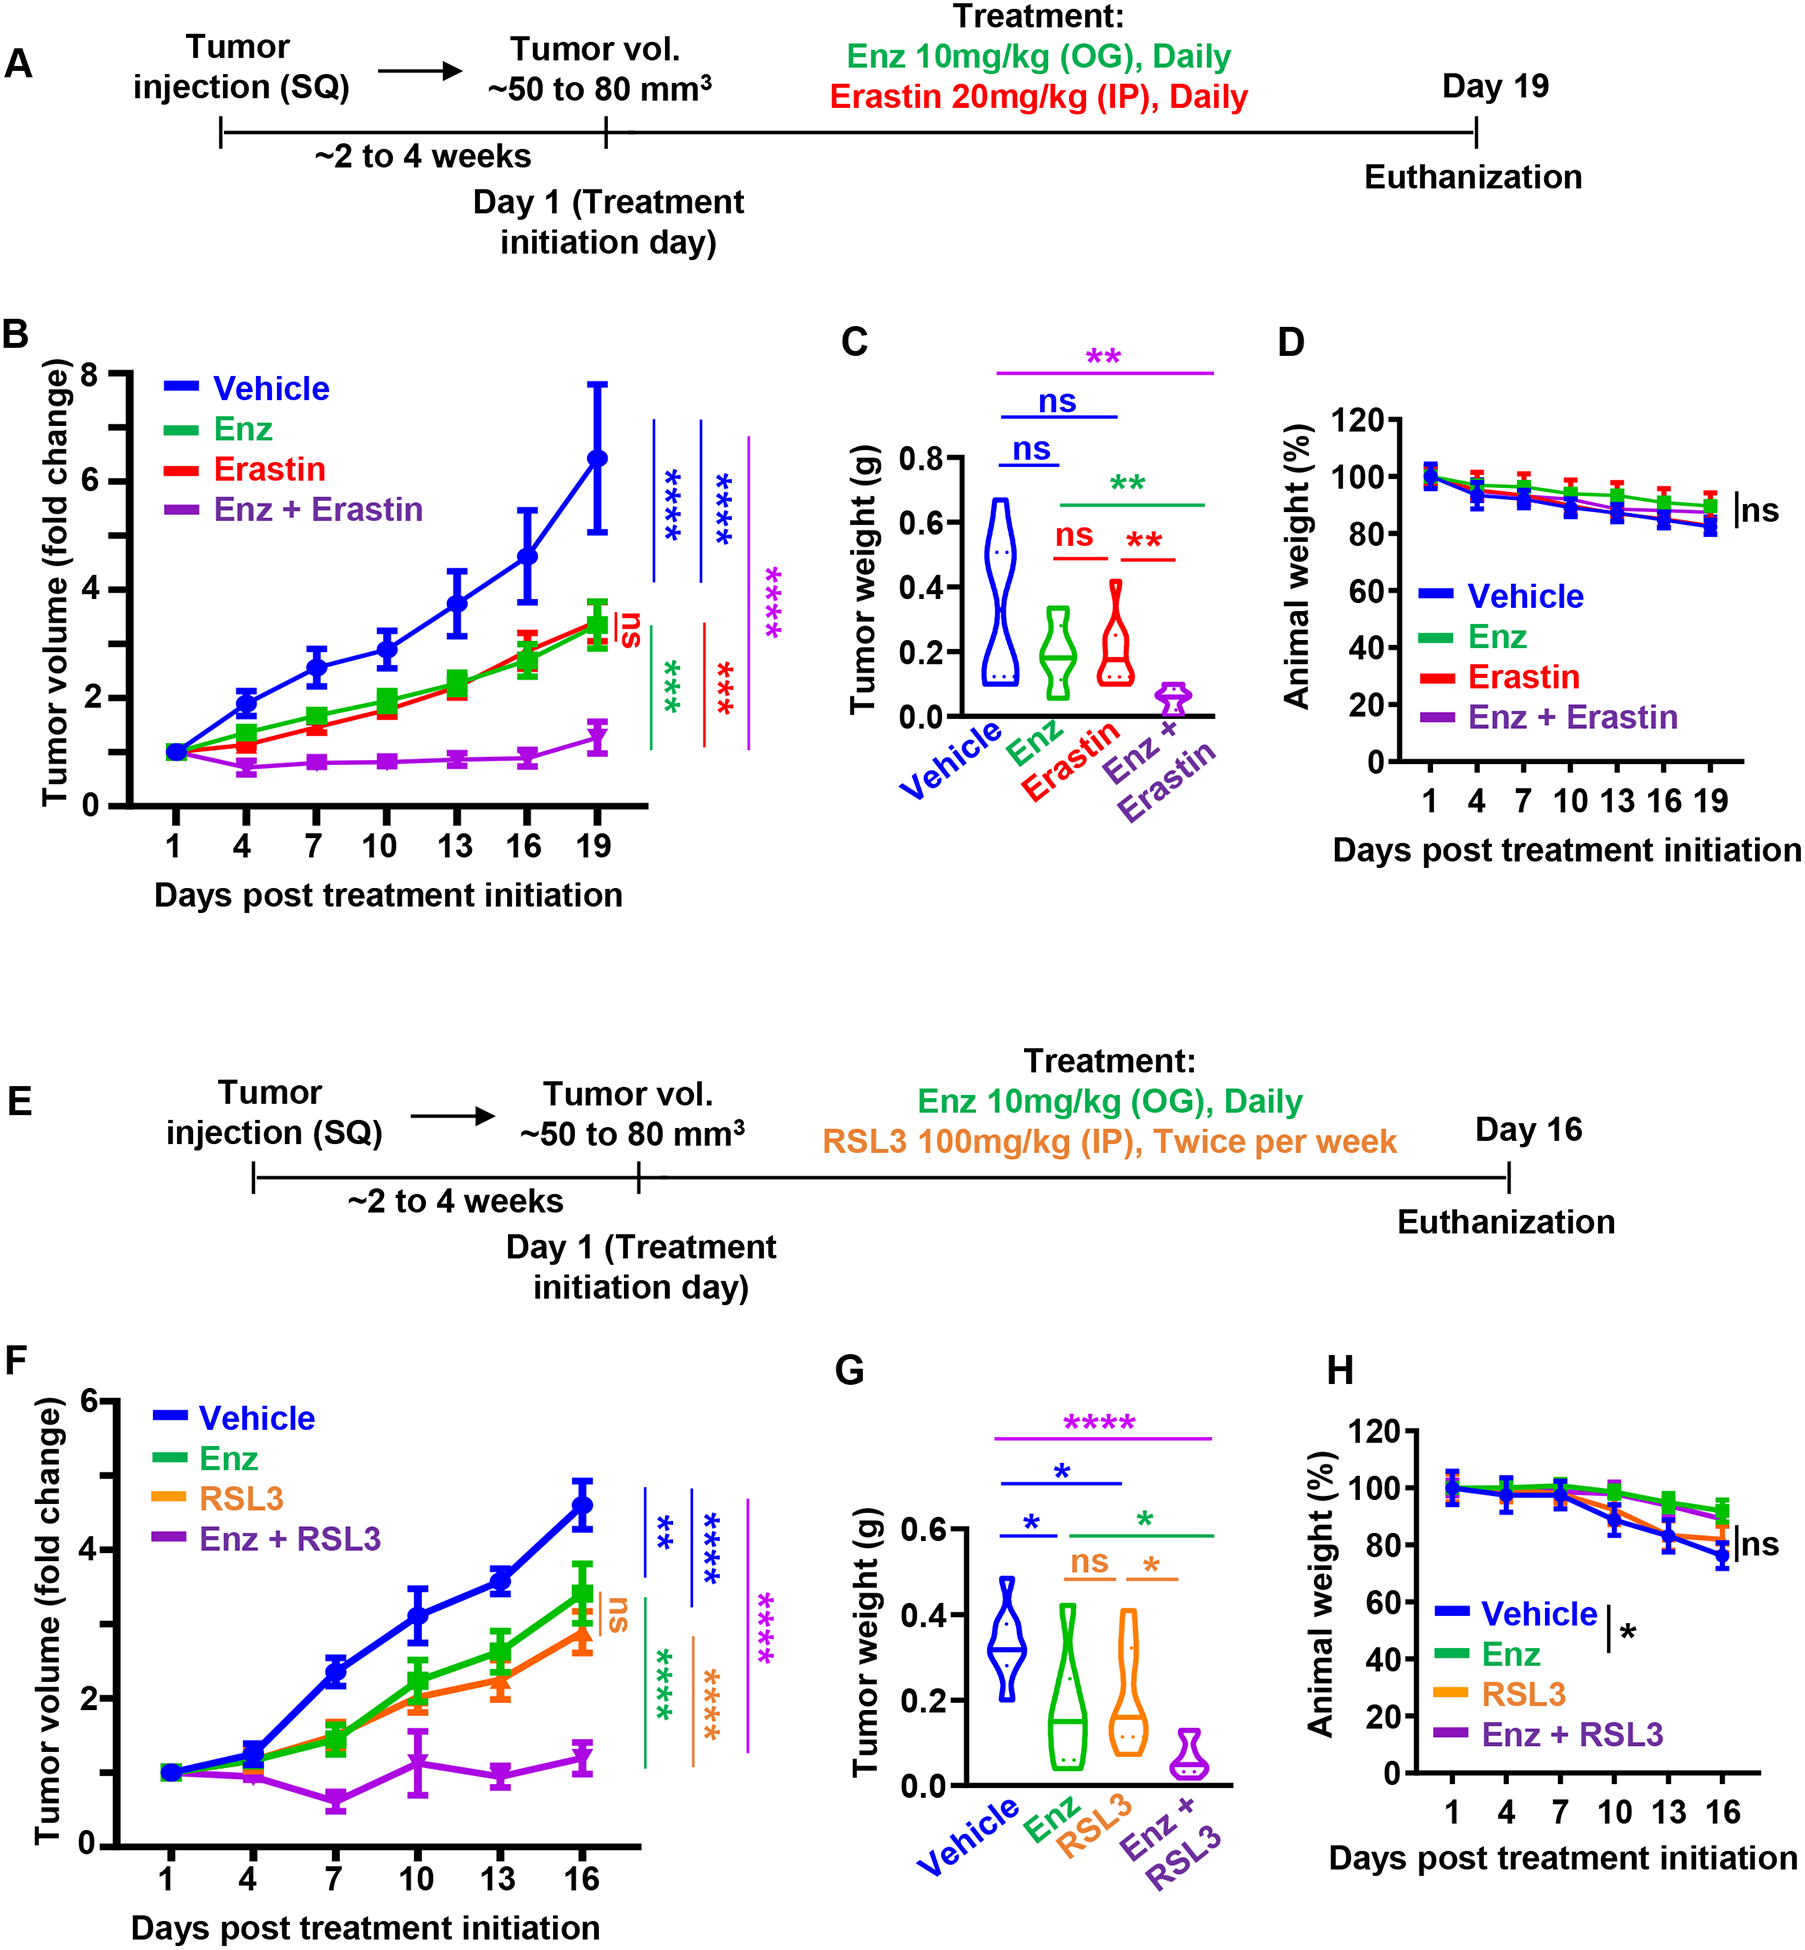
Ferroptosis is a type of programmed cell death induced by the accumulation of lipid peroxidation and lipid reactive oxygen species in cells. It has been recently demonstrated that cancer cells are vulnerable to ferroptosis inducers (FIN). However, the therapeutic potential of FINs in prostate cancer in preclinical settings has not been explored. In this study, we demonstrate that mediators of ferroptosis, solute carrier family 7 member 11, SLC3A2, and glutathione peroxidase, are expressed in treatment-resistant prostate cancer. We further demonstrate that treatment-resistant prostate cancer cells are sensitive to two FINs, erastin and RSL3. Treatment with erastin and RSL3 led to a significant decrease in prostate cancer cell growth and migration in vitro and significantly delayed the tumor growth of treatment-resistant prostate cancer in vivo, with no measurable side effects. Combination of erastin or RSL3 with standard-of-care second-generation antiandrogens for advanced prostate cancer halted prostate cancer cell growth and migration in vitro and tumor growth in vivo. These results demonstrate the potential of erastin or RSL3 independently and in combination with standard-of-care second-generation antiandrogens as novel therapeutic strategies for advanced prostate cancer. SIGNIFICANCE: These findings reveal that induction of ferroptosis is a new therapeutic strategy for advanced prostate cancer as a monotherapy and in combination with second-generation antiandrogens.


Conflict of interest statement

Conflicts of interest:

The authors declare no competing interests.

Figures

Figure 1.
Figure 1.. SLC7A11, SLC3A2 and GPX4 are expressed in advanced prostate cancer.
(A, B) IHC staining of SLC7A11 (A) and GPX4 (B) in previously described PDX TMAs TD-NEPC (52). LuCaP PDX TMAs contained 3 sample cores per PDX from adeno-CRPC (PDX n=36, sample n=108 or n=35, sample n=105) and NEPC PDXs (PDX n=3, sample n=9). Cores with insufficient tissue were excluded from the analyses. Intensities of IHC staining for SLC7A11 and GPX4 were blind scored as low, moderate, and high as shown in Supplementary Figure S1A and S1B and plotted. Scale bars represent 200 μm and 20 μm respectively. (C, D, E) IHC staining of SLC7A11 (C) SLC3A2 (D) and GPX4 (E) on different cell line-derived prostate cancer xenografts including DU145, PC3, ARCaP, C4-2, LNCaP, 22Rv1, H660, and previously described TD-NEPC (Trop2-driven NEPC) (49) Scale bars represent 20 μm.
Figure 2.
Figure 2.. Erastin and RSL3 induce ROS and inhibit prostate cancer cell growth in vitro.
(A, B). Viability (%) of prostate cancer cell lines (DU145, PC3, ARCaP, 22RV1, C4-2, LNCaP and H660) following erastin (0, 1.25, 2.5, 5, 10, and 20 μM) (A) or RSL3 (0, 0.125, 0.25, 0.5, 1.0, 2.0, and 4.0 μM) (B) treatment for 72 hours. Experiments were repeated twice independently to verify the reproducibility of the data. Representative experiments are shown. (C, D) ROS measurement by flow cytometry. Cells were treated with erastin (5 μM) (C) or RSL3 (1 μM) (D) for 6 hours followed by incubation with H2DCF for 20 min at 37°C. Relative fluorescence was normalized to untreated control cells and represented as relative percentage of ROS production. Experiments were performed in triplicate and shown. (E, F) Colony formation assay. Prostate cancer cells were grown for nine days in presence of erastin (5 μM) (E) or RSL3 (500 nM) (F). Representative experiments and images are shown. Media containing the indicated compounds was changed every three days. Three independent experiments were performed with triplicate wells. Representative experiments and images are shown. Scale bars represent 4 mm. * P<0.05, **P<0.01, *** P<0.001, **** P<0.0001, ns-no significance, Student’s t-test. Error bars represent mean ± SEM.
Figure 3.
Figure 3.. Erastin and RSL3 inhibit prostate cancer cell invasion and migration in vitro.
(A-D) 3D Matrigel drop invasion assay for DU145, PC3 and C4-2 cells upon erastin (A, B) or RSL3 (C, D) treatment. DU145 and PC3 matrigel drops were treated with erastin (1.25 μM) or RSL3 (125 nM). C4-2 matrigel drops were treated with higher doses of erastin (5 μM) or RSL3 (500 nM) because of their sensitivity to the compounds at higher doses on viability assay (Figure 2A and B). Media and treatments were exchanged every three days for six days incubation. The distances of migrated cells away from edge of the matrigel drop were measured as migration (μm) on Day 6. Experiments were performed in duplicate with triplicate wells. Representative experiments and images are shown. Scale bars represent 200 μm. (E-F) Migration assay for DU145 and PC3 cells. Cells were pretreated with erastin (1.25 μM) or RSL3 (125 nM) for 48 hours. Then, 5×10⁴ viable cells were plated into transwell chambers for 20 hours upon erastin (1.25 μM) or RSL3 (125 nM) treatment, then fixed and stained with methanol and 0.01% crystal violet solution. Scale bar=1 mm. Experiments were performed in duplicate with two wells for each condition. Representative experiments and images are shown. For all experiments, DMSO was used as a vehicle control. For treated cells, the relative percentage of migrated cells was calculated relative to the DMSO treated control. Statistical analysis was performed with Student’s t-test (* P<0.05, **P<0.01, *** P<0.001, **** P<0.0001, ns-no significance) and error bars represent mean ± SEM.
Figure 4.
Figure 4.. Treatment with erastin and RSL3 delays prostate cancer growth in vivo.
(A) Schematic diagram of experimental design using erastin treatment. 5×10⁵ DU145, ARCaP or PC3 (5×10⁵) and NCI-H660 (1×10⁶) cells were mixed in 50 μl of 80% matrigel and implanted subcutaneously (sc) into the flanks of male NSG mice. When tumors averaged 50 to 80 mm3, mice were randomized into vehicle or erastin treatment (20 mg/kg, IP, daily) groups. (B) DU145, ARCaP, PC3, and H660 tumors volumes were measured by caliper (1/2 × (Length × Width × Height)) every three days and presented as fold change over the tumor volume at Day 1. (C) Tumor weights (g) were measured following tumor excision at the experimental end point and graphed as violin plots. (D) Schematic diagram of experimental design upon RSL3 treatment. (E) DU145 and PC3 (5×10⁵) cells were mixed in 80% Matrigel and implanted subcutaneously into flank of NSG male mice. Once the average of tumor volume reached to 50 to 80 mm3, mice were randomized into vehicle or RSL3 treatment (100 mg/kg, IP, biweekly) groups. Tumor volumes (1/2 (Length × Width × Height)) were measured every third day and shown as fold change over Day 1 tumor volume. (F) Tumor weights (g) were measured at the experimental end point. Statistical analysis was performed with Student’s t-test at each time point (* P<0.05, **P<0.01, *** P<0.001, and **** P<0.0001). Error bars signify mean ± SEM.
Figure 5.
Figure 5.. Combination of erastin or RSL3 with second generation anti-androgens, enzalutamide and abiraterone, inhibits prostate cancer cell growth and invasion in vitro.
(A-D) Colony formation assay. (A, B) C4-2 cells were grown for nine days in presence of erastin (2 μM), enzalutamide (2 μM), abiraterone acetate (2 μM), erastin plus enzalutamide, and erastin plus abiraterone acetate. Media containing the compounds was exchanged every three days. Colonies were then fixed in methanol and stained with crystal violet. After washing and drying plates, plates were scanned on Celigo Imaging Cytometer (Nexcelom Bioscience) and the percentage of the well covered by colonies was quantified in ImageJ. (C, D) Colony formation assay for C4-2 cells upon treatment with RSL3 (50 nM), enzalutamide (2 μM), abiraterone acetate (2 μM), RSL3 plus enzalutamide, and RSL3 plus abiraterone acetate for nine days. Three independent experiments were performed with triplicate wells. Representative experiments and images are shown. Scale bars represent 4 mm. (E-H) 3D Matrigel drop invasion assay. (E, F) C4-2 cells were plated in matrigel drop invasion assay and treated with erastin (5 μM), enzalutamide (5 μM), abiraterone acetate (5 μM), erastin plus enzalutamide, and erastin plus abiraterone acetate (G, H) C4-2 prostate cancer cells were plated in matrigel drop invasion assay and treated with RSL3 (500 nM), enzalutamide (5 μM), abiraterone acetate (5 μM), RSL3 plus enzalutamide, and RSL3 plus abiraterone acetate. Media and treatment were exchanged every three days for six days. Radial migration distance (μm) was measured on Day 6. Experiments were performed in duplicate with triplicate wells. Statistical analysis was performed with Student’s t-test (* P< 0.05, **P<0.01, *** P < 0.001, **** P<0.0001, ns-no significance) and error bars represent mean ± SEM.
Figure 6.
Figure 6.. Combination of erastin or RSL3 with second generation anti-androgens, enzalutamide and abiraterone, inhibits prostate cancer xenograft growth in vivo.
(A) Schematic diagram of prostate cancer xenograft models upon treatment with erastin (20 mg/kg, IP, daily) and enzalutamide (10 mg/kg, oral gavage, daily). (B) 5×10⁵ C4-2 cells mixed with 80% Matrigel, were implanted bilaterally subcutaneously into the flanks of male NSG mice. Once the average of tumors volume reached to 50 to 80 mm3, mice were randomized into vehicle (n=6), erastin (n=6), enzalutamide (n=6), and erastin plus enzalutamide (n=6) treatment groups. Tumor volumes (1/2 (Length × Width × Height) were measured every third day and represented as fold change over tumor volume at Day 1. (C) Tumor weights (g) were measured after tissue resection at experimental end point. (D) Animal weights were measured every three days upon erastin and enzalutamide combination treatment and plotted. (E) Schematic diagram of prostate cancer xenograft models upon RSL3 (100 mg/kg, IP, twice per week) and enzalutamide (10 mg/kg, oral gavage, daily) treatments. (F) 5×10⁵ C4-2 cells mixed with 80% matrigel, were implanted bilaterally subcutaneously into the flanks of NSG male mice. Mice with tumors with average volume of 50 to 80 mm3, were randomized into vehicle (n=7), RSL3 (n=5), enzalutamide (n=5), and RSL3 plus enzalutamide (n=5) treatment groups. Tumor volumes (1/2 × Length × Width × Height) were measured every 3 days and are shown as fold change when compared to Day 1. (G) Tumor weights (g) at experimental end point are shown. (H) Animal weights were measured every 3 days over the treatment course and plotted. Statistical analysis was performed with Student’s t-test (* P<0.05, **P<0.01, *** P<0.001, and **** P<0.0001) and error bars represent mean ± SEM.

References

    1. Siegel RL, Miller KD, Jemal A, Cancer statistics, 2020. CA: A Cancer Journal for Clinicians 2020; 70: 7–30. - PubMed
    1. Denis LJ, Griffiths K, Endocrine treatment in prostate cancer. Seminars in Surgical Oncology 2000; 18: 52–74. - PubMed
    1. Sharifi N, Dahut WL, Steinberg SM, Figg WD, Tarassoff C, Arlen P et al., A retrospective study of the time to clinical endpoints for advanced prostate cancer. BJU International 2005; 96: 985–989. - PubMed
    1. Fizazi K, Shore N, Tammela TL, Ulys A, Vjaters E, Polyakov S et al., Darolutamide in Nonmetastatic, Castration-Resistant Prostate Cancer. New England Journal of Medicine 2019; 380: 1235–1246. - PubMed
    1. Scher HI, Fizazi K, Saad F, Taplin ME, Sternberg CN, Miller K et al., Increased survival with enzalutamide in prostate cancer after chemotherapy. N Engl J Med 2012; 367: 1187–1197. - PubMed

Publication types

MeSH terms