. 2021 Apr 1;81(7):1896-1908.
doi: 10.1158/0008-5472.CAN-20-1641. Epub 2021 Jan 22.

MYCN-Amplified Neuroblastoma Is Addicted to Iron and Vulnerable to Inhibition of the System Xc-/Glutathione Axis

Affiliations

MYCN-Amplified Neuroblastoma Is Addicted to Iron and Vulnerable to Inhibition of the System Xc-/Glutathione Axis

Konstantinos V Floros et al. Cancer Res. .

Abstract

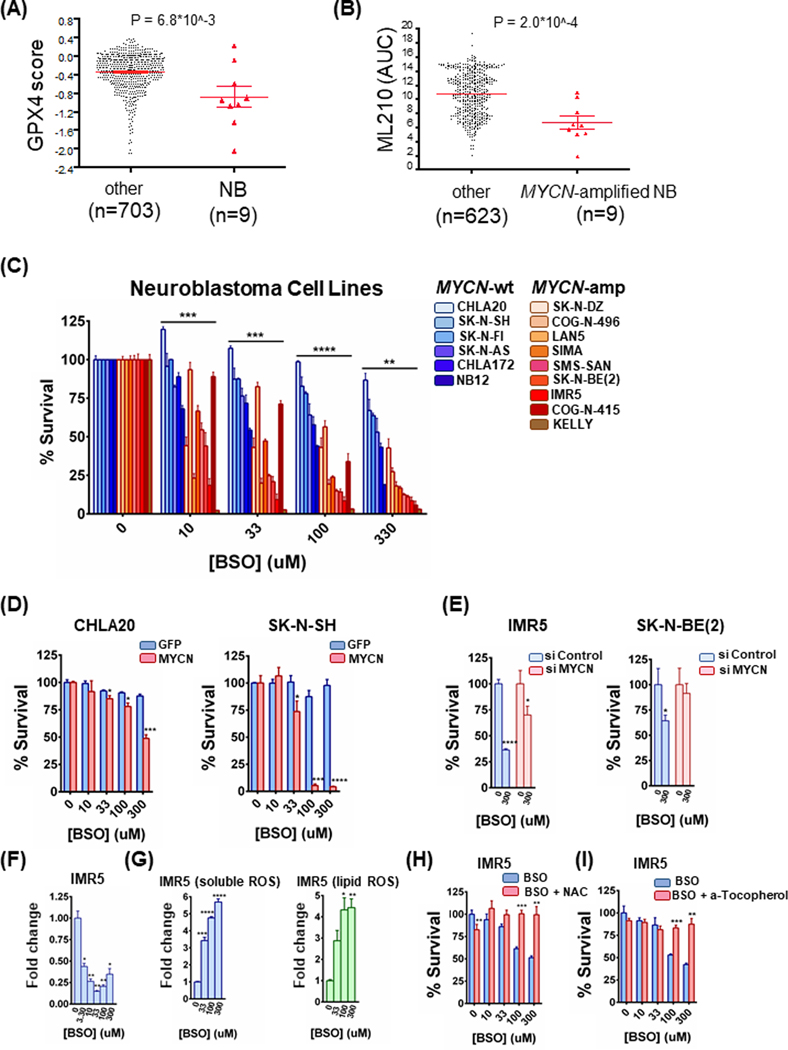
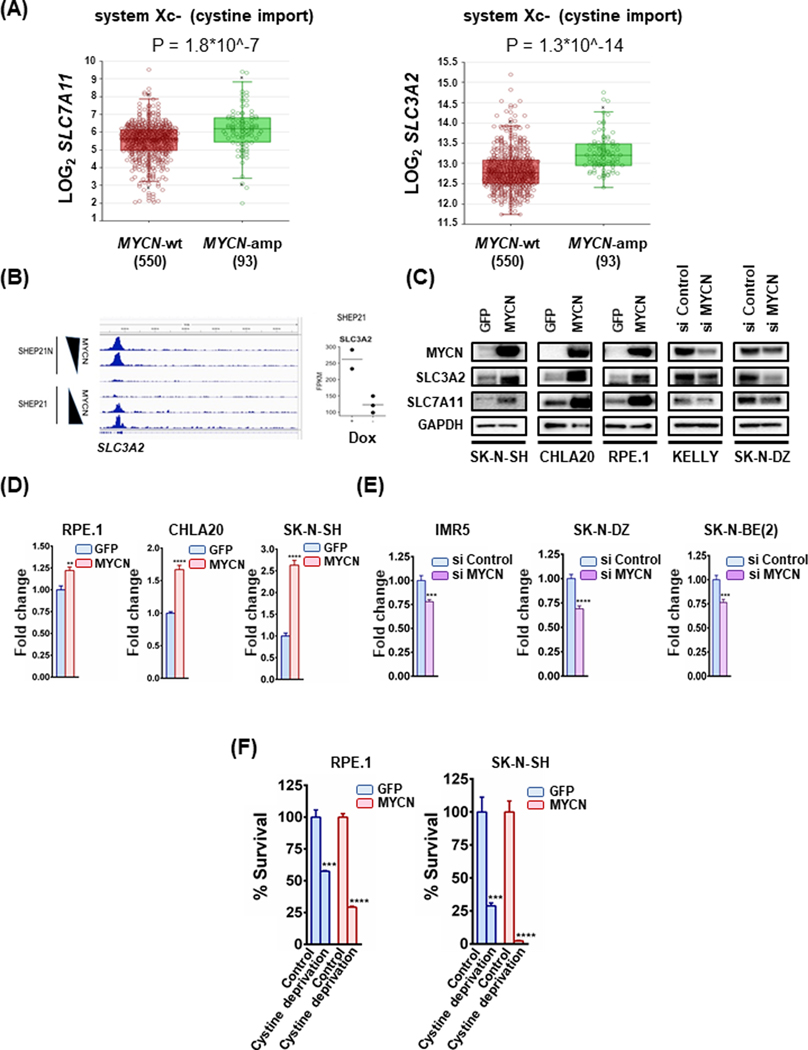
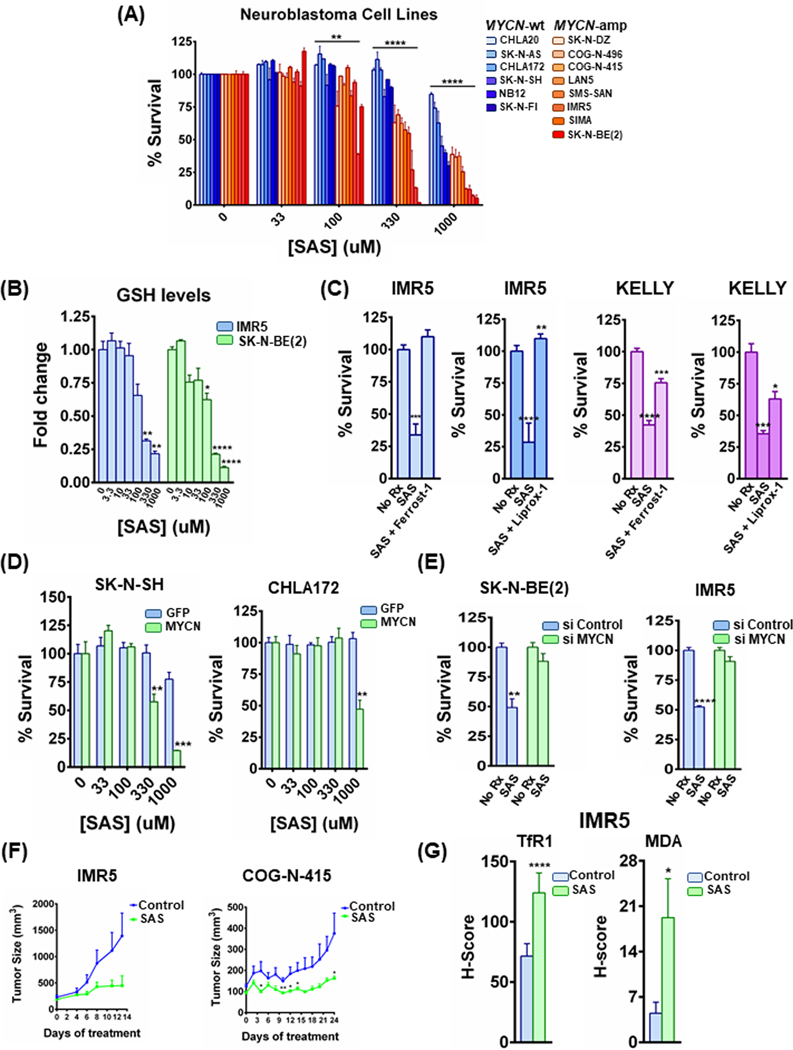
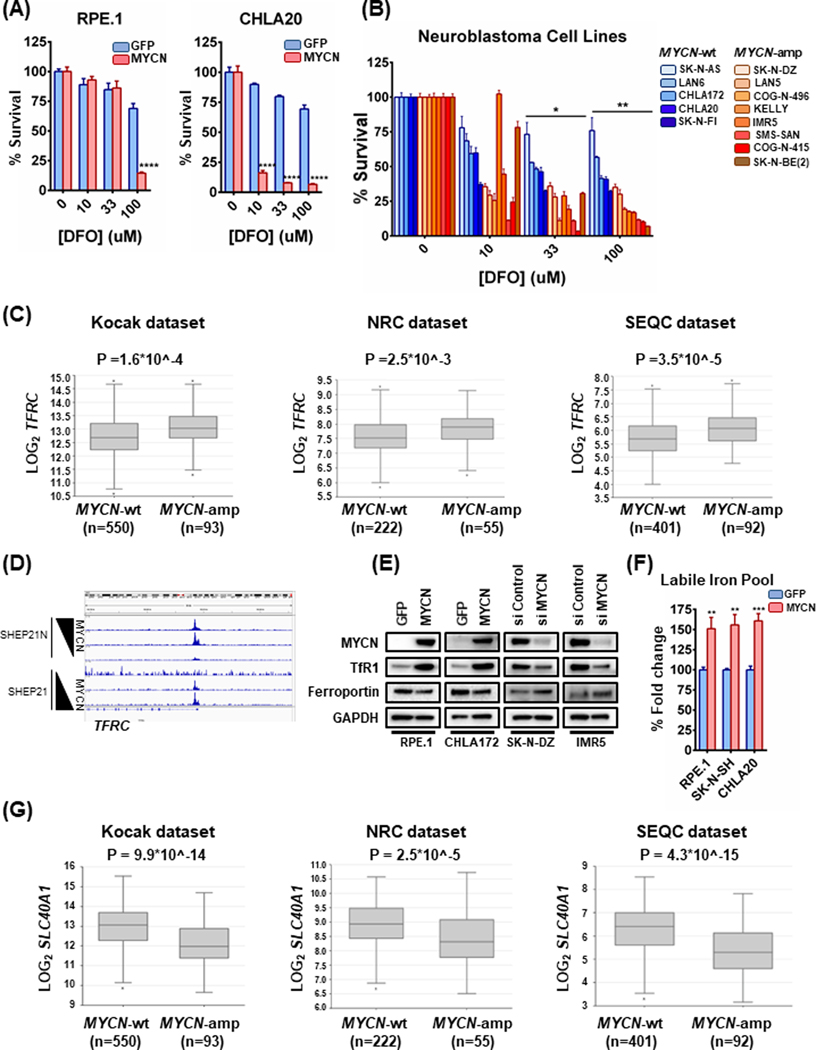
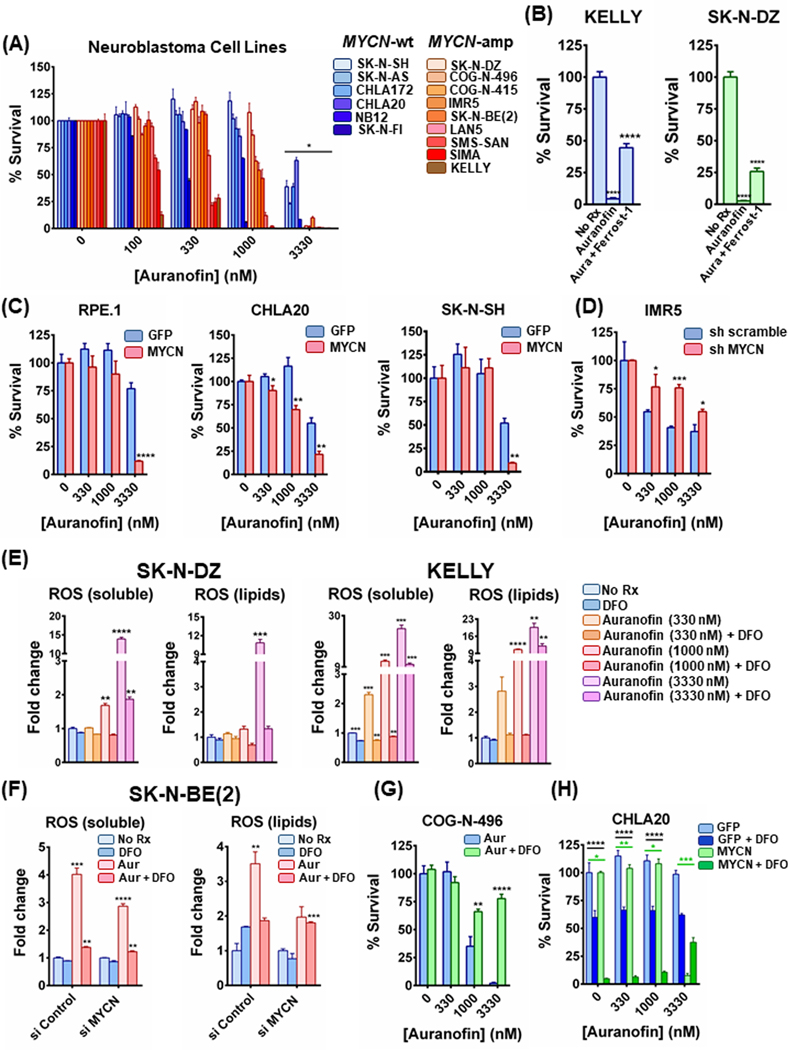
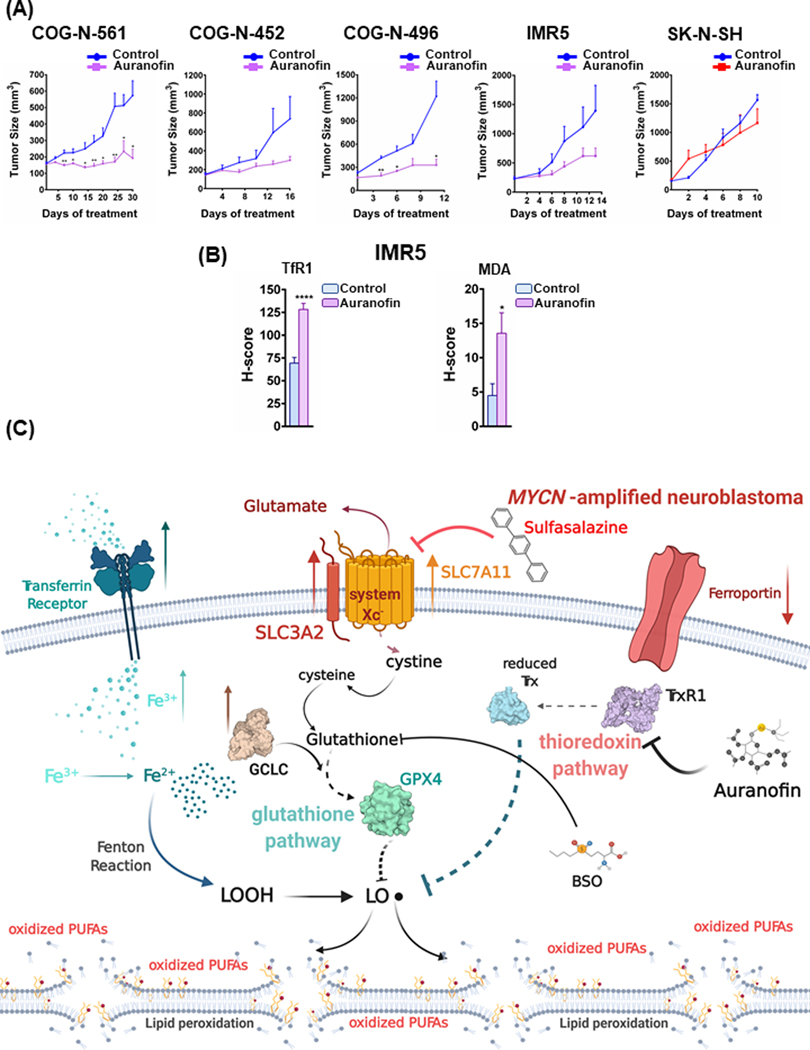
MYCN is amplified in 20% to 25% of neuroblastoma, and MYCN-amplified neuroblastoma contributes to a large percent of pediatric cancer-related deaths. Therapy improvements for this subtype of cancer are a high priority. Here we uncover a MYCN-dependent therapeutic vulnerability in neuroblastoma. Namely, amplified MYCN rewires the cell through expression of key receptors, ultimately enhancing iron influx through increased expression of the iron import transferrin receptor 1. Accumulating iron causes reactive oxygen species (ROS) production, and MYCN-amplified neuroblastomas show enhanced reliance on the system Xc- cystine/glutamate antiporter for ROS detoxification through increased transcription of this receptor. This dependence creates a marked vulnerability to targeting the system Xc-/glutathione (GSH) pathway with ferroptosis inducers. This reliance can be exploited through therapy with FDA-approved rheumatoid arthritis drugs sulfasalazine (SAS) and auranofin: in MYCN-amplified, patient-derived xenograft models, both therapies blocked growth and induced ferroptosis. SAS and auranofin activity was largely mitigated by the ferroptosis inhibitor ferrostatin-1, antioxidants like N-acetyl-L-cysteine, or by the iron scavenger deferoxamine (DFO). DFO reduced auranofin-induced ROS, further linking increased iron capture in MYCN-amplified neuroblastoma to a therapeutic vulnerability to ROS-inducing drugs. These data uncover an oncogene vulnerability to ferroptosis caused by increased iron accumulation and subsequent reliance on the system Xc-/GSH pathway. SIGNIFICANCE: This study shows how MYCN increases intracellular iron levels and subsequent GSH pathway activity and demonstrates the antitumor activity of FDA-approved SAS and auranofin in patient-derived xenograft models of MYCN-amplified neuroblastoma.


Conflict of interest statement

Conflict of interest: A.C. Faber has served as a paid consultant for AbbVie. KS and PR are employees of Metabolon, Inc.

Figures

Figure 1.
Figure 1.. MYCN-amplified neuroblastomas (NBs) are hypersensitive to glutathione inhibition.
(A) and (B) DEPMAP (Broad Institute consortium) analysis of three siRNA screens covering 712 cancer cell lines. Only NBs were uniquely sensitive among all cancer subsets (A) and MYCN-amplified NB cell lines demonstrated hypersensitivity to the ML210 GPX4 inhibitor (compared to all other cancer cell lines) (B). For the dot plots, non-parametric Mann-Whitney test was performed. (C) A panel of MYCN-amplified and MYCN-wild type NB cell lines were treated with increasing concentrations of BSO for 72h and the percentage of viable cells was determined by CellTiter-Glo assay, n=3, error bars indicate +SD. Two-way Anova test was performed for each concentration separately to determine the effect of the different cell lines as well as the effect of the MYCN status for each concentration. p-values were corrected for multiple testing using Bonferroni method. Differences were considered statistically different if p < 0.05, * p < 0.05, ** p < 0.01, *** p < 0.001, **** p < 0.0001. (D) CHLA20 and SK-N-SH control as well as MYCN overexpressing cells were treated with increasing concentrations of BSO for 72h and 48h respectively and cell viability was measured by CellTiter-Glo, n=3, error bars indicate +SD. (E) IMR5 and SK-N-BE(2) MYCN-amplified neuroblastomas were treated with 50 nM scrambled or MYCN-targeting siRNA for 24 h. Cells were reseeded and treated the following day with BSO for 48h and cell viability was measured by CellTiter-Glo, n=3, error bars indicate +SD. (F) Measurement of GSH in IMR5 cells with increasing concentrations of BSO for 72h. Data are means ± SEM with n=3 biological replicates. (G) IMR5 cells were treated with increasing concentrations of BSO for 48h and stained with CM-H2DCFDA and C-11 BODIPY to mark general and lipid oxidative stress respectively, n=3, error bars indicate +SEM. (H) IMR5 cells were treated with increasing concentrations of BSO with or without 5 mM N-acetyl-cysteine (NAC) for 48h and cell viability was determined, n=3, error bars indicate +SD. (I) IMR5 cells were treated with increasing concentrations of BSO alone or in combination with 1 μM a-tocopherol for 48h and cell viability was evaluated, n=3, error bars indicate +SD. For figures 1D-1I, Student’s t test was performed, and p-values were corrected for multiple testing using Bonferroni method. Differences were considered statistically different if p < 0.05. For all calculated p-values: * p < 0.05, ** p < 0.01, *** p < 0.001, **** p < 0.0001.
Figure 2.
Figure 2.. Subunits of the cystine/glutamate antiporter system Xc- are significantly increased in MYCN-amplified compared to the MYCN-wild type NBs.
(A) Box plots from datasets obtained from R2 platform demonstrating differential RNA expression of system Xc- subunits SLC7A11 and SLC3A2 in MYCN-amplified NB tumors compared to MYCN-wt NB tumors. Mann-Whitney test was performed. (B) on the left SHEP21N, a NB cell line engineered to express MYCN in the absence of doxycycline, demonstrates SLC3A2 promoter binding at an EBOX-positive portion of the promoter, which decreases as MYCN expression does (through the addition of doxycycline). The SHEP21 cells engineered to express MYCN with the addition of Dox demonstrated a nearly identical peak when MYCN is turned on (Dox is added). (B) on the right Expression data from the SHEP21 cells in MYCN-expression (Dox +) and MYCN-non expression (Dox -) conditions. Each dot represents an independent data point. Statistical analysis was performed using Student’s t test and p-value was calculated (0.0799), n=3. (C) Whole cell lysates from MYCN-wt NB cell lines expressing either GFP or exogenous MYCN and MYCN-amplified NB cells treated with either 50 nM scrambled or 50 nM MYCN-targeting siRNA for 24h were prepared, subjected to western blotting and probed for the indicated proteins. (D) Glutathione levels were determined in MYCN overexpressing MYCN-wt cell lines along with their GFP overexpressing counterparts. Data are means ± SEM with n=3 biological replicates. (E) Glutathione levels were detected in MYCN-amplified cell lines treated with either 50 nM scrambled or 50 nM MYCN-targeting siRNA. Data are means ± SEM with n=3 biological replicates. Lysates from the same cells were used also for Fig. 2C and Sup. Fig. 2D. (F) Cystine depletion was carried out in RPE.1 and SK-N-SH syngeneic cell lines for 8 and 24 hours respectively and cell viability was evaluated, n=3, error bars indicate +SEM. For figures 2D-2F, Student’s t test was performed, and p-values were corrected for multiple testing using Bonferroni method. Differences were considered statistically different if p < 0.05. For all calculated p-values: * p < 0.05, ** p < 0.01, *** p < 0.001, **** p < 0.0001.
Figure 3.
Figure 3.. The system xc- inhibitor sulfasalazine induces ferroptosis specifically in MYCN-amplified neuroblastoma cells in vitro and promotes tumor responses in vivo.
(A) MYCN-amplified and MYCN-wild type cell lines, were treated with increasing concentrations of sulfasalazine (SAS) for 72h and cell viability was detected by CellTiter-Glo, n=3, error bars indicate +SD. Two-way Anova test was performed for each concentration separately to determine the effect of the different cell lines as well as the effect of the MYCN status for each concentration. p-values were corrected for multiple testing using Bonferroni method. Differences were considered statistically different if p < 0.05, * p < 0.05, ** p < 0.01, *** p < 0.001, **** p < 0.0001. (B) IMR5 and SK-N-BE(2) MYCN-amplified cells were treated with increasing concentrations of SAS for 48h and GSH levels were measured by GSH-Glo assay kit from Promega. Data are means ± SEM with n=3 biological replicates. (C) KELLY and IMR5 MYCN-amplified NB cells were treated with 1mM of SAS or 1mM of SAS together with 10μM of ferrostatin-1 and 10 μM of liproxstatin-1 for 24h (KELLY) and 48h (IMR5) and cell viability was detected, n=3, error bars indicate +SD. (D) Syngeneic SK-N-SH and CHLA172 cells were treated with increasing concentrations of sulfasalazine (SAS) for 48h and cell viability was measured by CellTiter-Glo assay, n=3, error bars indicate +SD. (E) MYCN-amplified cell lines treated with 1 mM of SAS for 48h after being transfected with siRNA against MYCN or non-targeting siRNA. Cell viability was assessed as before, n=3 biological replicates, error bars indicate +SD. Lysates from the same cells were used also for Sup. Fig. 2D. (F) MYCN-amplified NB cell line xenograft (IMR5) as well as PDX model (COG-N-415), were randomized into treatment cohorts as described in the Material and Methods section. Sulfasalazine was administered intraperitoneally, at a dosage of 250 mg/kg, six days a week (Monday-Saturday). Tumor measurements were performed every other day by calipers, and the average tumor volume + SEM for each cohort is displayed. (G) The ferroptosis markers transferrin receptor 1 (TfR1) and malondialdehyde (MDA) in control and sulfasalazine treated IMR5 xenografts were detected by immunohistochemistry and their staining was quantified, error bars indicate +SEM. For figures 3B-3G, Student’s t test was performed, and p-values were corrected for multiple testing using Bonferroni method. Differences were considered statistically different if p < 0.05. For all calculated p-values: * p < 0.05, ** p < 0.01, *** p < 0.001, **** p < 0.0001.
Figure 4.
Figure 4.. Iron accumulation is increased in MYCN-amplified NB.
(A) The CHLA20 and RPE.1 syngeneic pairs were treated with increasing concentrations of deferoxamine (DFO) for 72h and cell viability was assessed by CellTiter-Glo, n=3, error bars indicate +SD. (B) Panels of MYCN-amplified and MYCN-wild type cell lines were treated with increasing concentrations of deferoxamine (DFO) for 72h and cell viability was detected by CellTiter-Glo, n=3, error bars indicate +SD. Two-way Anova test was performed for each concentration separately, to determine the effect of the different cell lines as well as the effect of the MYCN status for each concentration. p-values were corrected for multiple testing using Bonferroni method. Differences were considered statistically different if p < 0.05, * p < 0.05, ** p < 0.01, *** p < 0.001, **** p < 0.0001. (C) Box plots from three distinct NB tumor datasets obtained from R2 platform demonstrating differential TFRC mRNA expression levels between MYCN-wild type and MYCN-amplified NBs. For statistical analysis Mann-Whitney test was performed. (D) Same cell line system used in 2B, here used for investigating whether MYCN is binding to the TFRC promoter. (E) Whole cell lysates from MYCN-wt NB cell lines overexpressing exogenous MYCN or GFP or MYCN-amplified NB cell lines treated with either 50 nM scrambled or 50 nM MYCN-targeting siRNA for 24h were prepared, subjected to western blotting and probed for the indicated proteins. (F) Cellular levels of labile Fe (II) were depicted as percentage change of the average fluorescence intensity between control and MYCN overexpressing syngeneic cell lines using FeRhoNox-1 probe. The values were normalized to the number of live cells measured by CellTiter-Glo, n=3, error bars indicate +SEM. (G) Box plots demonstrating differential SLC40A1 mRNA expression levels between MYCN-wild type and MYCN-amplified NBs across three distinct NB tumor datasets obtained from R2 platform. For statistical analysis Mann-Whitney test was performed. For figures 4A and 4F, Student’s t test was performed, and p-values were corrected for multiple testing using Bonferroni method. Differences were considered statistically different if p < 0.05. For all calculated p-values: * p < 0.05, ** p < 0.01, *** p < 0.001, **** p < 0.0001.
Figure 5.
Figure 5.. FDA-approved auranofin induces ferroptosis specifically in MYCN-amplified NB in vitro and promotes tumor responses in vivo.
(A) A panel of MYCN-amplified and a panel of MYCN-wild type NB cell lines were treated with increasing concentrations of auranofin for 72h and the percentage of viable cells was measured by CellTiter-Glo assay, n=3, error bars indicate +SD. Non-parametric Mann-Whitney test was performed for each concentration separately, comparing cell viability values between MYCN-wt and MYCN-amplified cell lines. Differences were considered statistically different if p < 0.05. (B) KELLY and SK-N-DZ MYCN-amplified NB cells were treated with 3300 nM of auranofin or 3300 nM of auranofin together with 10μM of ferrostatin-1 overnight and cell viability was detected, n=3, error bars indicate +SD. (C) RPE.1, CHLA20 and SK-N-SH syngeneic models expressing MYCN and GFP were treated with increasing concentrations of auranofin for 48h, 72h and 12h respectively and CellTiter-Glo assay was performed, n=3, error bars indicate +SD. (D) Additionally, IMR5 cells were transduced with lentiviruses containing plasmids with shRNA sequences targeting MYCN or a nontargeting control. Puromycin-resistant cells were pooled after each infection. Both sh MYCN and sh Scramble cells were also treated with increasing concentrations of auranofin for 12h and cell viability was assessed, n=3, error bars indicate +SD. (E) KELLY and SK-N-DZ cells were treated with increasing concentrations of auranofin with or without 100 μM DFO for 5h and stained with CM-H2DCFDA and C-11 BODIPY to mark general and lipid oxidative stress respectively, n=3, error bars indicate +SEM. (F) MYCN-amplified SK-N-BE(2) cells were treated with 50 nM scrambled or MYCN-targeting siRNA for 24 h. Cells were reseeded and treated the following day with 3300 nM auranofin alone or in the presence of 100 μM DFO for 3h and intracellular as well as lipid ROS levels were measured, n=3, error bars indicate +SEM. (G) and (H) Ex vivo MYCN-amplified PDX cells COG-N-496 as well as the syngeneic CHLA20 pair were treated with increasing concentrations of auranofin in combination with 100 μM DFO overnight (COG-N-496) or for 48h (CHLA20 MYCN/GFP) and the percentage of viable cells was detected by CellTiter-Glo, n=3, error bars indicate +SD. For figures 5B-5G, Student’s t test was performed, and p-values were corrected for multiple testing using Bonferroni method. For figure 5H, two-way Anova test was performed for each concentration separately; the comparisons between GFP and MYCN are depicted with green color and the comparisons between −/+ DFO with black color. Differences were considered statistically different if p < 0.05. For all calculated p-values: * p < 0.05, ** p < 0.01, *** p < 0.001, **** p < 0.0001.
Figure 6.
Figure 6.. Treatment with auranofin leads to anti-NB activity in vivo.
(A) MYCN-amplified NB PDX and cell line xenograft models, COG-N-561, COG-N-452, COG-N-496 and IMR5, as well as the MYCN-wt cell line SK-N-SH xenografts, were randomized into treatment cohorts, as described in the Materials and Methods section. Auranofin was administered intraperitoneally, at a dosage of 10 mg/kg, six days a week (Monday-Saturday). Tumor measurements were performed every other day by calipers, and the average tumor volume + SEM for each cohort is displayed. (B) The ferroptosis markers transferrin receptor 1 (TfR1) and malondialdehyde (MDA) in non-treated and auranofin treated IMR5 xenografts were detected by immunohistochemistry and their staining was quantified, error bars indicate +SEM. For figures 6A and 6B, Student’s t test was performed, and p-values were corrected for multiple testing using Bonferroni method. Differences were considered statistically different if p < 0.05, * p < 0.05, ** p < 0.01, *** p < 0.001, **** p < 0.0001. (C) Graphical depiction of iron accumulation, ROS production and potential ferroptosis induction in MYCN-amplified NBs. Our model is that MYCN-amplified NBs have higher levels of intracellular iron, likely due to increased expression of the transferrin receptor 1 and lower expression of ferroportin. Iron can be lethal to the cell, if its levels are high, as it is also a major ROS producer. In order to counteract the potential oxidative stress, the MYCN overexpressing NBs express higher levels of the two subunits of system Xc-, SLC3A2 and SLC7A11, as well as GCLC, to provide the cell with cystine and establish an antioxidant protective system through glutathione production and GPX4 activation. Treating the MYCN NBs with selective inhibitors of the glutathione pathway results in elevated lipid peroxidation and finally ferroptotic cell death. Furthermore, inhibiting the parallel thioredoxin detoxification pathway with auranofin enhances sensitivity in the MYCN NBs (the illustration was created with BioRender.com).

Similar articles

Cited by

References

    1. Dixon SJ, Lemberg KM, Lamprecht MR, Skouta R, Zaitsev EM, Gleason CE, et al. Ferroptosis: an iron-dependent form of nonapoptotic cell death. Cell 2012;149:1060–72 - PMC - PubMed
    1. Seibt TM, Proneth B, Conrad M. Role of GPX4 in ferroptosis and its pharmacological implication. Free Radic Biol Med 2019;133:144–52 - PubMed
    1. Torti SV, Torti FM. Iron and cancer: more ore to be mined. Nat Rev Cancer 2013;13:342–55 - PMC - PubMed
    1. Netz DJ, Stith CM, Stumpfig M, Kopf G, Vogel D, Genau HM, et al. Eukaryotic DNA polymerases require an iron-sulfur cluster for the formation of active complexes. Nat Chem Biol 2011;8:125–32 - PMC - PubMed
    1. Oexle H, Gnaiger E, Weiss G. Iron-dependent changes in cellular energy metabolism: influence on citric acid cycle and oxidative phosphorylation. Biochim Biophys Acta 1999;1413:99–107 - PubMed

Publication types

MeSH terms