. 2021 Jan 26;118(4):e2022120118.
doi: 10.1073/pnas.2022120118.

Genome-wide CRISPR screens reveal multitiered mechanisms through which mTORC1 senses mitochondrial dysfunction

Affiliations

Genome-wide CRISPR screens reveal multitiered mechanisms through which mTORC1 senses mitochondrial dysfunction

Kendall J Condon et al. Proc Natl Acad Sci U S A. .

Abstract

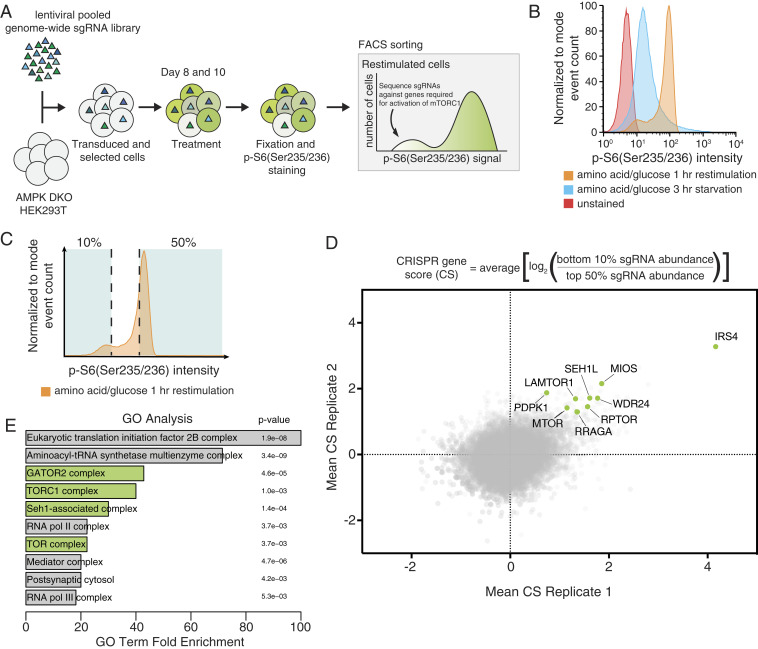
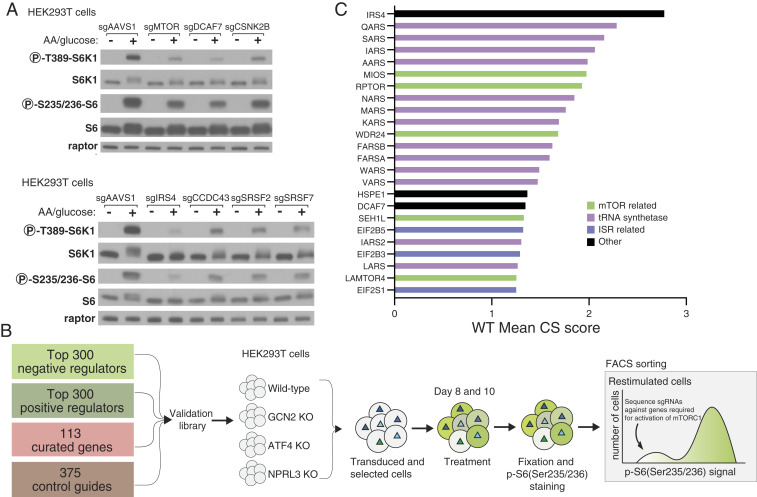
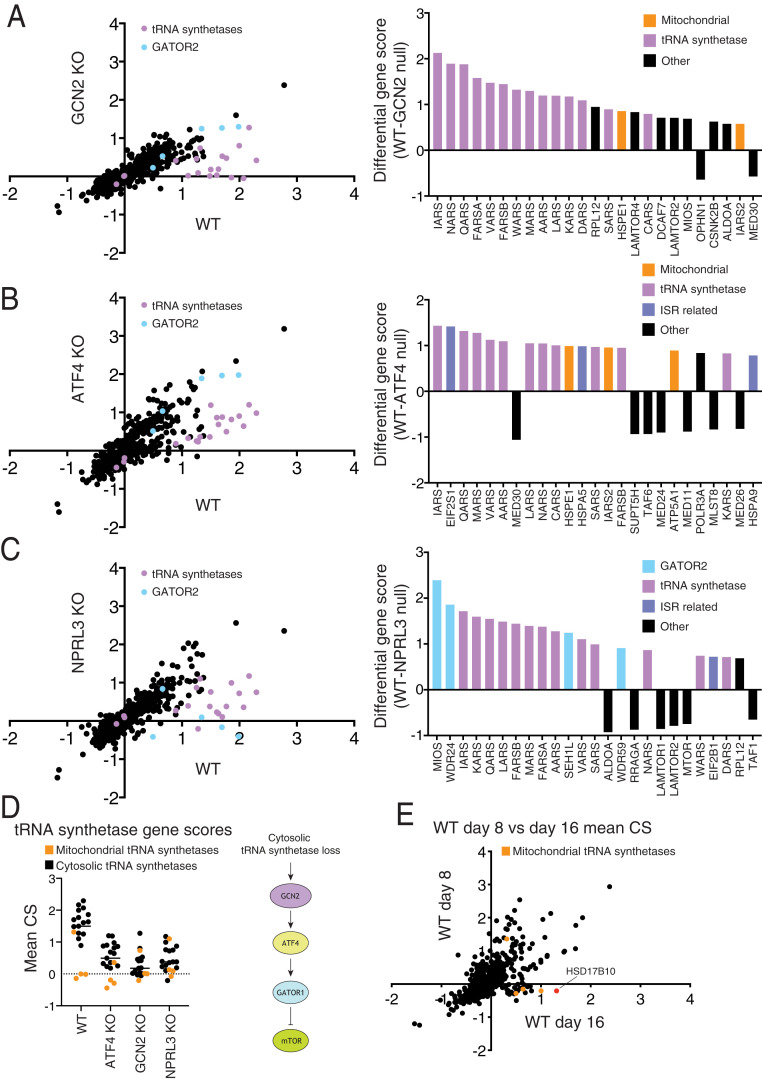
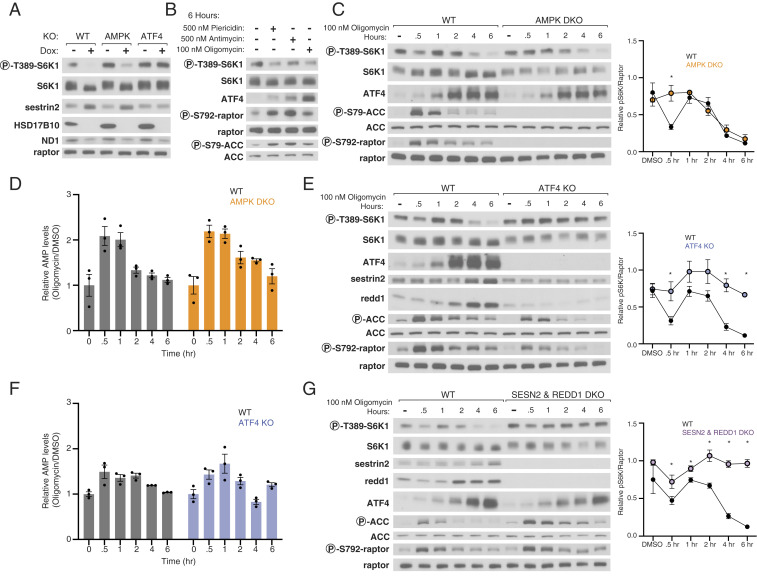
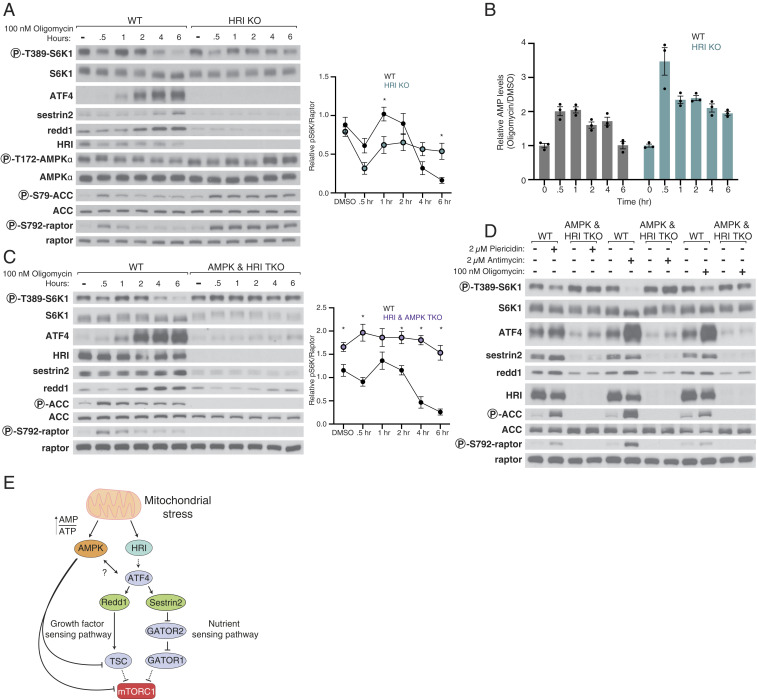
In mammalian cells, nutrients and growth factors signal through an array of upstream proteins to regulate the mTORC1 growth control pathway. Because the full complement of these proteins has not been systematically identified, we developed a FACS-based CRISPR-Cas9 genetic screening strategy to pinpoint genes that regulate mTORC1 activity. Along with almost all known positive components of the mTORC1 pathway, we identified many genes that impact mTORC1 activity, including DCAF7, CSNK2B, SRSF2, IRS4, CCDC43, and HSD17B10 Using the genome-wide screening data, we generated a focused sublibrary containing single guide RNAs (sgRNAs) targeting hundreds of genes and carried out epistasis screens in cells lacking nutrient- and stress-responsive mTORC1 modulators, including GATOR1, AMPK, GCN2, and ATF4. From these data, we pinpointed mitochondrial function as a particularly important input into mTORC1 signaling. While it is well appreciated that mitochondria signal to mTORC1, the mechanisms are not completely clear. We find that the kinases AMPK and HRI signal, with varying kinetics, mitochondrial distress to mTORC1, and that HRI acts through the ATF4-dependent up-regulation of both Sestrin2 and Redd1. Loss of both AMPK and HRI is sufficient to render mTORC1 signaling largely resistant to mitochondrial dysfunction induced by the ATP synthase inhibitor oligomycin as well as the electron transport chain inhibitors piericidin and antimycin. Taken together, our data reveal a catalog of genes that impact the mTORC1 pathway and clarify the multifaceted ways in which mTORC1 senses mitochondrial dysfunction.

Keywords: CRISPR-Cas9 screen; mTORC1; mitochondria.


Conflict of interest statement

The authors declare no competing interest.

Figures

Fig. 1.
Fig. 1.
CRISPR-Cas9 screen identifies positive regulators of mTORC1. (A) Schematic of the CRISPR-Cas9 FACS-based genome-wide screen. (B) Representative flow cytometry histogram of wild-type HEK293T cells not exposed to the primary antibody (red), or immunostained after starvation of amino acids and glucose (blue), or starved of and restimulated with both (orange). (C) Schematic for FACS collection on a representative starved and restimulated sample of cells. (D) Equation for determining CRISPR scores (CSs). Known mTORC1 regulators are highlighted in green. Positive CRISPR scores indicate genes that when lost prevented cells from fully reactivating mTORC1 upon combined glucose and amino acid restimulation as readout by p-S6 levels. Mean CS from two biological replicates of genome-wide screens in AMPK DKO HEK293T cells. (E) GO analysis shows enrichment of mTORC1-related complexes in an unbiased manner. Analysis was performed on the 106 top scoring genes, which had an FDR of <0.05.
Fig. 2.
Fig. 2.
Generation of focused sublibrary and validation of individual gene hits. (A) Validation of select genes from screen. Immunoblot analysis shows mTORC1 signaling is blunted, as detected by decreased phosphorylation of the direct mTORC1 substrate S6K1, in HEK293T cells expressing sgRNAs targeting indicated genes. Signaling was assayed 8 d posttransduction with the indicated sgRNA as described for the primary screen. (B) Categories of genes included in the focused sublibrary along with a schematic of how the focused screens were performed. (C) CS scores for the 24 top scoring genes from a focused sublibrary screen in wild-type HEK293T cells.
Fig. 3.
Fig. 3.
Focused sublibrary screens in cells deficient in known stress and amino acid sensing pathways. (AC) Comparisons of CRISPR scores (CSs) from focused sublibrary screens in wild-type HEK293T to those in cells lacking GCN2, ATF4, or NPRL3. The top 25 differential CSs for each screening pair are included in an adjacent bar graph. The tRNA synthetase genes targeted in the library are highlighted in purple. Genes encoding GATOR2 components are highlighted in light blue. (D) Scores for tRNA synthetase genes present in the focused sublibrary in screens across all indicated cell lines. (E) Focused screens performed at 8 versus 16 d after transduction, highlighting genes whose scores are time dependent.
Fig. 4.
Fig. 4.
AMPK and ATF4 signal mitochondrial distress to mTORC1. (A) Loss of HSD17B10 inhibits mTORC1 activation by amino acids and glucose in an ATF4-dependent manner. HSD17B10 knockout HEK293T cells with dox-off conditional HSD17B10 expression were cultured with or without doxycycline (dox) for 8 d and then starved of amino acids and glucose for 1 h and restimulated with both for 30 min. Immunoblot analyses of mTORC1 signaling and HSD17B10 expression. ND1 levels are expected to decrease upon loss of mitochondrial translation. (B) Inhibition of complex I, complex III, or the ATP synthase suppresses mTORC1 signaling. mTORC1 activity was assayed in response to a 6-h treatment with vehicle (DMSO), piericidin (500 nM), antimycin (500 nM), or oligomycin (100 nM). (C) AMPK mediates the first phase of mTORC1 inhibition in response to mitochondrial distress. Immunoblot analyses of mTORC1 signaling over the course of a 6-h treatment with 100 nM oligomycin in wild-type and AMPK DKO HEK293T cells. The levels of S6K1 phosphorylation were quantified using densitometry with ImageJ. Values shown are the mean ± SEM for n = 3 biologically independent experiments. P values were determined using a two-sided Student’s t test. *P < 0.05 (D) AMP levels increase acutely upon treatment with oligomycin and subsequently return to baseline levels. Metabolite extracts were analyzed by LC-MS and relative AMP levels are shown as the mean ± SEM for n = 3 biologically independent experiments. (E and F) ATF4 mediates the second phase of mTORC1 signaling in response to mitochondrial distress. Time course experiments were performed and analyzed as in C and D. (G) Sestrin2 and Redd1 are required for the ISR to inhibit mTORC1 signaling in response to mitochondrial distress. Time course experiments were performed and analyzed as in C.
Fig. 5.
Fig. 5.
Together, AMPK and HRI signal mitochondrial dysfunction to mTORC1. (A) Loss of HRI prevents activation of the ISR in response to mitochondrial distress and renders mTORC1 signaling resistant to the second phase of inhibition caused by oligomycin. Cell lysates were analyzed by immunoblotting and the levels of S6K1 phosphorylation quantified as in Fig. 4. Values are mean ± SEM for n = 3 biologically independent experiments. P values were determined using a two-sided Student’s t test. (B) HRI KO HEK293T cells have increased AMPK activity, which corresponds to an increase in AMP levels upon treatment with oligomycin. Metabolite extracts were analyzed by liquid chromatography-mass spectrometry (LC-MS) and relative AMP levels are shown as the mean ± SEM for n = 3 biologically independent experiments. (C) Loss of both HRI and AMPK prevents inhibition of mTORC1 by oligomycin. Time course experiments were performed and analyzed as in A in cells lacking AMPK and HRI (AMPK and HRI TKO). (D) In HEK293T cells lacking AMPK and HRI, mTORC1 signaling is resistant to the inhibition normally caused by a 6-h treatment with piericidin, antimycin, or oligomycin. (E) Model for pathway leading to mTORC1 inhibition in response to mitochondrial distress.

References

    1. Sancak Y., et al. , The Rag GTPases bind raptor and mediate amino acid signaling to mTORC1. Science 320, 1496–1501 (2008). - PMC - PubMed
    1. Efeyan A., et al. , Regulation of mTORC1 by the Rag GTPases is necessary for neonatal autophagy and survival. Nature 493, 679–683 (2013). - PMC - PubMed
    1. Orozco J. M., et al. , Dihydroxyacetone phosphate signals glucose availability to mTORC1. Nat. Metab. 2, 893–901 (2020). - PMC - PubMed
    1. Castellano B. M., et al. , Lysosomal cholesterol activates mTORC1 via an SLC38A9-Niemann-Pick C1 signaling complex. Science 355, 1306–1311 (2017). - PMC - PubMed
    1. Sancak Y., et al. , Ragulator-Rag complex targets mTORC1 to the lysosomal surface and is necessary for its activation by amino acids. Cell 141, 290–303 (2010). - PMC - PubMed

Publication types

MeSH terms

Substances

LinkOut - more resources