. 2021 Jan 22;7(1):4.
doi: 10.1038/s41540-020-00165-3.

Integrative computational approach identifies drug targets in CD4+ T-cell-mediated immune disorders

Affiliations

Integrative computational approach identifies drug targets in CD4+ T-cell-mediated immune disorders

Bhanwar Lal Puniya et al. NPJ Syst Biol Appl. .

Abstract

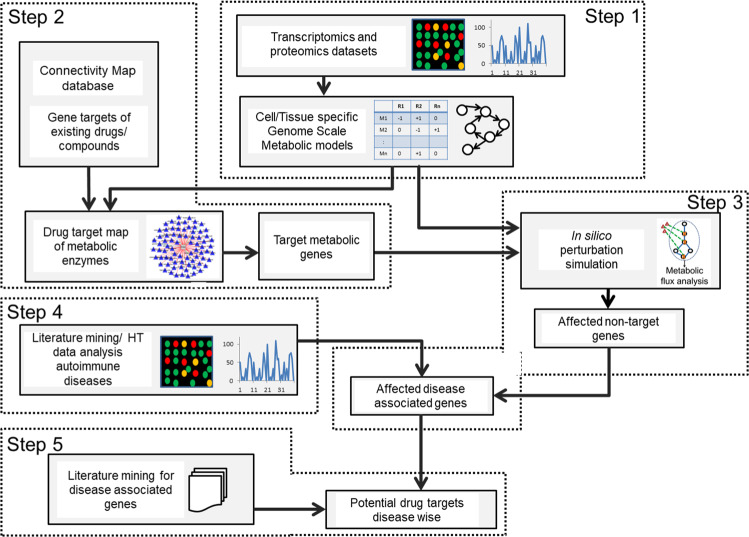
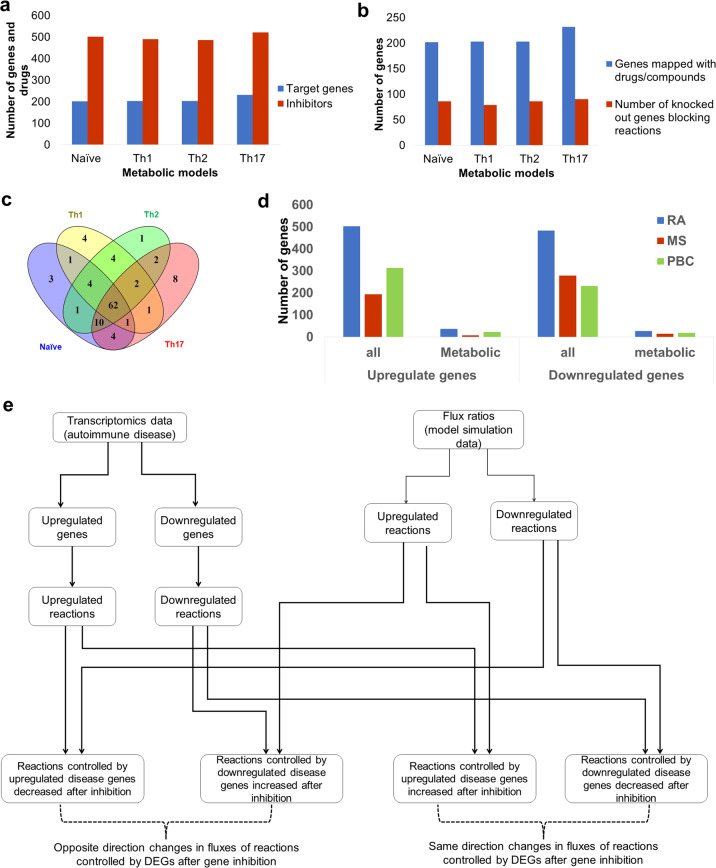
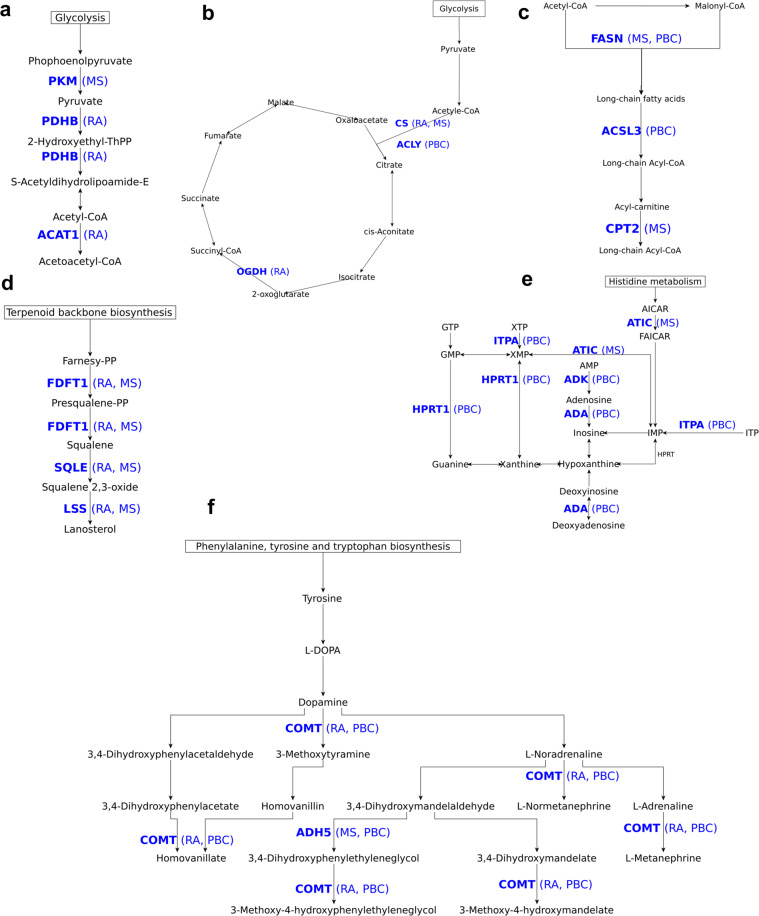
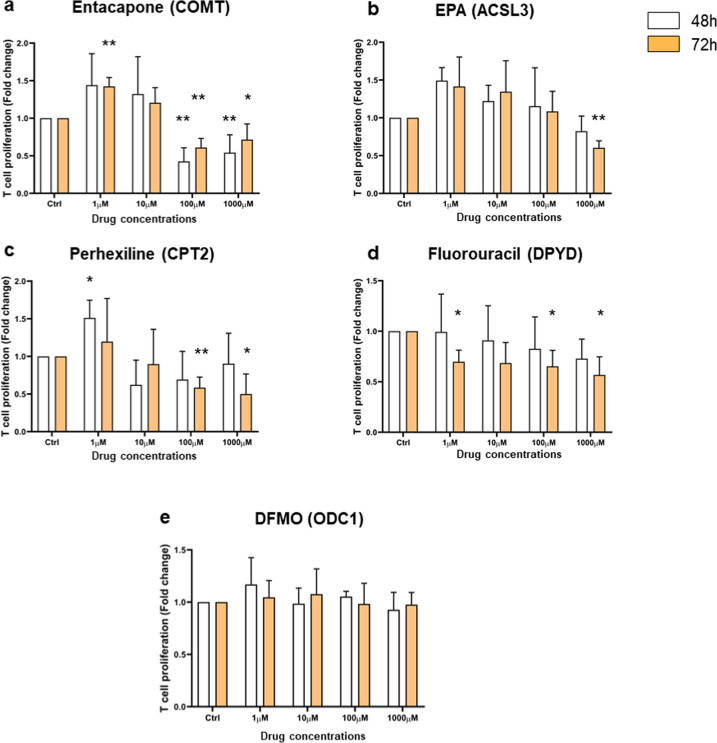
CD4+ T cells provide adaptive immunity against pathogens and abnormal cells, and they are also associated with various immune-related diseases. CD4+ T cells' metabolism is dysregulated in these pathologies and represents an opportunity for drug discovery and development. Genome-scale metabolic modeling offers an opportunity to accelerate drug discovery by providing high-quality information about possible target space in the context of a modeled disease. Here, we develop genome-scale models of naïve, Th1, Th2, and Th17 CD4+ T-cell subtypes to map metabolic perturbations in rheumatoid arthritis, multiple sclerosis, and primary biliary cholangitis. We subjected these models to in silico simulations for drug response analysis of existing FDA-approved drugs and compounds. Integration of disease-specific differentially expressed genes with altered reactions in response to metabolic perturbations identified 68 drug targets for the three autoimmune diseases. In vitro experimental validation, together with literature-based evidence, showed that modulation of fifty percent of identified drug targets suppressed CD4+ T cells, further increasing their potential impact as therapeutic interventions. Our approach can be generalized in the context of other diseases, and the metabolic models can be further used to dissect CD4+ T-cell metabolism.


Conflict of interest statement

The authors declare no competing interests.

Figures

Fig. 1
Fig. 1. Integrative approach for the identification of potential metabolic drug targets.
The computational approach comprised of five major steps: (1) Construction of metabolic models using integrated transcriptomics and proteomics data, (2) Identification of metabolic genes that are targets for existing drugs/compounds, (3) In silico inhibition of targets of existing drugs to identify affected reactions, (4) Identification of differentially expressed genes (DEGs) in autoimmune diseases and their integration with flux ratios (Fluxperturbed /FluxWT), and (5) Validation with literature and prediction of new targets.
Fig. 2
Fig. 2. Construction of metabolic models in CD4+ T cells.
a Expressed metabolic genes identified using integrated transcriptomics and proteomics data of CD4+ T-cell subtypes. b KEGG pathway enrichment analysis of expressed genes in each cell type using all 1892 metabolic genes as a background. c Fold enrichment and P-values (larger sizes correspond to lower P-values) of KEGG pathways enriched across CD4+ T-cell subtypes. A pathway was considered significantly enriched with P-value < 0.05 and false discovery rate (FDR) <5%.
Fig. 3
Fig. 3. Flux map of metabolic pathways active in CD4+ T-cell metabolic models.
Escher map showing fluxes through glycolysis, glucose to lactate conversion, TCA cycle, glutaminolysis in naïve model. The colors represent the reaction fluxes in the naïve model. Gray arrow color corresponds to zero flux. Gradients of blue, green, and red correspond to non-zero flux. For key reactions, flux comparison between naïve and Th1 is shown through bar plots. Both naïve and Th1 models convert pyruvate to lactate (aerobic glycolysis). In glycolysis, the naïve model had the reverse direction flux through PGI reaction, while Th1 cells have forward direction flux. All the models exhibit an uptake of glutamine that ultimately forms α-Ketoglutaric acid (glutaminolysis). GLNtm (glutamine transporter) and GLUNm (convert glutamine to glutamate) reactions are active in the naïve model and not in models that use different routes for glutamine to glutamate conversion.
Fig. 4
Fig. 4. Model predictions are consistent with the literature.
a Dependency of growth rate to varying rate of glucose uptake. b Production of lactate with increased flux through pyruvate dehydrogenase. c The dependency of growth rate (in all models) on glutamine when glucose was available (>5 mmol/g DW/hr). d The dependency of growth on glutamine when glucose was removed from the environment. Dots in a, c, and d are average flux and error bars are standard deviation (n = 5). We varied the uptake rate of glucose or glutamine five times (n = 5) to obtain the average and standard deviation at each dot. For example, in a, the growth rate at 3.0 mmol/g DW/hr glucose uptake is the average of growth rates obtained under 3.2, 3.1, 3.0, 2.9, 2.8 (mmol/g DW/hr) of glucose uptake.
Fig. 5
Fig. 5. Identification of potential drug targets for RA, MS, and PBC.
a Distribution of metabolic drug target genes, and inhibitory drugs or compounds in each model. b Number of metabolic genes in the models mapped with inhibitory drugs (blue bars) and number of genes among drugs mapped genes that can block at least one reaction upon inhibition (red bars). c Comparison of metabolic drug targets that affect reactions upon deletion in CD4+ T-cell models. d Number of all differentially expressed genes (DEGs) and metabolic DEGs in three diseases rheumatoid arthritis (RA), multiple sclerosis (MS), and primary biliary cholangitis (PBC) (Padj < 0.05). The DEGs were analyzed using three transcriptomics datasets (one dataset per disease). The data were obtained from peripheral CD4+ T cells of groups of patients and healthy individuals. e Schematic representation of the integration of disease-associated differentially expressed genes and affected reaction on each drug target gene perturbation. For each drug target deletion, we investigated how many of fluxes regulated by upregulated genes are decreased and fluxes regulated by downregulated genes are increased. We used these numbers to calculate PES (perturbation effect score, see Materials and methods).
Fig. 6
Fig. 6. Examples of identified drug targets mapped on the metabolic pathways.
Relevant sub-networks of pathways where drug targets were mapped are shown for a pyruvate metabolism, b TCA cycle, c fatty acid biosynthesis, d steroid biosynthesis, e purine metabolism, and f tyrosine metabolism. The mapped drug targets (bold font) and diseases (in brackets) are shown in blue colored text.
Fig. 7
Fig. 7. Analysis of CD4+ T-cell proliferation response upon drug treatment by MTT assay.
CD4+ T cells were exposed to various concentrations of drugs (1, 10, 100, and 1000 μM) for 48 h (white bars) and 72 h (orange bars). Drugs’ names (Entacapone, EPA, Perhexiline, Fluorouracil, and DFMO) were indicated on the top of each graph bar with their corresponding targeted gene in parentheses. Cell proliferation is expressed as fold change ± SEM relative to untreated control cells and is representative of four independent experiments. Statistic significance was only shown for effective concentration and was evaluated using a paired t-test, one-tailed (*p < 0.05, **p < 0.005).

References

    1. Zhu J, Paul WE. CD4 T cells: fates, functions, and faults. Blood. 2008;112:1557–1569. doi: 10.1182/blood-2008-05-078154. - DOI - PMC - PubMed
    1. Michalek RD, et al. Cutting edge: distinct glycolytic and lipid oxidative metabolic programs are essential for effector and regulatory CD4+ T cell subsets. J. Immunol. 2011;186:3299–3303. doi: 10.4049/jimmunol.1003613. - DOI - PMC - PubMed
    1. Chang C-H, et al. Posttranscriptional control of T cell effector function by aerobic glycolysis. Cell. 2013;153:1239–1251. doi: 10.1016/j.cell.2013.05.016. - DOI - PMC - PubMed
    1. Granados HM, et al. Programmed cell death-1, PD-1, is dysregulated in T cells from children with new onset type 1 diabetes. PLOS ONE. 2017;12:e0183887. doi: 10.1371/journal.pone.0183887. - DOI - PMC - PubMed
    1. Lü S, et al. PKM2-dependent metabolic reprogramming in CD4+ T cells is crucial for hyperhomocysteinemia-accelerated atherosclerosis. J. Mol. Med. 2018;96:585–600. doi: 10.1007/s00109-018-1645-6. - DOI - PubMed

Publication types

MeSH terms