. 2021 Jan 22;12(1):525.
doi: 10.1038/s41467-020-20874-x.

CTLA-4 expression by B-1a B cells is essential for immune tolerance

Affiliations

CTLA-4 expression by B-1a B cells is essential for immune tolerance

Yang Yang et al. Nat Commun. .

Abstract

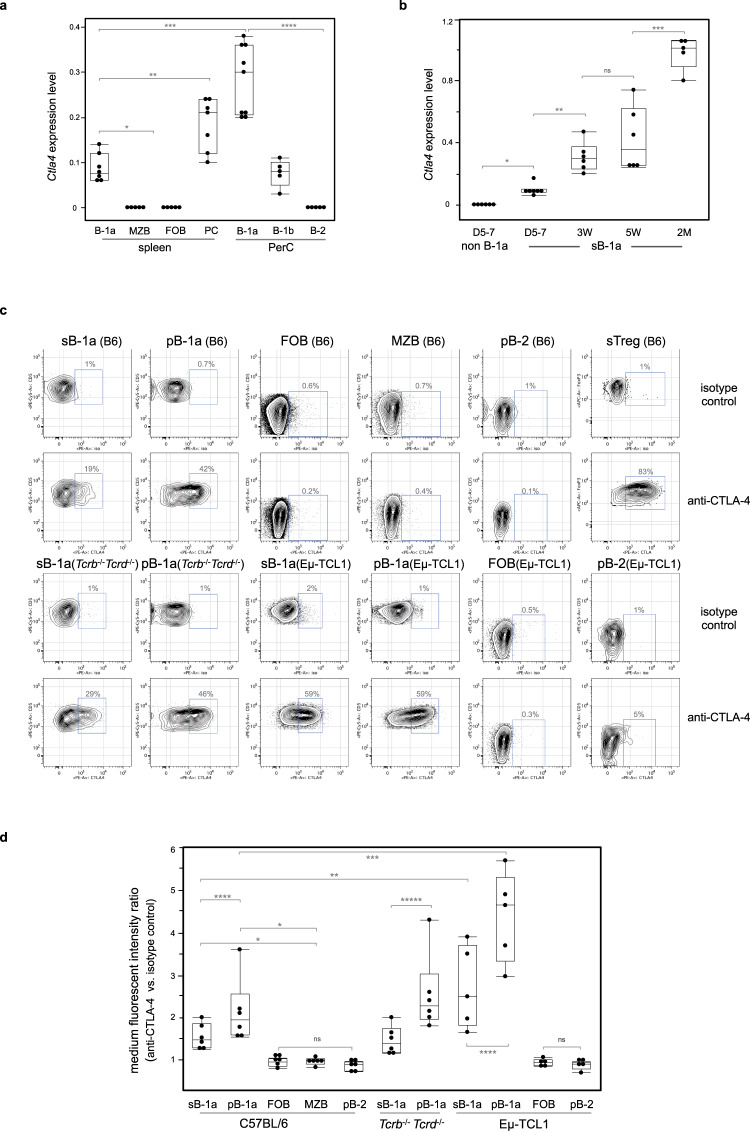
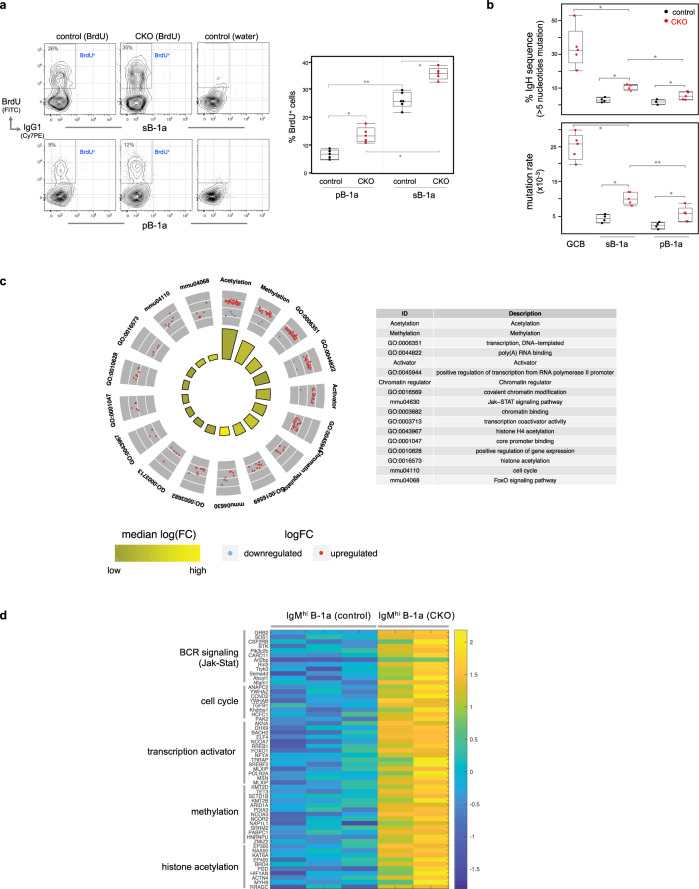
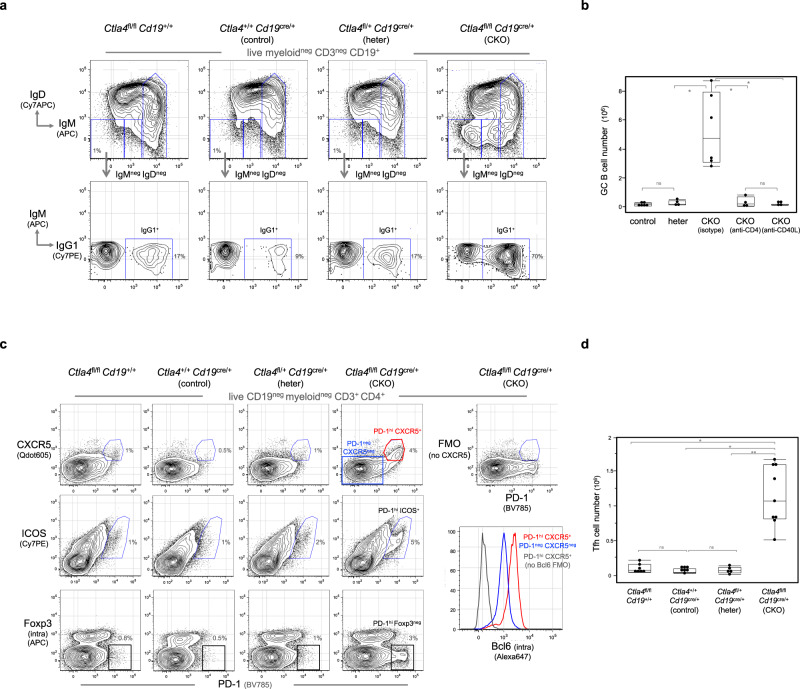
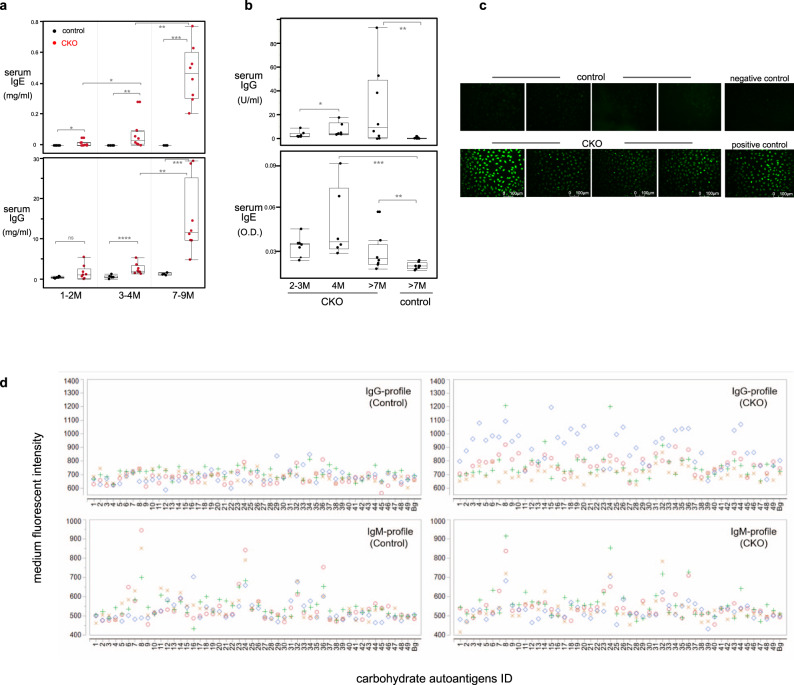
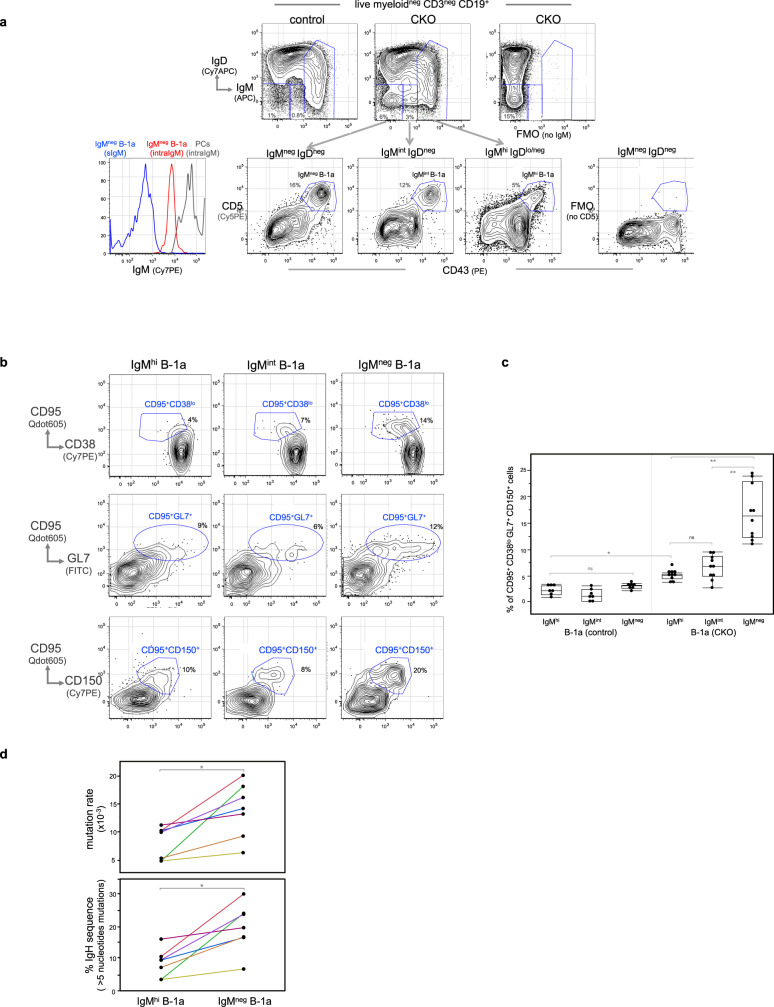
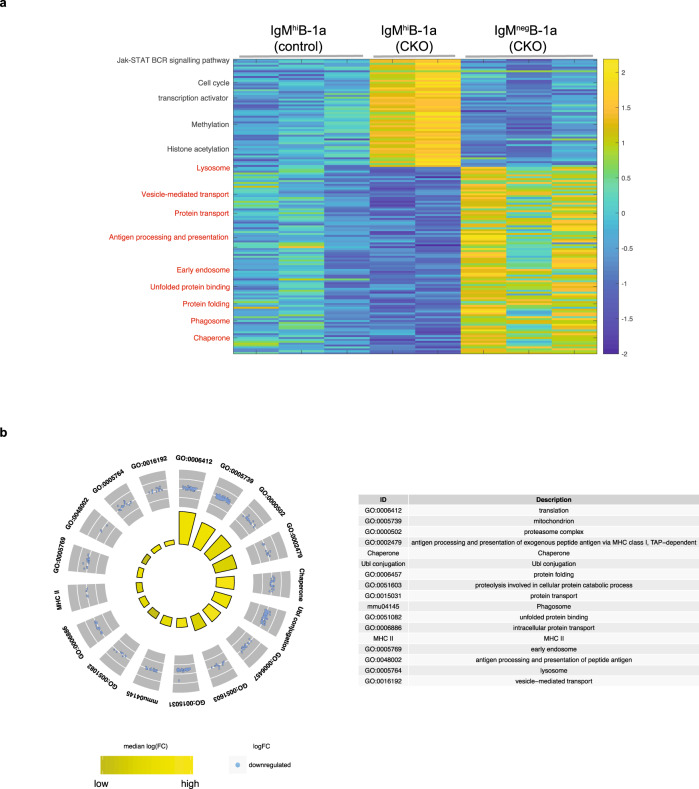
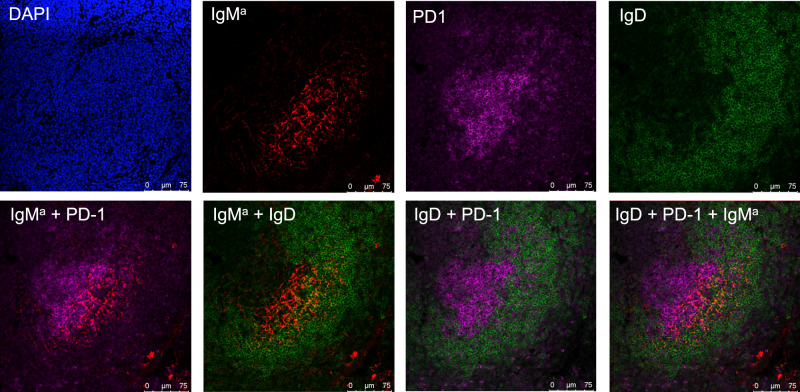
CTLA-4 is an important regulator of T-cell function. Here, we report that expression of this immune-regulator in mouse B-1a cells has a critical function in maintaining self-tolerance by regulating these early-developing B cells that express a repertoire enriched for auto-reactivity. Selective deletion of CTLA-4 from B cells results in mice that spontaneously develop autoantibodies, T follicular helper (Tfh) cells and germinal centers (GCs) in the spleen, and autoimmune pathology later in life. This impaired immune homeostasis results from B-1a cell dysfunction upon loss of CTLA-4. Therefore, CTLA-4-deficient B-1a cells up-regulate epigenetic and transcriptional activation programs and show increased self-replenishment. These activated cells further internalize surface IgM, differentiate into antigen-presenting cells and, when reconstituted in normal IgH-allotype congenic recipient mice, induce GCs and Tfh cells expressing a highly selected repertoire. These findings show that CTLA-4 regulation of B-1a cells is a crucial immune-regulatory mechanism.


Conflict of interest statement

C.W. and J.H. are co-founders of iRepertoire. M.P.S. is cofounder and a member of the scientific advisory board of Personalis, Qbio, January, SensOmics, Protos, Mirvie, Oralome. M.P.S. is on the scientific advisory board of Danaher, Genapsys, and Jupiter. The other authors declare no competing interests.

Figures

Fig. 1
Fig. 1. CTLA-4 is selectively expressed by B-1 cells within the resting B-cell compartment.
a Ctla4 expression by mature B-cell subsets in adult C57BL/6J mice (2–3 months old) was measured by qRT-PCR. B-cell subsets were phenotypically defined as: B-1a, CD19+ IgMhi IgDlo/− CD21lo/− CD43+ CD5+; B-1b, CD19+ IgMhi IgDlo/− CD43+ CD5neg; MZB, CD19+ IgMhi IgDlo/− CD21hi CD43neg CD5neg; FOB and peritoneal B-2, CD19+ IgMlo IgDhi CD43neg CD5neg; PCs, CD19+ IgDneg CD138+ CD267+. Ctla4 expression levels are shown as the data relative to the Ctla4 level expressed by splenic CD3+ CD4+ CD25+ Treg cells (>90% Foxp3+) using comparative CT method 2–∆∆CT. Each dot represents data for an individual mouse, n = 5–9 mice per subset. *p < 0.003, **p < 0.007, ***p < 0.001, ****p < 0.002. b Ctla4 expression by splenic B-1a (sB-1a) and non B-1a cells in neonatal, young or adult mice was measured by qRT-PCR. D, day, W, week, M, month. FACS gating is shown in Supplementary Fig. 1B. Ctla4 expression levels are shown as the data relative to the Ctla4 level expressed by adult sB-1a. n = 5–7 mice per group, *p < 0.001, **p < 0.003, ***p < 0.006, ns, not significant (p < 0.5). c CTLA-4 expression by sB-1a, peritoneal B-1a (pB-1a), FOB, MZB, peritoneal B-2 (pB-2), and splenic Treg (sTeg) cells from indicated mice were measured by intracellular CTLA-4 FACS analysis. FACS gating is shown in Supplementary Fig. 1C. y axis shows surface CD5 expression for B-cell subsets and intracellular Foxp3 expression for sTreg cells, x axis shows data for cells stained with phycoerythrin (PE)-conjugated anti-CTLA-4 or isotype control antibodies. d Data summarizing independent FACS analyses (n = 6) is shown, each dot represents data for an individual mouse. y axis shows ratio of medium fluorescent intensity (MFI) values of the indicated B-cell subsets stained with PE-conjugated anti-CTLA-4 vs. isotype control antibody. *p < 0.0001, **p < 0.03, ***p < 0.01, ****p < 0.05, *****p < 0.007, ns, not significant (p < 0.6). Box plots in a, b, d: box draws 75% (upper), 50% (center line), and 25% (down) quartile, the maxima and minima outliers are shown as top and bottom line, respectively. Statistical significance was tested using nonparametric Wilcoxon one-way test.
Fig. 2
Fig. 2. B-1a cells in CKO mice show increased self-replenishment and upregulate activation gene programs.
a Control or CKO mice were fed with BrdU-containing water for 6 days and BrdU incorporation (BrdU+) by splenic and peritoneal B-1a cells in these mice was measured by FACS analysis. B-1a cells were gated as CD19+ IgMhi IgDlo/neg CD21lo/neg CD43+ CD5+. Data summarizing the percentages of BrdU+ cells in sB-1a or pB-1a cells for five independent experiments is shown. Each dot represents data for an individual mouse. *p < 0.01, **p < 0.006, nonparametric Wilcoxon one-way test. b sB-1a, pB-1a, and GC B (CD19+ CD95+ CD38neg) cells in control or CKO mice were sorted and then sequenced to obtain their IgH transcripts. The percentages of IgH transcripts containing >5 nucleotide changes and the mutation rate for each population are shown, n = 4–5 biologically independent samples per subset, each sample was from an individual mouse, *p < 0.01, **p < 0.02, nonparametric Wilcoxon one-way test. c Circular visualization graph shows the selected GO terms for differentially expressed genes between splenic B-1a cells in control and CKO mice. Each dot in the outer circle represents an individual upregulated (red) or downregulated (blue) gene. Genes of the same functional term are grouped together and the detail of each group is shown in the right table. The colored bars in the inner circle summarize the median folds change of the genes sharing the same functional term. d Heat-map shows the expression levels of listed genes measured by RNA-seq. Each row represents data of an individual gene. Genes with the same functional terms are grouped together. Each column represents data for an individual splenic IgMhi B-1a cell sample from control or CKO mice. All mice are 2–3 months old. Box plots in a, b: box draws 75% (upper), 50% (center line) and 25% (down) quartile, the maxima and minima outliers are shown as top and bottom line, respectively.
Fig. 3
Fig. 3. T-dependent GC responses and Tfh cells arise spontaneously in spleens of CKO mice.
a Spleen cells from indicated mice were analyzed by FACS. Live myeloidneg CD3neg CD19+ splenic B cells were gated to show IgMneg IgDneg B cells, which were further gated to reveal IgG1+ cells. b Data summarizing the numbers of GC B cells (CD19+ CD38neg CD95+) in spleens of control, heterozygous and CKO mice treated with indicated antibodies is shown. Each dot represents data for an individual mouse, n = 4–6 mice per mouse group. *p < 0.01, ns, not significant (p < 0.1), nonparametric Wilcoxon one-way test. c Live myeloidneg CD19neg CD3+ CD4+ splenic T cells from indicated mice were gated to show PD-1, CXCR5, ICOS, and intracellular Foxp3 expression. Fluorescent minus one (FMO) staining, in which the fluorescent anti-CXCR5 antibody was omitted from the staining cocktail, is used to define CXCR5-expressing cells. FACS histogram on the right shows the intracellular Bcl6 expression by Tfh (PD-1hi CXCR5+, red line) and non-Tfh cells (PD-1neg CXCR5neg, blue line) in CKO mice. d Data summarizing numbers of Tfh cells (CD3+ CD4+ PD-1hi CXCR5+) in spleens of each mouse group is shown, n = 5–9 mice per mouse group, *p < 0.001, **p < 0.003, ns, not significant (p < 0.1), All mice are 2–3 months old. Box plots in c, b: box draws 75% (upper), 50% (center line), and 25% (down) quartile, the maxima and minima outliers are shown as top and bottom line, respectively.
Fig. 4
Fig. 4. CKO mouse serum contains autoantibodies to dsDNA, nuclear antigen, and glycan autoantigens.
a IgG and IgE levels in serum of age-indicated control or CKO mice were measured by Elisa, n = 6–8 mice per mouse group, *p < 0.03, **p < 0.001, ***p < 0.006, ****p < 0.002, ns, not significant (p < 0.2), nonparametric Wilcoxon one-way test. b Anti-dsDNA IgG and IgE levels in serum of age-indicated CKO and control mice were measured by Elisa, n = 5–8 mice per mouse group, *p < 0.05, **p < 0.03, ***p < 0.02, nonparametric Wilcoxon one-way test. c Anti-nuclear antigen (ANA) autoantibody in serum of CKO or control mice (7–14 months old) was tested, n = 8 mice per mouse group. Representative data for four mice from each group are shown. None (0/8) of the control mice and 5/8 of CKO mice show positive for ANA. d Anti-glycan IgG and IgM autoantibodies in serum of control or CKO mice were measured by carbohydrate microarray assay. Overlay plots of anti-glycan autoantibody IgG (upper) and IgM (lower) profiles of serum from four control or CKO mice (>7-month-old) are shown. Each symbol represents data of IgG or IgM reacting to an individual glycan antigen for an individual mouse serum. y-axis: the mean values of triplicate microspot detections of individual sera sample for each antigen, x-axis: corresponding ID of glycan antigens. Oligo-mannoses (#8–34), asialo- and aglacto-glycans(#3–6), O-glycan core-based autoantigens (#43–44), Man1Gn2Asn (#8), Man9Gn2Asn (#24), Glc1Man9 (#32), GlcNAc-RB (#36). Information of each glycan antigen is shown in Supplementary Table 6. The mean values of background microspots (Bg) of each staining are shown in the rightmost of X axis in each graph. Box plots in a, b: box draws 75% (upper), 50% (center line), and 25% (down) quartile, the maxima and minima outliers are shown as top and bottom line, respectively.
Fig. 5
Fig. 5. IgMhi B-1a cells in CKO mice internalize surface IgM and start expressing the pre-GC APC phenotype.
a Live myeloidneg CD3neg CD19+ splenic B cells in control or CKO mice were gated to show IgM and IgD expression. IgMhi IgDlo/neg, IgMint IgDneg, and IgMneg IgDneg B cells in CKO mice were gated to reveal IgMhi, IgMint, and IgMneg B-1a cells, based on CD5 and CD43 expression. Two FMO stainings were used to define IgM and CD5 positive cells. FACS histogram on the left shows the intracellular IgM level in IgMneg B-1a cells (red line) and IgM-secreting PCs (IgDneg CD138+) (gray line). Blue line shows the surface IgM staining level in IgMneg B-1a cells that were stained with anti-IgM antibody before fixation and permibilization. b FACS plots shows cells expressing the differentiated CD95+ CD38lo GL7+ CD150+ phenotype in IgMhi, IgMint, and IgMneg B-1a cells from CKO mice. c Data summarizing the percentage of CD95+ CD38lo GL7+ CD150+ cells in IgMhi, IgMint and IgMneg B-1a cells from control and CKO mice is shown. Each dot represents data for an individual mouse, n = 7–10 mice per subset, *p < 0.001, **p < 0.002, ns, not significant (p < 0.2), nonparametric Wilcoxon one-way test. d IgMhi B-1a and IgMneg B-1a cells from CKO mouse were sorted and then sequenced to obtain their IgH transcripts. Data summarizing the frequencies of IgH sequences containing >5 nucleotide changes and the mutation rate of each sample is shown, n = 7 samples per group with each sample from an individual mouse. Data for IgMhi B-1a and IgMneg B-1a cells from the same mouse are connected. *p < 0.001, nonparametric Wilcoxon one-way test. All mice are 2 months old. Box plots in c, d: box draws 75% (upper), 50% (center line), and 25% (down) quartile, the maxima and minima outliers are shown as top and bottom line, respectively.
Fig. 6
Fig. 6. IgMneg B-1a in CKO mice express a highly coordinated gene program indicating a function shift to APCs.
a Heat-map shows the expression levels of the selected genes measured by RNA-seq. Row-rise standardization was performed for visualization purpose. Each row represents data of an individual gene. Genes of the same functional terms are grouped together. Each column represents the data of each indicated B-1a sample. b Circular visualization graph shows the selected GO terms for differentially expressed genes between sB-1a from control and CKO mice. Each dot in the outer circle represents an individual upregulated gene. Genes of the same functional term are grouped together and the detail of each group is shown at the right table. In the inner circle, the colored bars summarize the median fold change of the genes sharing the same functional term.
Fig. 7
Fig. 7. CTLA-4-deficient B-1a cells and their IgMneg decedents induce Tfh cells and GCs in congenic recipients.
a Live CD4+ T cells and CD19+ B cells from spleens of indicated mice were gated to reveal Tfh (PD-1hi ICOS+) and GC B (CD95hi CD38neg) cells, respectively. b Data summarizing the numbers of Tfh and GC B cells in spleens of indicated mouse groups is shown, n = 7–10 mice per group. Each dot represents data for an individual mouse, *p < 0.003, **p < 0.0002, ***p < 0.002, ****p < 0.0003, *****p < 0.004, ns, not significant (p < 0.2), nonparametric Wilcoxon one-way test. About 5 × 106 of peritoneal B-1a (pB-1a) and 2 × 105 of IgMneg splenic B-1a (sB-1a) cells were transferred. c TCRβ CDR3 tree-map plots (upper) illustrate the CDR3 nucleotide sequences expressed by non-Tfh T and Tfh cells from indicated mice. One representative plot from four or six independent T-cell samples is shown. Each rectangle in a given tree-map represents a unique CDR3 nucleotide sequence and the size of each rectangle denotes the relative frequency of an individual CDR3 sequence. The box plot summarizes the D50 metric analysis that quantifies TCRβ CDR3 nucleotide sequence diversity for each T-cell sample from indicated mouse group. Each dot represents data for a T-cell sample from an individual mouse, n = 4–6 T-cell samples per group, *p < 0.006, ns, not significant (p < 0.2), nonparametric Wilcoxon one-way test. Low D50 values are associated with less TCRβ CDR3 diversity. Sequence information for each T-cell sample is summarized in supplementary Table 3. d Live myeloidneg CD3neg CD19+ splenic B cells from indicated CB.17 mice were gated to reveal GC B cells (CD19+CD95+GL7+), which were further gated to show IgG1, IgG1b and IgG1a surface expression. Statistical summary for five independent experiments is shown in Supplementary Table 5. Box plots in b, c: box draws 75% (upper), 50% (center line) and 25% (down) quartile, the maxima and minima outliers are shown as top and bottom line, respectively.
Fig. 8
Fig. 8. CTLA-4-deficient B-1a cells are localized in close association with FDCs in transfer recipient spleen.
Spleen sections of recipients that have been received peritoneal B-1a cells from CTLA-4 B-cell CKO mice were analyzed by immunofluorescence confocal microscopy. Representative immunofluorescence images of the section stained with indicated individual reagent are shown in the upper and images of two or three-color composites are shown in the bottom.

References

    1. Hardy RR, Kincade PW, Dorshkind K. The protean nature of cells in the B lymphocyte lineage. Immunity. 2007;26:703–714. doi: 10.1016/j.immuni.2007.05.013. - DOI - PubMed
    1. Baumgarth N. The double life of a B-1 cell: self-reactivity selects for protective effector functions. Nat. Rev. Immunol. 2011;11:34–46. doi: 10.1038/nri2901. - DOI - PubMed
    1. Kantor AB, Herzenberg LA. Origin of murine B-cell lineages. Annu Rev. Immunol. 1993;11:501–538. doi: 10.1146/annurev.iy.11.040193.002441. - DOI - PubMed
    1. Herzenberg LA, Herzenberg LA. Toward a layered immune system. Cell. 1989;59:953–954. doi: 10.1016/0092-8674(89)90748-4. - DOI - PubMed
    1. Hayakawa K, Hardy RR, Herzenberg LA. Progenitors for Ly-1 B cells are distinct from progenitors for other B cells. J. Exp. Med. 1985;161:1554–1568. doi: 10.1084/jem.161.6.1554. - DOI - PMC - PubMed

Publication types

MeSH terms