. 2021 Jan 22;12(1):520.
doi: 10.1038/s41467-020-20848-z.

RUNX1/RUNX1T1 mediates alternative splicing and reorganises the transcriptional landscape in leukemia

Affiliations

RUNX1/RUNX1T1 mediates alternative splicing and reorganises the transcriptional landscape in leukemia

Vasily V Grinev et al. Nat Commun. .

Abstract

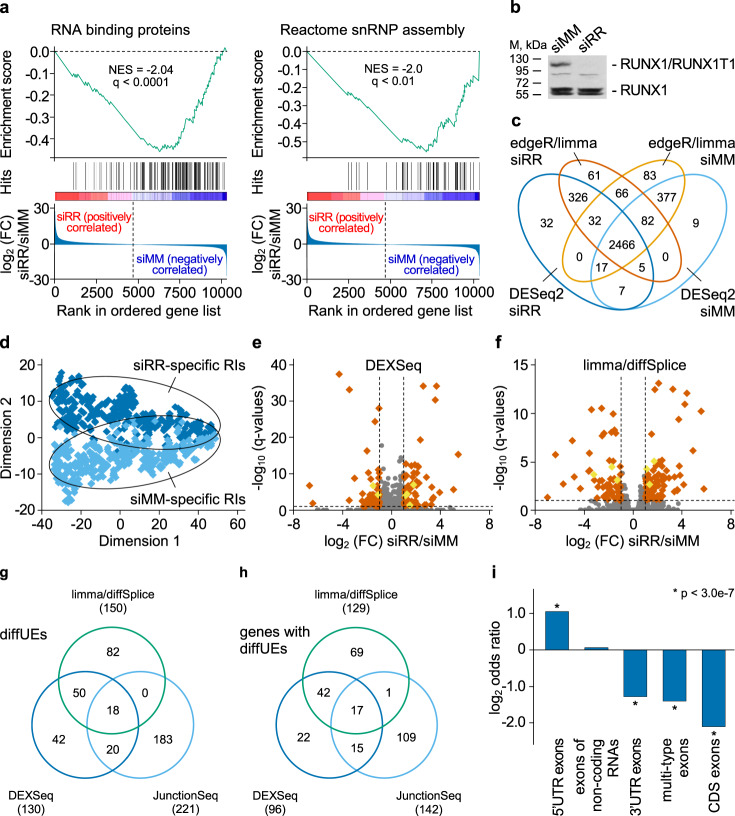
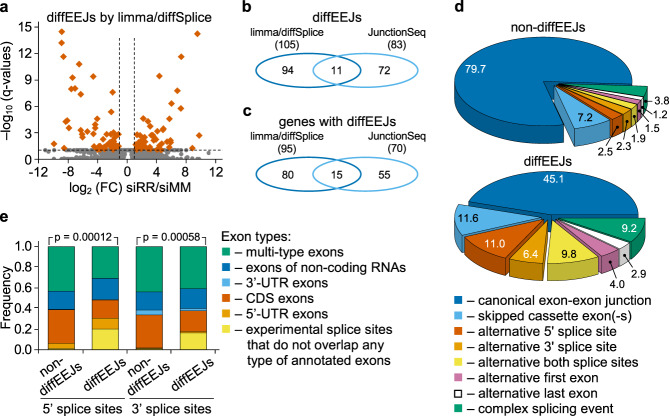
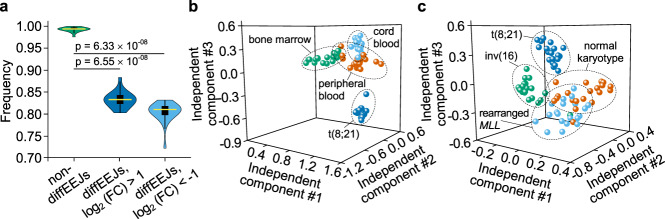
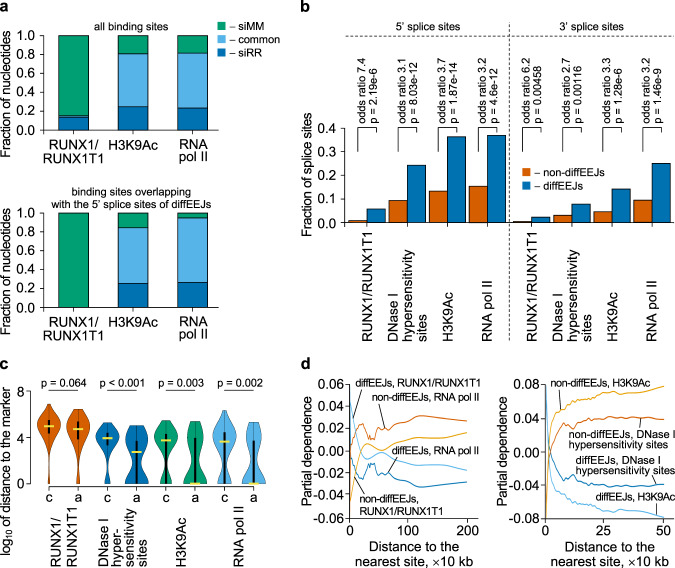
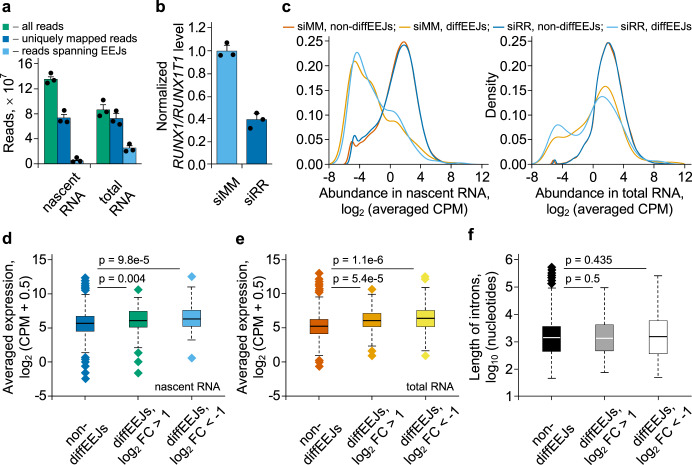
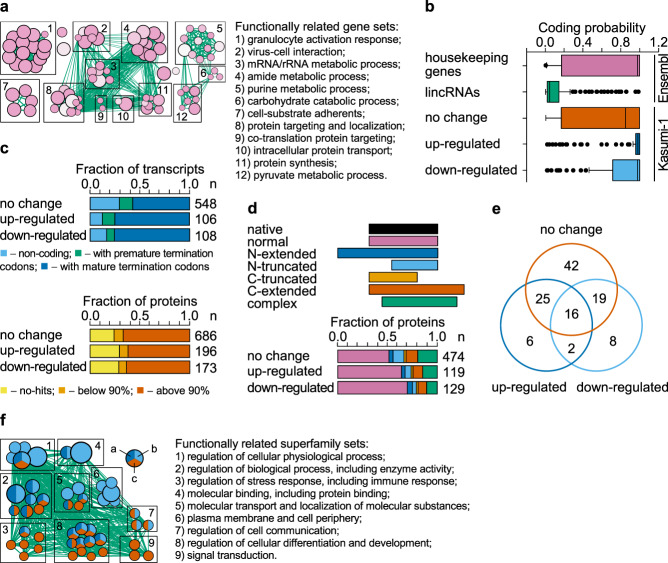
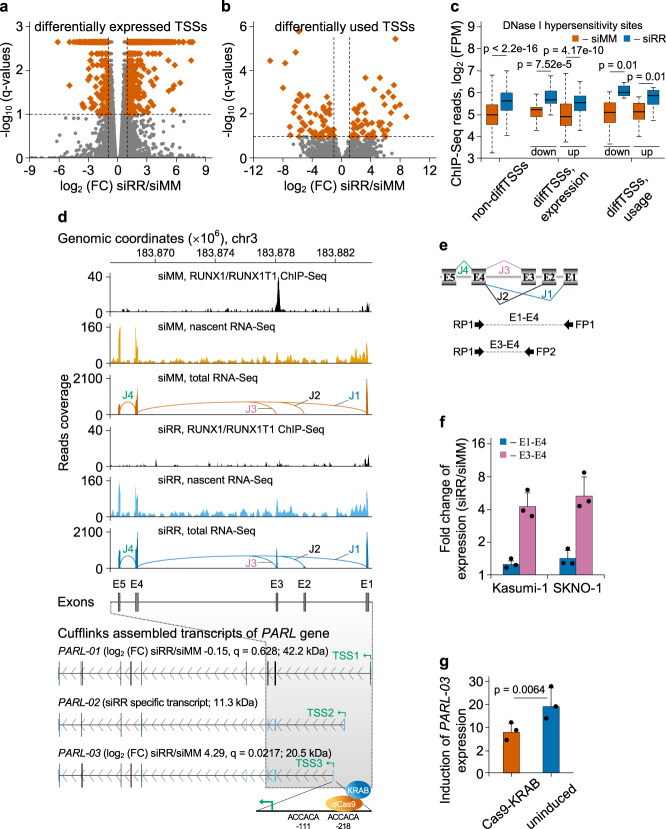
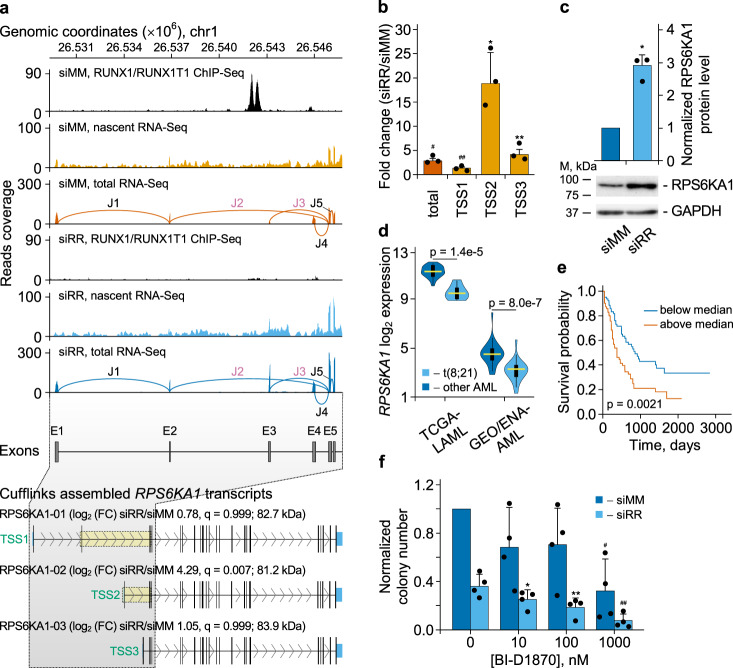
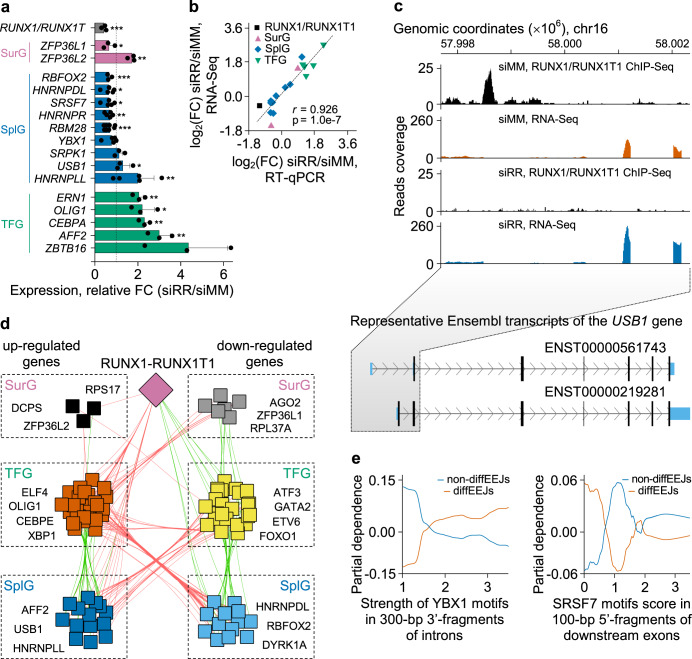
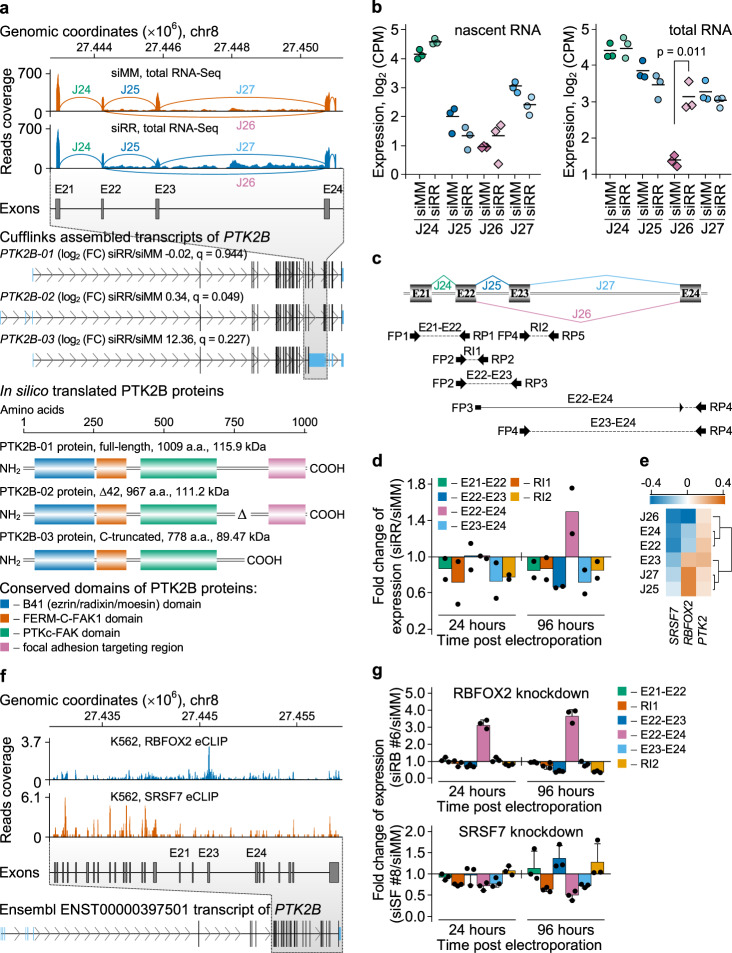
The fusion oncogene RUNX1/RUNX1T1 encodes an aberrant transcription factor, which plays a key role in the initiation and maintenance of acute myeloid leukemia. Here we show that the RUNX1/RUNX1T1 oncogene is a regulator of alternative RNA splicing in leukemic cells. The comprehensive analysis of RUNX1/RUNX1T1-associated splicing events identifies two principal mechanisms that underlie the differential production of RNA isoforms: (i) RUNX1/RUNX1T1-mediated regulation of alternative transcription start site selection, and (ii) direct or indirect control of the expression of genes encoding splicing factors. The first mechanism leads to the expression of RNA isoforms with alternative structure of the 5'-UTR regions. The second mechanism generates alternative transcripts with new junctions between internal cassettes and constitutive exons. We also show that RUNX1/RUNX1T1-mediated differential splicing affects several functional groups of genes and produces proteins with unique conserved domain structures. In summary, this study reveals alternative splicing as an important component of transcriptome re-organization in leukemia by an aberrant transcriptional regulator.


Conflict of interest statement

The authors declare no competing interests.

Figures

Fig. 1
Fig. 1. Knockdown of RUNX1/RUNX1T1 affects exon usage in Kasumi-1 cells.
a Gene set enrichment analysis plots for RNA binding proteins and the Reactome snRNP assembly pathway. NES, normalized enrichment score; q, false discovery rate. b Western blot of RUNX1 and RUNX1/RUNX1T1 protein levels in Kasumi-1 cells following RUNX1/RUNX1T1 knockdown. A representative result from one of the three experiments is shown. siMM, mismatch siRNA; siRR, RUNX1/RUNX1T1 siRNA. c Distribution of retained introns (RIs) between the transcriptomes of the siRR-treated and siMM-treated Kasumi-1 cells. The RIs were detected using the DESeq2 and edgeR/limma algorithms. d Scatter plot showing the distribution of siRR-specific and siMM-specific RIs after multidimensional reduction of RIs expression data using t-distributed stochastic neighbor embedding. The RIs were detected using the edgeR/limma algorithm, and very similar results were observed with DESeq2. e, f Vulcano plots showing differential usage of exons identified by DEXSeq e or limma/diffSplice f algorithms. Orange and yellow rhombi indicated differentially used canonical exons or RIs, respectively, with more than 2-fold change and q < 0.1. g Venn diagram showing overlap between differentially used exons (diffUEs) identified by DEXSeq, limma/diffSplice and JunctionSeq algorithms. h Venn diagram showing overlap of genes with diffUEs identified by the DEXSeq, limma/diffSplice and JunctionSeq algorithms. i Classification of diffUEs according to the functional type of exons. Genomic coordinates of the reference exons were extracted from Ensembl models of the human genes. diffUEs were intersected with reference exons and the overlaps counted. Fisher’s two-sided exact test was performed to detect over-represented or under-represented exon types among the diffUEs against non-differential exons (non-diffUEs).
Fig. 2
Fig. 2. Knockdown of RUNX1/RUNX1T1 causes changes in exon-exon linkages in leukemic cells.
a Vulcano plot showing differential splicing of exons identified by limma/diffSplice algorithm. Orange rhombi indicated differentially used exon-exon junctions (diffEEJs) with more than 2-fold change and q < 0.1. b Venn diagramme showing the overlap between diffEEJs identified by limma/diffSplice and JunctionSeq algorithms. c Venn diagramme showing overlap of genes with diffUEs identified by limma/diffSplice and JunctionSeq algorithms. d Pie charts showing the classification of diffEEJs and non-differential exon-exon junctions (non-diffEEJs) according to the modes of alternative splicing. Numbers indicate the percentage of splicing events assigned to a particular mode of splicing. Complex splicing means several (two or more) alternative splicing events occurred simultaneously. e Distribution of the splice sites with diffEEJs and non-diffEEJs among the various functional types of exons. P-values were calculated with χ2 test. Panels a to e are based on data from Kasumi-1 cells.
Fig. 3
Fig. 3. RUNX1/RUNX1T1-associated alternatively spliced variants are distinctive features in primary leukemia samples.
a Violin plot showing the enrichment level of Kasumi-1 exon-exon junctions in the transcriptome of primary t(8;21)-positive leukemia blasts from 20 patient samples. P-values were calculated with two-sided Mann–Whitney U test. b, c Independent component analysis of t(8;21)-positive AML cells with normal CD34-positive cells b or other AML subtypes c. This analysis included 20 samples of each cell type. For each sample, the expression of 84,743 exon-exon junctions was quantified.
Fig. 4
Fig. 4. RUNX1/RUNX1T1-dependent differential splicing events in Kasumi-1 cells are associated with open chromatin.
a Column graph showing the distribution of RUNX1/RUNX1T1, H3K9Ac and RNA pol II occupied sites with or without RUNX1/RUNX1T1 knockdown. The top panel shows the distribution for all sites, the bottom panel only shows distribution of binding sites overlapping with the 5’ splice sites of diffEEJs. b Association of diffEEJs splice sites with open chromatin. P-values were calculated with Fisher’s two-sided exact test. c Violin graph depicting the positional relationships between canonical (c; n = 117) and alternative (a; n = 57) 5’ splice sites of diffEEJs and marks of open chromatin. P-values were calculated with two-sided Mann–Whitney U test. Yellow horizontal thick lines represent the median of distances distribution, the black vertical rectangular boxes show the interquartile range, and the black vertical lines are the 95% confidential interval. d Effect of the proximity to RUNX1/RUNX1T1 binding sites, RNA pol II peaks, H3K9Ac histone modifications and DNase I hypersensitivity sites on the probability of the diffEEJs and non-diffEEJs in the transcriptome of leukemia cells.
Fig. 5
Fig. 5. Formation of diffEEJs in Kasumi-1 cells is delayed compared to non-diffEEJs.
a The basic alignment statistics for the nascent RNA and total RNA datasets obtained from the siMM-treated leukemia cells. Bars represent mean ± SD of three independent experiments. Very similar results were observed with siRR-treated cells. b siRNA-mediated knockdown of RUNX1/RUNX1T1 as measured by nascent RNA expression. Bars represent mean ± SD of three independent experiments. c Multidensity plots of the abundance of EEJs identified in the nascent RNA (left panel) or total RNA (right panel). These plots are based on the RNA-Seq data obtained from the siMM-treated or siRR-treated leukemia cells. All EEJs identified at the level of nascent RNA and total RNA were grouped (see main text for further explanation of classification procedure) into non-diffEEJs or diffEEJs, and the abundance of these events was plotted. Each line represents the data averaged over the three independent biological replicas. d Expression of genes without (non-diffEEJs genes, n = 10851) or with differential splicing (upregulated or downregulated diffEEJs genes, n = 85) at nascent RNA level. e Expression of genes without (non-diffEEJs genes, n = 9836) or with differential splicing (upregulated or downregulated diffEEJs genes, n = 150) at total RNA level. f Comparison of intron lengths between non-diffEEJs (n = 104925) and diffEEJs (n = 177). In d, e, and f, boxplots summarize the expression data averaged over the three independent biological replicas. In each boxplot, horizontal line represents the median of expression distribution, box shows the interquartile range, and whiskers are the minimum and maximum. P-values were calculated with two-sided Mann–Whitney U test.
Fig. 6
Fig. 6. Fusion protein-controlled differential splicing expands the protein space.
a Enrichment map of the Gene Ontology-enriched gene sets across all the genes with differential expression and/or differential splicing. Nodes represent significantly enriched gene sets and node size is proportional to the number of members in a gene set. Edges indicate the gene overlap between the nodes, and the thickness of the edges is equivalent to the degree of the gene overlap between the nodes. Functionally related gene sets are clustered and named. b Box plot depicting the coding potential of 500 randomly selected transcripts each from housekeeping genes and lincRNA genes, and all 752 transcripts of genes affected by differential splicing in Kasumi-1 cells. In each boxplot, horizontal line represents the median of probability distribution, box shows the interquartile range, and whiskers are the minimum and maximum. c Column graphs depicting the classification of coding sequences in transcripts (upper panel) and of in silico translated proteins (lower panel) affected by differential splicing. In the upper panel, all transcripts were classified on non-coding (no significant open reading frames were found), protein-coding with premature termination codons and protein-coding with mature termination codons. In the bottom panel, all protein-coding transcripts were in silico translated and predicted proteins were blastp aligned against non-redundant set of human proteins. Protein identities are indicated at the bottom. d Column graphs showing the impact of RUNX1/RUNX1T1 on the frequency of protein variants. e Venn diagramme visualizing the distribution of the 118 domain superfamilies among the in silico predicted proteins. f Enrichment map of the domain-centered Gene Ontology-enriched superfamily sets across all the genes with differential splicing. Nodes represent significantly enriched superfamily sets and node size is proportional to the number of members in a superfamily set. Edges indicate the superfamily overlap between the nodes, and the thickness of the edges is equivalent to the degree of the superfamily overlap between the nodes. Functionally related superfamily sets are clustered and named. Pie chart coloring: (a) upregulated, (b) downregulated, and (c) no change.
Fig. 7
Fig. 7. RUNX1/RUNX1T1 affects differential splicing by controlling alternative transcription start sites (TSSs).
a Vulcano plot of the differential expression from various TSSs in the genome of Kasumi-1 cells following RUNX1/RUNX1T1 knockdown. Differentially expressed TSSs (at least 2-fold change in expression, p < 0.005, q < 0.1) are shown by vermilion squares. b Differential usage of alternative TSSs in the genome of Kasumi-1 cells after RUNX1/RUNX1T1 knockdown. Differentially used TSSs (at least 2-fold change in expression, p < 0.0007, q < 0.1) are shown by vermilion squares. c Enrichment of DNase I hypersensitivity site-Seq reads in the genomic regions surrounding the non-differential TSSs, differentially expressed TSSs or differentially used TSSs. In this analysis, only TSSs genomic regions that overlap the RUNX1/RUNX1T1 binding peaks were used. In each boxplot, horizontal line represents the median of expression distribution, box shows the interquartile range, and whiskers are the minimum and maximum. P-values were calculated with two-sided Mann–Whitney U test. d IGV screen shot showing the RUNX1/RUNX1T1 binding and RNA reads from nascent and total RNA-Seq at the 5’-terminal region of PARL locus for siMM-treated and siRR-treated Kasumi-1 cells. Exons and exon-exon junctions are designated by the letters E and J, respectively, and numbered. Differentially used junction J3 is highlighted in purple. Bottom scheme depicting Cufflinks assembled representative full-length transcripts of PARL gene expressed in Kasumi-1 cells. For each transcript, Cuffdiff based log2 (FC) siRR/siMM and q-values, as well as the size of in silico predicted proteins are indicated in parentheses. In addition, the positions of the Cuffdiff determined transcription start sites are also shown. At the bottom of panel, the scheme showing target location of dCas9-KRAB which was targeted to the second RUNX1 consensus site. e Schematic representation of primer binding positions for qPCR-based validation of the differential splicing in PARL gene. The structure of expected amplicons is shown at the bottom of the figure. f qPCR-based validation of the differential splicing of PARL transcripts under the two siRNA treatment conditions in the transcriptome of two t(8;21)-positive cell lines. Bars represent mean ± SD of three independent experiments. g Induction of PARL-03 transcription after RUNX1/RUNX1T1 knockdown with or without induction of dCas9-KRAB. Bars represent mean ± SD of three independent experiments. P-value was calculated with two-sided Student’s t test.
Fig. 8
Fig. 8. Knockdown of RUNX1/RUNX1T1 leads to differential splicing of RPS6KA1 transcripts in Kasumi-1 cells.
a IGV screen shot showing the RUNX1/RUNX1T1 binding and RNA reads from nascent and total RNA-Seq at the 5’-terminal region of RPS6KA1 locus for siMM-treated and siRR-treated Kasumi-1 cells. E, exons; J, exon-exon junctions. Bottom scheme depicting RPS6KA1 transcripts. diffEEJs are boxed and highlighted in yellow. b qPCR-based quantitation of the change in the activity of various transcription start sites of RPS6KA1 gene following RUNX1/RUNX1T1 knockdown. The overall expression level (“total”) of RPS6KA1 gene is also indicated. *p = 0.029, **p = 0.025, #p = 0.022, and ##p = 0.014 with one-tailed one sample Student’s t-test. Bars represent mean ± SD of three independent experiments. c Knockdown of RUNX1/RUNX1T1 leads to statistically significant (p = 0.00504 (*)) changes in the RPS6KA1 protein level in leukemic cells. P-value was calculated using one-tailed one sample Student’s t-test with μ0 = 1. Bars represent mean ± SD of three independent experiments. d Differential expression of RPS6KA1 gene in t(8;21) positive and negative AMLs. Gene expression levels were taken from the TGCA-LAML (n = 173) and GEO/ENA-AML (n = 80) datasets. For the TGCA-LAML dataset, RSEM values of normalized gene expression were used. Normalized expression of genes from GEO/ENA-AML dataset was calculated as RPKM. In each violin plot, horizontal yellow line represents the median of expression distribution, box shows the interquartile range, and whiskers are the minimum and maximum. P-values were calculated with two-sided Mann–Whitney U test. e Survival of AML patients depending on expression of RPS6KA1 gene. This survival plot is based on TCGA-LAML dataset (n = 173). The dependence of patient survival on gene expression was calculated according to the Cox proportional hazards regression model. f Impact of RPS6KA1 inhibition on clonogenicity of t(8;21) AML cells. Kasumi-1 cells were electroporated with the indicated siRNAs followed by plating into semisolid medium containing the indicated concentrations of RPS6KA1 inhibitor. Data was normalized relative to clonogenicity of the siMM electroporated and BI-D1870 untreated leukemia cells. Bars represent mean ± SD of four independent experiments. *p = 0.053, **p = 0.012, #p = 0.008, and ##p = 0.001 with one-tailed Student’s t-test against respective baseline in untreated cells.
Fig. 9
Fig. 9. RUNX1/RUNX1T1 indirectly affects differential splicing in Kasumi-1 cells.
a Bar graph showing the impact of RUNX1/RUNX1T1 knockdown on the expression of mRNA surveillance genes (SurG), genes encoding splicing factors (SplG) and transcription factors genes (TFG) associated with splicing. Bars represent mean ± SD of three independent qPCR experiments. *p < 0.05, **p < 0.01, ***p < 0.001 with one-tailed Student’s t test. b Graph showing correlation between RNA-seq and q-PCR validation of differential RNA processing gene expression. c IGV screen shot depicting RUNX1/RUNX1T1 binding and RNA-Seq reads for the USB1 locus. d Cytoscape scheme showing RUNX1/RUNX1T1-centered gene regulatory network of genes encoding splicing regulators and mRNA surveillance factors. Terms “upregulated genes” and “downregulated genes” refer to a change in the expression of the genes after RUNX1/RUNX1T1 knockdown. Positively and negatively co-expressed genes linked by green and red edges, respectively. Examples of the genes from each group are shown in the respective dashed boxes. e Effect of the strength of the motifs to splicing factors on the probability of non-diffEEJs and diffEEJs in leukemia cells. These partial dependence plots are based on the results from 1,000 independent runs of the random forest meta-classifier and 1000 classification trees per random forest per run.
Fig. 10
Fig. 10. RUNX1/RUNX1T1 controls alternative splicing of PTK2B transcripts in t(8;21)-positive leukemia cells.
a Splicing graphs, representative Cufflinks assembled transcripts and in silico translated proteins of PTK2B gene. This panel is based on Kasumi-1 total RNA-Seq data. Exons and exon-exon junctions are designated by the letters E and J, respectively, and numbered. Differentially used junction J26 is highlighted in purple. For each transcript, Cuffdiff based log2 fold changes in expression and respective q-values are indicated in parentheses. a denotes amino acids. b Strip charts demonstrating normalized expression of exon-exon junctions J24 to J27 in Kasumi-1 cells. Genomic location of junctions is shown in a. Horizontal lines are arithmetic means. P-value was calculated with two-sided Student’s t test. c and d qPCR-based validation of the differential splicing of PTK2B transcripts under two siRNA treatment conditions. Binding positions of primers and structure of the expected amplicons are shown in c. Bars in d represent mean of two independent qPCR experiments. e Pearson correlation heatmap demonstrating relationship between expression of the SRSF7, RBFOX2, or PTK2 genes and splicing events in the PTK2B gene. This map is based on TCGA-LAML dataset (n = 173). f RBFOX2 and SRSF7 proteins bind PTK2B gene. This genome browser snapshot is based on ENCODE eCLIP data. g Effect of the siRNA-mediated knockdown of RBFOX2 and SRSF7 expression on splicing of the PTK2B gene in Kasumi-1 cells. Bars represent mean ± SD of three independent experiments.

Similar articles

Cited by

References

    1. Baralle FE, Giudice J. Alternative splicing as a regulator of development and tissue identity. Nat. Rev. Mol. Cell Biol. 2017;18:437–451. doi: 10.1038/nrm.2017.27. - DOI - PMC - PubMed
    1. Kozlovski I, Siegfried Z, Amar-Schwartz A, Karni R. The role of RNA alternative splicing in regulating cancer metabolism. Hum. Genet. 2017;136:1113–1127. doi: 10.1007/s00439-017-1803-x. - DOI - PubMed
    1. Singh B, Eyras E. The role of alternative splicing in cancer. Transcription. 2017;8:91–98. doi: 10.1080/21541264.2016.1268245. - DOI - PMC - PubMed
    1. Adamia S, et al. A genome-wide aberrant RNA splicing in patients with acute myeloid leukemia identifies novel potential disease markers and therapeutic targets. Clin. Cancer Res. 2014;20:1135–1145. doi: 10.1158/1078-0432.CCR-13-0956. - DOI - PMC - PubMed
    1. Qiu J, et al. Distinct splicing signatures affect converged pathways in myelodysplastic syndrome patients carrying mutations in different splicing regulators. RNA. 2016;22:1535–1549. doi: 10.1261/rna.056101.116. - DOI - PMC - PubMed

Publication types

MeSH terms

Substances