. 2021 Jan 22;12(1):547.
doi: 10.1038/s41467-020-20750-8.

An integrative multiomic network model links lipid metabolism to glucose regulation in coronary artery disease

Affiliations

An integrative multiomic network model links lipid metabolism to glucose regulation in coronary artery disease

Ariella T Cohain et al. Nat Commun. .

Abstract

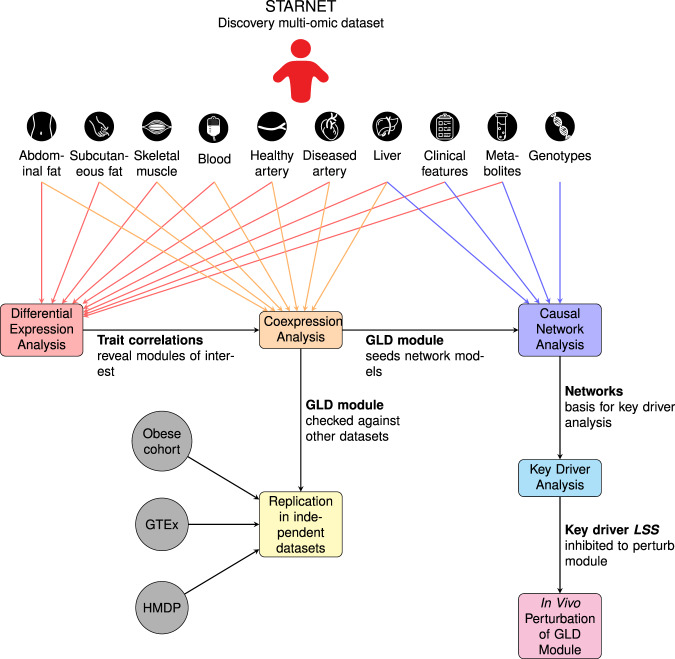
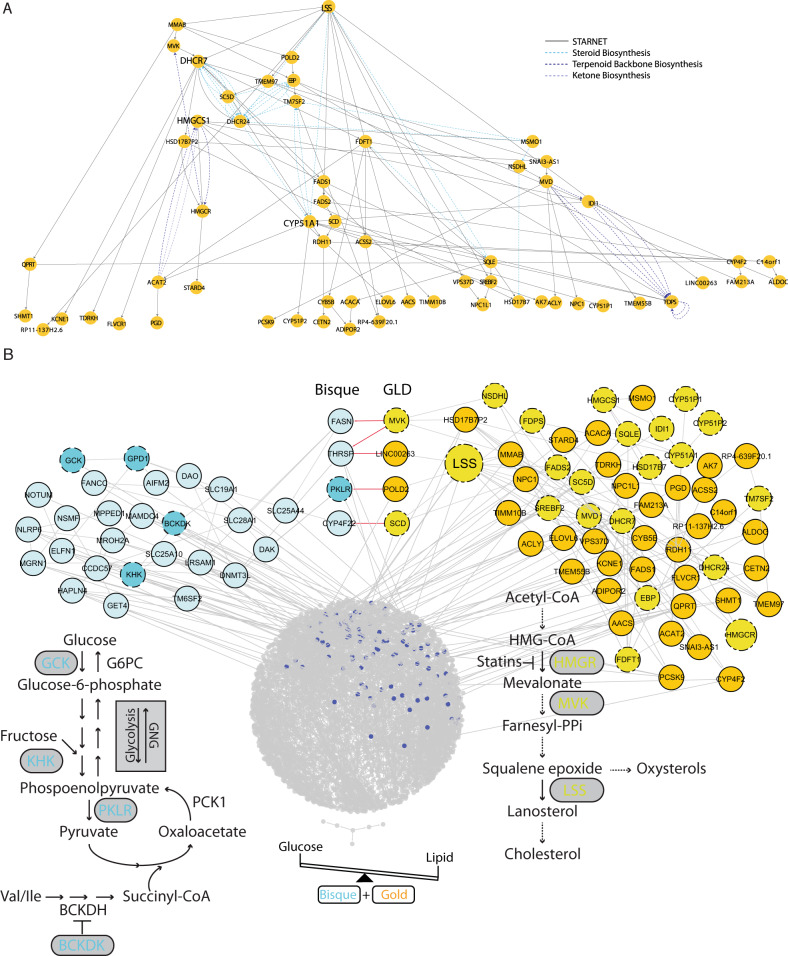
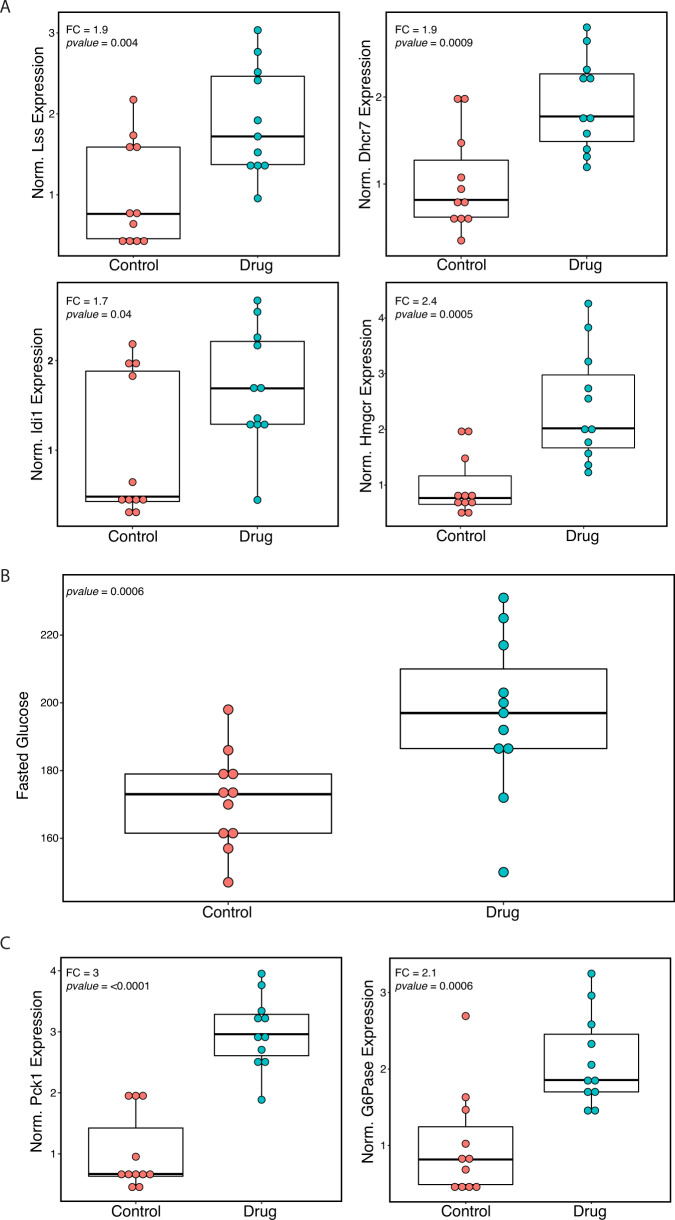
Elevated plasma cholesterol and type 2 diabetes (T2D) are associated with coronary artery disease (CAD). Individuals treated with cholesterol-lowering statins have increased T2D risk, while individuals with hypercholesterolemia have reduced T2D risk. We explore the relationship between lipid and glucose control by constructing network models from the STARNET study with sequencing data from seven cardiometabolic tissues obtained from CAD patients during coronary artery by-pass grafting surgery. By integrating gene expression, genotype, metabolomic, and clinical data, we identify a glucose and lipid determining (GLD) regulatory network showing inverse relationships with lipid and glucose traits. Master regulators of the GLD network also impact lipid and glucose levels in inverse directions. Experimental inhibition of one of the GLD network master regulators, lanosterol synthase (LSS), in mice confirms the inverse relationships to glucose and lipid levels as predicted by our model and provides mechanistic insights.


Conflict of interest statement

J.L.M.B. and AR are shareholders and part of the board of directors in Clinical Gene Networks AB (CGN). CGN has an invested interest in the STARNET database. The remaining authors declare no competing interests.

Figures

Fig. 1
Fig. 1. Schematic overview of workflow.
We first conducted differential expression analysis to identify genes whose expression is correlated with glucose and lipid traits. We then used these trait correlations in combination with a coexpression analysis to identify a GLD module that simultaneously regulates both glucose metabolism and lipid metabolism. We replicated this analysis in a mouse model and two additional human cohorts and found equivalent modules in each. We performed causal inference and key driver analysis on the GLD module to identify master regulator genes including LSS. Finally, we inhibited Lss in a mouse model to demonstrate the function of the GLD module.
Fig. 2
Fig. 2. Differential expression analysis shows genes and modules associated with glucose and lipid traits.
A The number of trait-correlated differentially expressed (DE) genes at an FDR ≤5% for each tissue and clinical traits related to lipid and glucose metabolism. The x-axis displays the tissues and y-axis is a total of all the different signatures. B The 20 modules which were enriched for lipid and glucose trait-correlated DE signatures are shown, where the x-axis and y-axis correspond to the number of lipid and glucose traits, respectively and the direction of correlation of the module’s 1st PC with the traits. Point size and text represents the total number of signatures the module is enriched for and color represents the tissue the module is found in. The areas of inverse relationship are shown in a gray box. C Correlation of the 20 modules’ 1st PC with the glucose & lipid clinical traits, color represents the direction of correlation (only FDR ≤ 5% are depicted).
Fig. 3
Fig. 3. Association of GLD module gene expression with glucose and lipid traits.
A Correlation plots for cholesterol ester component of VLDL, LDL, HDL (particle size Small), and Glucose (Glc) with the GLD module 1st PC. Linear regression line is shown in blue with equation in red. B GLD module across all individuals, those split based only on statins and those split by statins and HbA1c levels. Each module’s 1st PC was correlated with the clinical traits of interest (shown on the x-axis). Correlations in a dashed gray box represent FDR < 10%, all other correlations have an FDR <5%.
Fig. 4
Fig. 4. Probabilistic causal networks.
A Probabilistic causal network in the STARNET data for the GLD module genes only. Layout is in a hierarchical manner. As such, the nodes further towards the top are the most ‘upstream’. Bold genes are the key drivers of this network. Dashed lines represent known edges from the KEGG pathways. B Expanded GLD-focused BN looking at the connections between GLD and bisque module (colored blue).
Fig. 5
Fig. 5. Inhibition of Lss in mouse model.
A Boxplots of qPCR expression for Lss, Dhcr7, Idi1, and Hmgcr measured from liver samples of B6 mice fed either chow (control) diet or drug (BIBB515, Lss inhibitor) diet. B Boxplots of fasted glucose measured from blood at the end of 10 days of diet. C Boxplots of two key gluconeogenesis genes, PEP Carboxykinase (Pck1), and Glucose-6-Phosphatase (G6Pase), measured from qPCR of liver samples. n = 11 animals with control diet and 11 animals with drug diet. Center line, median; box limits, upper and lower quartiles; whiskers, 1.5x interquartile range; points, all individual data points.

References

    1. Beckman JA, Creager MA, Libby P. Diabetes and atherosclerosis: epidemiology, pathophysiology, and management. JAMA. 2002;287:2570–2581. doi: 10.1001/jama.287.19.2570. - DOI - PubMed
    1. Haffner SM, Lehto S, Ronnemaa T, Pyorala K, Laakso M. Mortality from coronary heart disease in subjects with type 2 diabetes and in nondiabetic subjects with and without prior myocardial infarction. N. Engl. J. Med. 1998;339:229–234. doi: 10.1056/NEJM199807233390404. - DOI - PubMed
    1. Besseling J, Kastelein JJ, Defesche JC, Hutten BA, Hovingh GK. Association between familial hypercholesterolemia and prevalence of type 2 diabetes mellitus. JAMA. 2015;313:1029–1036. doi: 10.1001/jama.2015.1206. - DOI - PubMed
    1. Lees, J. A. et al. Lipid transport by TMEM24 at ER-plasma membrane contacts regulates pulsatile insulin secretion. Science355, eaah6171 (2017). - PMC - PubMed
    1. Klarin D, et al. Genetic analysis in UK Biobank links insulin resistance and transendothelial migration pathways to coronary artery disease. Nat. Genet. 2017;49:1392–1397. doi: 10.1038/ng.3914. - DOI - PMC - PubMed

Publication types

MeSH terms