. 2021 Jan 22;12(1):523.
doi: 10.1038/s41467-020-20860-3.

A hybrid semiconducting organosilica-based O2 nanoeconomizer for on-demand synergistic photothermally boosted radiotherapy

Affiliations

A hybrid semiconducting organosilica-based O2 nanoeconomizer for on-demand synergistic photothermally boosted radiotherapy

Wei Tang et al. Nat Commun. .

Abstract

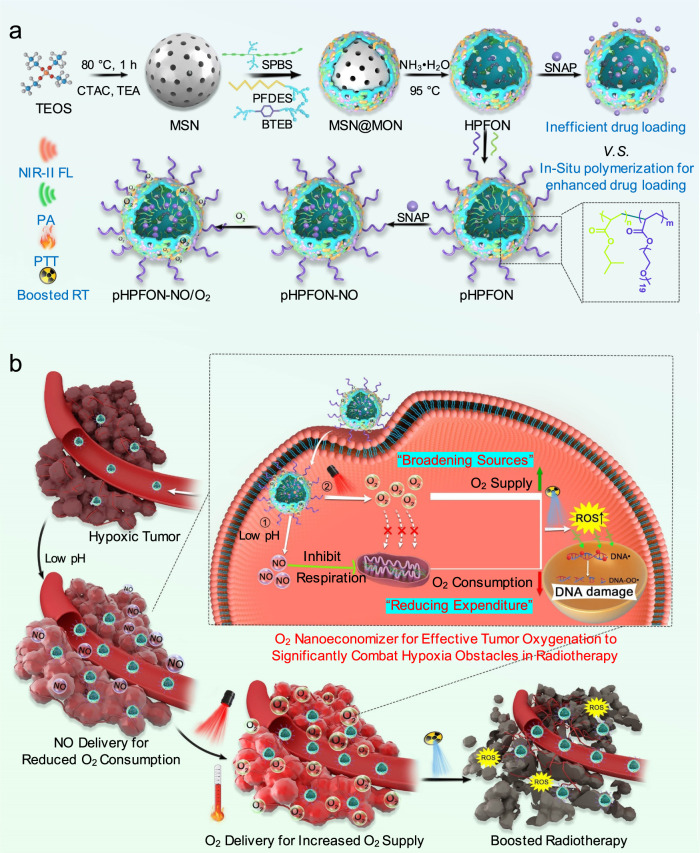
The outcome of radiotherapy is significantly restricted by tumor hypoxia. To overcome this obstacle, one prevalent solution is to increase intratumoral oxygen supply. However, its effectiveness is often limited by the high metabolic demand for O2 by cancer cells. Herein, we develop a hybrid semiconducting organosilica-based O2 nanoeconomizer pHPFON-NO/O2 to combat tumor hypoxia. Our solution is twofold: first, the pHPFON-NO/O2 interacts with the acidic tumor microenvironment to release NO for endogenous O2 conservation; second, it releases O2 in response to mild photothermal effect to enable exogenous O2 infusion. Additionally, the photothermal effect can be increased to eradicate tumor residues with radioresistant properties due to other factors. This "reducing expenditure of O2 and broadening sources" strategy significantly alleviates tumor hypoxia in multiple ways, greatly enhances the efficacy of radiotherapy both in vitro and in vivo, and demonstrates the synergy between on-demand temperature-controlled photothermal and oxygen-elevated radiotherapy for complete tumor response.


Conflict of interest statement

The authors declare no competing interests.

Figures

Fig. 1
Fig. 1. Schematic illustration of fabrication and boosted radiotherapy of the smart O2 nanoeconomizer pHPFON-NO/O2.
a Synthetic procedures. First, sub-50 nm semiconducting polymer brush/fluorocarbon/phenylene triple-hybridized HPFON was prepared by deposition of bissilylated organosilica precursors onto an MSN template via hydrolysis based on the chemical homology principle and selective MSN etching through an ammonia-assisted hot water etching strategy. Then, an in situ polymerization method was applied to conjugate alkyl chains and PEG polymers onto the inner and outer shell of the HPFON for enhanced hydrophobic drug loading as well as improved biocompatibility. Finally, SNAP and O2 were loaded onto the resultant pHPFON to generate the pHPFON-NO/O2. b Schematic illustration of the binary “reducing expenditure and broadening sources” tumor oxygenation strategy by programable delivery of NO and O2 with pHPFON-NO/O2 to overcome hypoxia-associated therapy resistance for boosted anti-cancer radiotherapy.
Fig. 2
Fig. 2. Morphology optimization of the pHPFON nanocarrier.
a Design and synthesis of the semiconducting polymer brush (SPB) silane precursor. (i) bis(triphenylphosphine)palladium(II) dichloride, 2,6-di-tert-butylphenol, toluene, 100 °C, 6 h; (ii) NaN3, THF/DMF, 25 °C, 12 h. (iii) N,N,N′,N″,N‴-pentamethyldiethylenetriamine, mPEG5000-alkyne, CuBr, THF, 25 °C, 48 h. (iv) trifluoroacetic acid (TFA), 24 °C, 24 h. (v) (3-Aminopropyl)triethoxysilane (APTES), EDC/NHS, DMF, 25 °C, 12 h. b TEM images of different SPB and fluorocarbon (FC) chain co-hybridized formulations: SPB/FC, SPB/FC/–Si–O-, SPB/FC/thioether, or SPB/FC/phenylene-hybridized MSN@MON (top) and HPFON (bottom). Scale bar, 50 nm. Experiments were performed three times with similar results.
Fig. 3
Fig. 3. Characterization of pHPFON nanoplatform.
a Elemental mapping. Scale bar, 50 nm. b N2 adsorption–desorption isotherm and c corresponding pore-size distribution. d UV–vis spectra of pHPFON at various concentrations. e NIR-II fluorescence spectrum. f Plot of PA signal versus concentration. Inset: PA images at concentrations ranging from 0 to 1 mg/mL. g Photothermal heating curves and images of pHPFON at different concentration under 808-nm laser irradiation at 1 W/cm2. h Cumulative NO release from pHPFON-NO at different pH values. Inset: schematic illustration of low-pH-induced NO release. i Cumulative O2 release from pHPFON-O2 in response to the laser irradiation. Inset: schematic illustration of laser-activatable O2 release. Experiments were performed twice (be, g, i) or three times (a, f, h), with similar results. Data are presented as mean ± s.d.
Fig. 4
Fig. 4. In vitro programmable release and radiosensitizing effect of NO and O2.
a Confocal images of hypoxic U87MG cells treated with different pHPFON formulations for 24 h, with or without subsequent 808-nm laser irradiation (1 W/cm2, 3 min). Green, DAF-FM (4-amino-5-methylamino-2′,7′-difluorofluorescein, NO indicator). Red, [Ru(dpp)3]Cl2 (hypoxia indicator). Blue, DAPI. Scale bar, 20 µm. Experiments were performed three times with similar results. b Flow cytometry analysis of hypoxic U87MG cells receiving the same treatments in a. Experiments were performed twice with similar results. c Schematic illustration of the NO delivery-based “reducing expenditure” oxygenation strategy for boosted RT. The low-pH-induced NO release would inhibit mitochondrial respiration, downregulate HIF-1α expression, and boost RT efficacy. d Relative activity of cytochrome c oxidase (CcO) after incubating hypoxic U87MG cells with pHPFON-NO at different concentrations for 24 h. ei Effect of cell respiration inhibition by the pHPFON-NO. e Relative CcO activity, f JC-1 assay (green, JC-1 monomer. Red, J-aggregates. Scale bar, 20 µm), g relative ATP contents, h oxygen consumption capacity, and i HIF-1α expression (green, HIF-1α; red, tubulin. Scale bar, 20 µm) after co-incubation of hypoxic U87MG cells with pHPFON-NO, pHPFON, or PBS overnight. j Schematic illustration of the O2 delivery-based “broadening sources” oxygenation strategy for advanced RT. The laser-activatable O2 release would downregulate HIF-1α expression and augment X-ray-induced oxidative DNA damage. k Anti-HIF-1α staining in hypoxic U87MG cells after different treatments. Green, HIF-1α; red, tubulin. Scale bar, 20 µm. l Evaluation of intracellular ROS generation and DNA damage with H2DCFDA assay and anti-γ-H2Aχ staining after different treatments. Green, 2′,7′-dichlorofluorescein (DCF) or γ-H2Aχ; blue, DAPI. Scale bar, 20 μm. For k, l, (+) stands for 808-nm laser irradiation at 1 W/cm2 for 3 min applied after 24 h of incubation with nanoparticles; (#) stands for 4-Gy X-ray irradiation following the laser irradiation, if applicable. n = 4 biologically independent samples per group (d, e, g). Experiments were performed three times with similar results (f, h, i, k, l). Data are presented as mean ± s.d. in d. For the boxplots, the middle line is the median, the lower and upper hinges correspond to the first and third quartiles, and whiskers represent ±1.5 interquartile range (e, g). Two-tailed Student’s t-test. ***P < 0.001. ****P < 0.0001.
Fig. 5
Fig. 5. In vitro radiotherapy.
ae NO and/or O2-boosted radiotherapy. a, b Cell viabilities of a normoxic (21% O2) and b hypoxic (1% O2) U87MG cells subjected to different nanoparticle treatments, following by an X-ray irradiation at various doses (0, 2, 4, 6 Gy). In the groups with laser irradiation, the laser (808 nm) was applied after 24 h of incubation at a dosage of 1 W/cm2 for 3 min. n = 5 biologically independent samples per group. c Survival fraction determined by colony formation assays in both normoxic and hypoxic U87MG cells after different treatments. n = 3 biologically independent samples per group. d Fluorescent DNA-stained images by comet assays in hypoxic U87MG cells after different treatments. Scale bar, 50 μm. Experiments were performed three times with similar results. e Quantification of DNA damage (n = 6 independent experiments) according to the images in d. For ce, groups g1–g8: g1, pHPFON-NO/O2 + Laser + X-ray; g2, pHPFON-NO + X-ray; g3, pHPFON-O2 + Laser + X-ray; g4, pHPFON + Laser + X-ray; g5, pHPFON + X-ray; g6, X-ray; g7, pHPFON-NO/O2 + Laser; g8, PBS. Laser (808 nm) was applied after 24 h of incubation with nanoparticles at 1 W/cm2 for 3 min. X-ray was applied after the laser irradiation at a dose of 4 Gy. fi In vitro synergistic photothermal and radiotherapy. f MTT assays (n = 5 biologically independent samples). g Live and dead assays (n = 3 biologically independent samples, with similar results). Green, Calcein-AM, live cells. Red, ethidium homodimer-1 (Eth-1), dead cells. Scale bar, 100 µm. h Flow cytometry analysis (n = 2 independent experiments, with similar results). i Quantitative analysis according to h on cells after different treatments. For fi, groups T1–T8: T1, pHPFON-NO/O2(++)(#); T2, pHPFON-NO/O2(++); T3, pHPFON-NO/O2(+)(#); T4, pHPFON-NO/O2(+); T5, (#); T6, (++); T7, pHPFON-NO/O2; and T8, PBS. (++) stands for 808-nm laser irradiation at 1 W/cm2 for 5 min. (+) stands for 808-nm laser irradiation at 1 W/cm2 for 3 min. (#) stands for a 4-Gy X-ray irradiation. Laser was applied after 24 h of incubation with nanoparticles and X-ray was applied after the laser irradiation, if applicable. Data are presented as mean ± s.d. Two-tailed Student’s t-test. *P < 0.05. **P < 0.01. ***P < 0.001. ****P < 0.0001.
Fig. 6
Fig. 6. In vivo multi-modal imaging.
U87MG tumor-bearing mice were intravenously injected with 64Cu-labeled pHPFON-NO/O2 for PET imaging or non-labeled pHPFON-NO/O2 for NIR-II fluorescence and PA imaging. a Representative PET images at 1, 4, 24, 48 h p.i. Tumors are circled with yellow dots. b PET quantification on tumors and selected organs according to a. c Representative NIR-II images at selected time points. Tumors are circled with yellow dots. d Relative NIR-II signals at the tumor regions. e Representative tumoral PA images. f Relative PA signal changes. n = 3 biologically independent animals. Data are presented as mean ± s.d.
Fig. 7
Fig. 7. Therapy studies of pHPFON-NO/O2 in a U87MG tumor model.
a Thermographic images of pHPFON-NO/O2 or PBS-treated mice upon laser irradiation (808 nm, 1 W/cm2) at 24 h p.i. at the tumor sites. n = 3 biologically independent animals. b Plots of tumor temperature with irradiation duration based on a. c PA imaging of tumor oxygenation change after pHPFON-NO/O2 injection and a following laser irradiation at 24 h p.i. n = 3 biologically independent animals. d Quantification of oxygen saturation level according to c. e Anti-HIF-1α staining on tumors after different treatments. Laser was applied at 24 h p.i. Experiments were performed three times with similar results. Blue, DAPI; yellow, HIF-1α. Scale bar, 20 μm. f Quantitative tumoral hypoxia evaluation (n = 6 independent experiments) according to the results in e. g Tumor growth curves, h tumor inhibitory rates, and i tumor histological analysis with TUNEL (green, TUNEL; blue, DAPI.) and H&E staining assays after different treatments. n = 5 biologically independent animals with similar results. Scale bar, 100 µm. For gi, groups T1–T8: T1, pHPFON-NO/O2 + 5-min laser + X-ray; T2, pHPFON-NO/O2 + 5-min laser; T3, pHPFON-NO/O2 + 3-min laser + X-ray; T4, pHPFON-NO/O2 + 3-min laser; T5, X-ray; T6, 5-min laser; T7, pHPFON-NO/O2; and T8, PBS. The laser irradiation (808-nm, 1 W/cm2) was applied at 24 h p.i. The X-ray irradiation was at a dosage of 8 Gy and applied at 24 p.i. following laser irradiation (if applicable). Data are presented as mean ± s.d. (b, d, g). For the boxplots, the middle line is the median, the lower and upper hinges correspond to the first and third quartiles, and whiskers represent ±1.5 interquartile range (f, h). Two-tailed Student’s t-test. **P < 0.01. ***P < 0.001. ****P < 0.0001.

References

    1. Barker HE, Paget JT, Khan AA, Harrington KJ. The tumour microenvironment after radiotherapy: mechanisms of resistance and recurrence. Nat. Rev. Cancer. 2015;15:409–425. doi: 10.1038/nrc3958. - DOI - PMC - PubMed
    1. Brown JM, Wilson WR. Exploiting tumour hypoxia in cancer treatment. Nat. Rev. Cancer. 2004;4:437–447. doi: 10.1038/nrc1367. - DOI - PubMed
    1. Rockwell S, Dobrucki IT, Kim EY, Marrison ST, Vu VT. Hypoxia and radiation therapy: past history, ongoing research, and future promise. Curr. Mol. Med. 2009;9:442–458. doi: 10.2174/156652409788167087. - DOI - PMC - PubMed
    1. Overgaard J. Hypoxic radiosensitization: adored and ignored. J. Clin. Oncol. 2007;25:4066–4074. doi: 10.1200/JCO.2007.12.7878. - DOI - PubMed
    1. Kim J, et al. Continuous O2-evolving MnFe2O4 nanoparticle-anchored mesoporous silica nanoparticles for efficient photodynamic therapy in hypoxic cancer. J. Am. Chem. Soc. 2017;139:10992–10995. doi: 10.1021/jacs.7b05559. - DOI - PubMed

Publication types

MeSH terms

LinkOut - more resources