. 2021 Jan 22;11(1):2099.
doi: 10.1038/s41598-021-81165-z.

The Drosophila melanogaster Neprilysin Nepl15 is involved in lipid and carbohydrate storage

Affiliations

The Drosophila melanogaster Neprilysin Nepl15 is involved in lipid and carbohydrate storage

Surya Banerjee et al. Sci Rep. .

Erratum in

Abstract

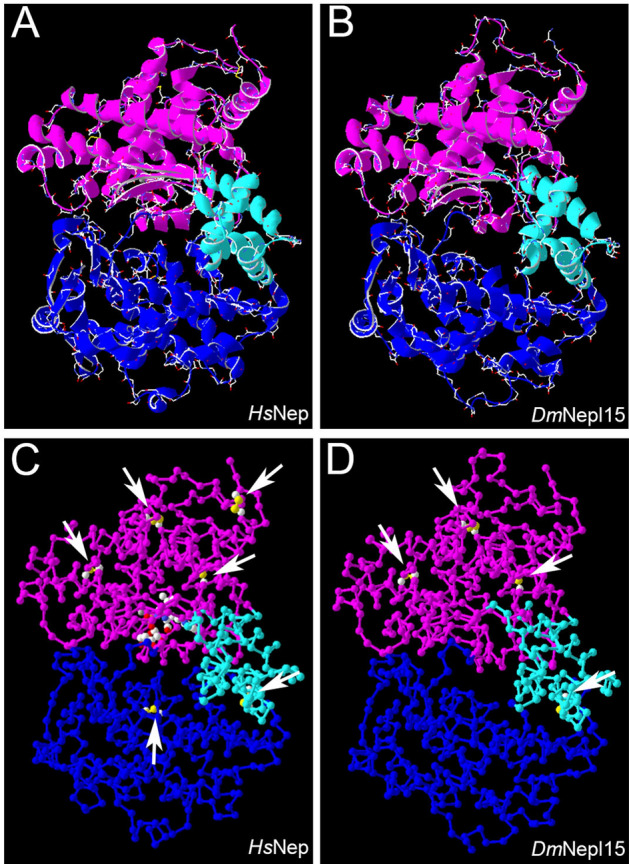
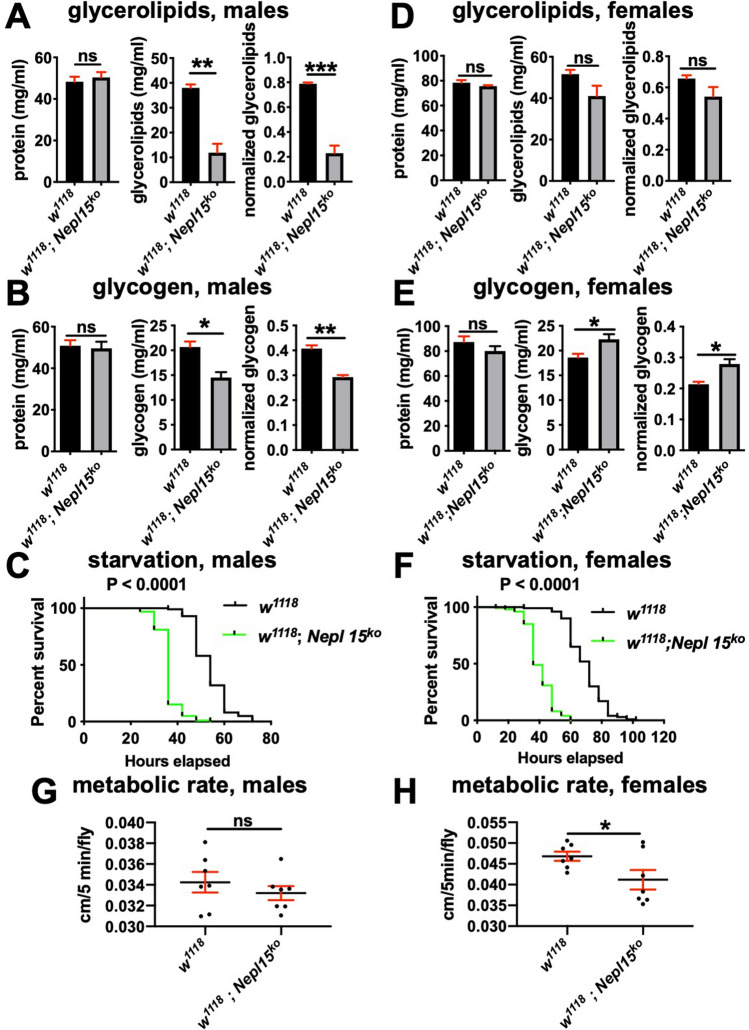
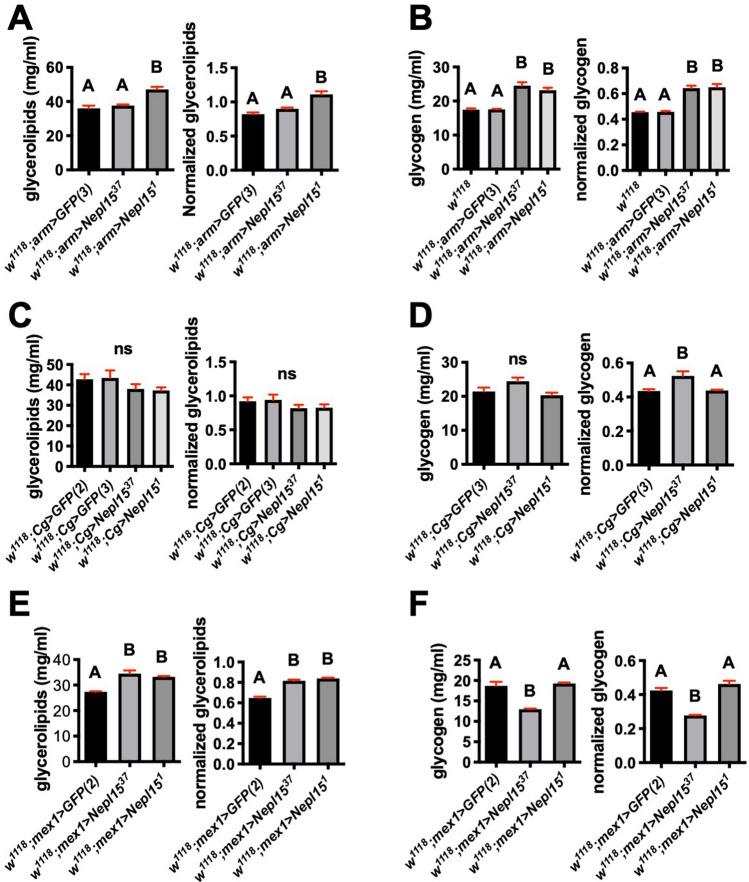
The prototypical M13 peptidase, human Neprilysin, functions as a transmembrane "ectoenzyme" that cleaves neuropeptides that regulate e.g. glucose metabolism, and has been linked to type 2 diabetes. The M13 family has undergone a remarkable, and conserved, expansion in the Drosophila genus. Here, we describe the function of Drosophila melanogaster Neprilysin-like 15 (Nepl15). Nepl15 is likely to be a secreted protein, rather than a transmembrane protein. Nepl15 has changes in critical catalytic residues that are conserved across the Drosophila genus and likely renders the Nepl15 protein catalytically inactive. Nevertheless, a knockout of the Nepl15 gene reveals a reduction in triglyceride and glycogen storage, with the effects likely occurring during the larval feeding period. Conversely, flies overexpressing Nepl15 store more triglycerides and glycogen. Protein modeling suggests that Nepl15 is able to bind and sequester peptide targets of catalytically active Drosophila M13 family members, peptides that are conserved in humans and Drosophila, potentially providing a novel mechanism for regulating the activity of neuropeptides in the context of lipid and carbohydrate homeostasis.


Conflict of interest statement

The authors declare no competing interests.

Figures

Figure 1
Figure 1
The domain structure of DmNepl15 is similar to that of other M13 family members. Ribbon diagrams (A,B) and backbone diagrams (C,D) of a model of a crystal structure of HsNeprilysin (HsNep) in complex with the inhibitor phosphoramidon (1dmt) (A,C), and a homology model of DmNepl15 based on the 1dmt model (B,D). Magenta, blueberry and turquoise colors denote domains 1, 2 and 3, respectively. Arrows in C and D indicate disulfide bonds. These drawings were made using the DeepView—Swiss-PdbViewer (version 4.1.1) (http://www.expasy.org/spdbv/).
Figure 2
Figure 2
DmNepl15 lacks critical catalytic residues. Homology models of DmNepl15 (gray) based on models of crystal structures of HsNeprilysin in complex with (left, magenta) LBQ657, the active metabolite of sacubitril (5jmy); and (center, green) with the inhibitor phosphoramidon (1dmt); (right, blue) homology model of DmNepl15 based on a model of a crystal structure of HsECE-1 in complex with the inhibitor phosphoramidon (3dwb). Yellow, white and gray dotted lines denote interactions between Zn(II) and its coordinators, hydrogen bonds, and other interactions described in the text, respectively. (A–A”) Two of the three residues involved in Zn(II) coordination in HsNeprilysin (His583, His587 and Glu646) and in HsECE-1 (His607, His611, and Glu667) are replaced by Arg in DmNepl15. Asp residues involved in Asp-His-Zinc triads in HsNeprilysin (Asp590 and Asp650) and in HsECE-1 (Asp614 and Asp671)–,, are present at these positions in DmNepl15. The base that deprotonates water in HsNeprilysin (Glu584) and in HsECE-1 (Glu608) is replaced by Gln in DmNepl15. (B–B”) In HsNeprilysin, His711 is thought to help stabilize the transition state during catalysis; Asp709 interacts with His711 and is crucial for catalysis,,–. The corresponding residues are Asp730 and His732 in HsECE-1,. There appears to be no counterpart to HsNeprilysin His711/732 in the Drosophila Nepl15 orthologs. (C–C”) In the HsNeprilysin and HsECE-1 crystal structures the N-A-Ar–Ar motif includes the Asn542/Asn562 side chains and backbone CO groups that hydrogen bond with backbone elements of the LBQ657 and phosphoramidon inhibitors. There does not appear to be a DmNepl15 counterpart to Asn542/Asn562. Ala543/Ala563 in HsNeprilysin appears to be replaced with Pro in the Drosophila Nepl15 orthologs, and Phe544/Tyr565 is replaced by His. HsNeprilysin Arg717 and its HsECE-1 Arg738 counterpart hydrogen bond with backbone CO groups on the LBQ657 and phosphoramidon inhibitors, participate in salt bridges with Asp650/Asp671 and are important for catalytic activity,,,,,. Drosophila Nepl15 counterparts of these residues are Arg654 and Asp586. These drawings were made using the DeepView—Swiss-PdbViewer (version 4.1.1) (http://www.expasy.org/spdbv/).
Figure 3
Figure 3
Nepl15 may be able to bind peptide substrates. Homology models of DmNepl15 (gray) based on models of crystal structures of HsNeprilysin in complex with (left, magenta) LBQ657, the active metabolite of sacubitril (5jmy); and (center, green) with the inhibitor phosphoramidon (1dmt); (right, blue) homology model of DmNepl15 based on a model of a crystal structure of HsECE-1 in complex with the inhibitor phosphoramidon (3dwb). Yellow, white and gray dotted lines denote interactions between Zn(II) and its coordinators, hydrogen bonds, and other interactions described in the text, respectively (A–A”) Hydrophobic residues line the S1′ subsite in DmNepl15 as they do in HsNeprilysin and in HsECE-1. (B–B”) Interactions between the N–A–Ar–Ar motif, the S2′ subsite and the inhibitors reveal flexibility in binding to peptide substrates, as well as differences between the S2′ subsites of HsNeprilysin, HsECE-1 and DmNepl15. In particular, HsNeprilysin Val541, Arg110 and Arg102 are involved in positioning the terminal -COOH group that enables the dipeptidylcarboxypeptidase actvitiy of which HsNeprilysin is capable. Whereas Val563 appears to be the HsECE-1 counterpart to HsNeprilysin Val541, there is no DmNepl15 counterpart to this residue. An Arg is present in the HsECE-1 and DmNepl15 counterparts of HsNeprilysin Arg102. However, the HsNeprilysin Arg110 counterparts are Trp153 in HsECE-1 and Gln88 in DmNepl15. These drawings were made using the DeepView—Swiss-PdbViewer (version 4.1.1) (http://www.expasy.org/spdbv/).
Figure 4
Figure 4
Male and female adults have different Nepl15 transcript expression patterns. RT-qPCR data to show relative abundance of Nepl15 transcripts in different organs of the wild type (w1118) third instar larvae and in different body parts of adult female and male flies. Data are displayed as fold differences compared to the larval gut. ΔCt values were analyzed using a one-way ANOVA. Fold differences in different organs and body segments were assigned to statistical groups using Tukey’s multiple comparison test. Groups sharing at least one letter are not significantly different; groups not sharing any letter are significantly different (P < 0.05). Error bars represent the standard error of mean (SEM). Larval tissues and adult female tissues: n = 4 (3 technical replicates each). Adult male tissues: n = 3 (3 technical replicates each).
Figure 5
Figure 5
Nepl15ko flies have reduced triacylglycerides. Fluorescent images of Nile Red stainings in larval fat bodies from wild-type and Nepl15ko larvae (A,B); nuclei are marked by Hoechst 33342. Merges in the left-hand panels, Nile Red in the middle panels, Hoechst in the right-hand panels. Quantification of Nile Red stainings in larval fat bodies (C). Nile Red stainings in wild-type and Nepl15ko adult fat bodies (D,E); nuclei are marked by Hoechst 33342. Merges in the left-hand panels, Nile Red in the middle panels, Hoechst in the right-hand panels. Quantification of Nile Red stainings in adult fat bodies (F). (G) Uncropped image of a thin layer chromatography plate used to separate triacylglycerides (TAG) in lysates from adult male wild-type flies and from adult males from two independent knock-out isolate strains (Nepl15ko67 and Nepl15ko88). Tri-olein was used as a standard. (H,I) Food intake was measured by CAFE assay (H; n = 4 for all genotypes), and by food labeling by radioactive tracer (I; n = 4 for all genotypes). In panel (I) radioactive tracer data from panel (H) was normalized to body weight. Values in (C,H,I) were analyzed using a one-way ANOVA and were assigned to statistical groups using Tukey’s multiple comparison test. Groups sharing at least one letter are not significantly different; groups not sharing any letter are significantly different (P < 0.05). Values in F were analyzed using a two-tailed student’s t test and the P value is shown. Error bars represent the standard error of mean (SEM).
Figure 6
Figure 6
Nepl15ko males have reduced glycerolipids and glycogen levels, but females have similar glycerolipid levels and slightly increased glycogen levels. (A,D) Protein concentration (left), glycerolipid concentration (center) and glycerolipid concentration normalized to protein concentration (right) for adult males (A) and females (D) of the indicated genotypes. (B,E) Protein concentration (left), glycogen concentration (center) and glycogen concentration normalized to protein concentration (right) for adult males (B) and females (E) of the indicated genotypes. Values were analyzed using an unpaired t test. *, ** and *** indicate P < 0.05, P < 0.01 and P < 0.001, respectively. ns = non-significant. Error bars represent the standard error of mean (SEM). (A,B,D,E: n = 3 biological replicates, with 3 technical replicates each) (C,F) survival curves for starvation assays for males (C; n = 100) and females (F; n = 100) of the indicated genotypes. Values were analyzed using a Log-rank test, and the P values are indicated on the graphs. (G,H) Metabolic rates for males (G) and females (H) of the indicated genotypes (n = 7 for both males and females). Values were analyzed using an unpaired t test. * indicates P < 0.05. Error bars represent the standard error of mean (SEM).
Figure 7
Figure 7
Overexpression of Nepl15 in the whole body or in the midgut results in increased nutrient storage. (A,C,E) Glycerolipid concentration (left) and glycerolipid concentration normalized to protein concentration (right) for adult males of the indicated genotypes. (B,D,F) Glycogen concentration (left) and glycogen concentration normalized to protein concentration (right) for adult males of the indicated genotypes. Values were analyzed using a one-way ANOVA and were assigned to statistical groups using Tukey’s multiple comparison test. Groups sharing at least one letter are not significantly different; groups not sharing any letter are significantly different (P < 0.05). Error bars represent the standard error of mean (SEM). n = 3 biological replicates with 3 technical replicates for all panels.
Figure 8
Figure 8
Reductions in nutrient storage in Nepl15ko adult male flies may reflect defects during the larval stage. (A) Protein concentration (left), glycerolipid concentration (center left), and glycerolipid concentration normalized to protein concentration (center right) for adult males of the indicated genotypes subjected to either NF or a HFD. Increase in normalized glycerolipid levels between adult flies of the indicated genotypes subjected to a HFD compared to flies subjected to NF (right). Values were analyzed using a one-way ANOVA and were assigned to statistical groups using Tukey’s multiple comparison test. Groups sharing at least one letter are not significantly different; groups sharing no letters are significantly different (P < 0.05). Error bars represent the standard error of mean (SEM). n = 3 biological replicates with 3 technical replicates for all panels. (B) Survival curves of time to pupariation (left) and time to eclosion for males (center) and females (right). (Pupariation: n = 93 for w1118, n = 84 for w1118; Nepl15ko) (Eclosion, males: n = 42 for w1118, n = 31 for w1118; Nepl15ko) (Eclosion, females: n = 45 for w1118, n = 43 for w1118; Nepl15ko) (C) Survival curves of time to pupariation for the different temperature regimens for the TARGET experiment. (30 C: n = 16 for UAS-GFP, n = 47 for UAS-Nepl15). (30 C 18 C: n = 31 for UAS-GFP, n = 28 for UAS-Nepl15) (18 C 30 C: n = 15 for UAS-GFP, n = 23 for UAS-Nepl15) (18 C: n = 17 for UAS-GFP, n = 11 for UAS-Nepl15) Data in B and C were analyzed using a log-rank test, and the P values are shown on the graphs.
Figure 9
Figure 9
InR and AkhR signaling are not affected in Nepl1ko males. RT-qPCR data to show relative abundance of transcripts of the indicated genes in w1118 and Nepl15ko adult male flies. Data are displayed as fold differences compared to w1118. ΔCt values were analyzed using an unpaired t test. None of the differences was significant. Error bars represent the standard error of mean (SEM). n = 3 biological replicates with 3 replicates each for all.

References

    1. Turner AJ, Isaac RE, Coates D. The neprilysin (NEP) family of zinc metalloendopeptidases: Genomics and function. BioEssays. 2001;23:261–269. doi: 10.1002/1521-1878(200103)23:3<261::AID-BIES1036>3.0.CO;2-K. - DOI - PubMed
    1. Singh JS, Lang CC. Angiotensin receptor-neprilysin inhibitors: Clinical potential in heart failure and beyond. Vasc. Health Risk Manag. 2015;11:283–295. doi: 10.2147/VHRM.S55630. - DOI - PMC - PubMed
    1. Bland ND, Pinney JW, Thomas JE, Turner AJ, Isaac RE. Bioinformatic analysis of the neprilysin (M13) family of peptidases reveals complex evolutionary and functional relationships. BMC Evol. Biol. 2008;8:16. doi: 10.1186/1471-2148-8-16. - DOI - PMC - PubMed
    1. Lang R, et al. Physiology, signaling, and pharmacology of galanin peptides and receptors: Three decades of emerging diversity. Pharmacol. Rev. 2015;67:118–175. doi: 10.1124/pr.112.006536. - DOI - PubMed
    1. Walther T, et al. Improved learning and memory in aged mice deficient in amyloid beta-degrading neutral endopeptidase. PLoS ONE. 2009;4:e4590. doi: 10.1371/journal.pone.0004590. - DOI - PMC - PubMed

Publication types

LinkOut - more resources