. 2021 Jan 22;4(1):101.
doi: 10.1038/s42003-020-01629-2.

Artificial hibernation/life-protective state induced by thiazoline-related innate fear odors

Affiliations

Artificial hibernation/life-protective state induced by thiazoline-related innate fear odors

Tomohiko Matsuo et al. Commun Biol. .

Abstract

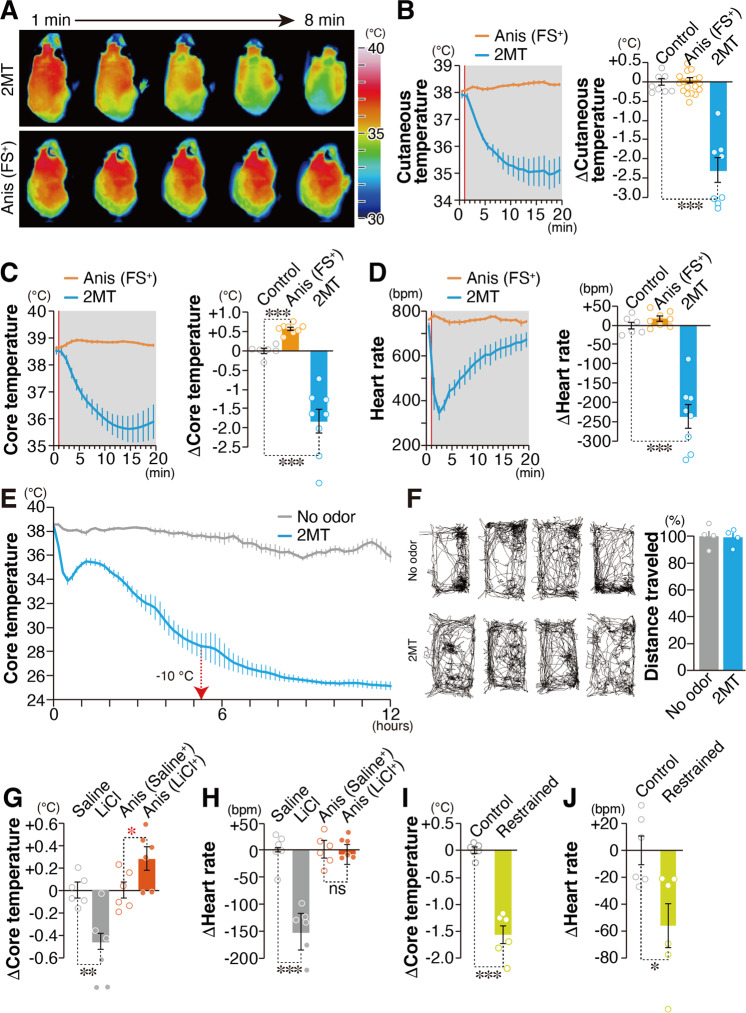
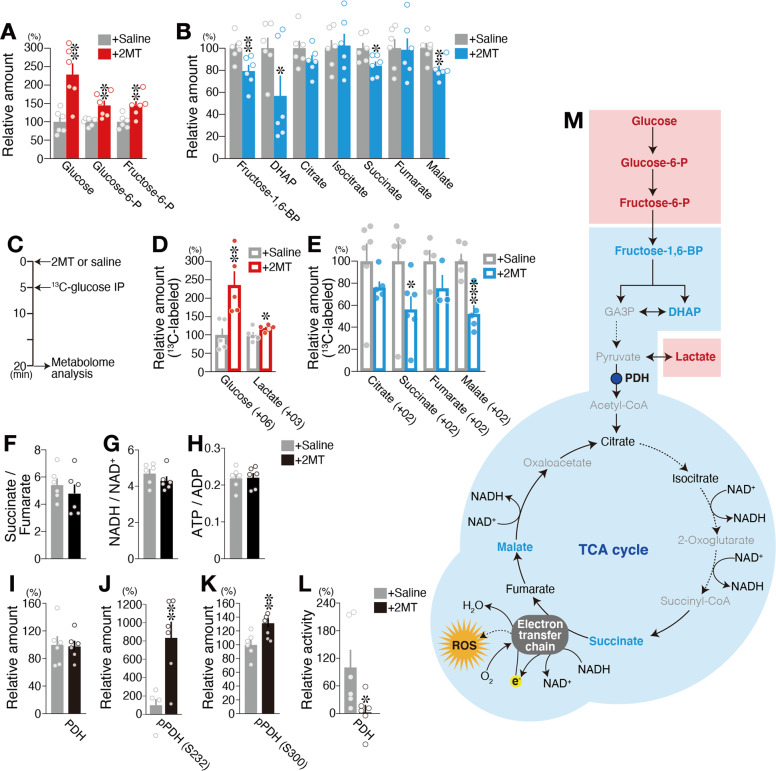
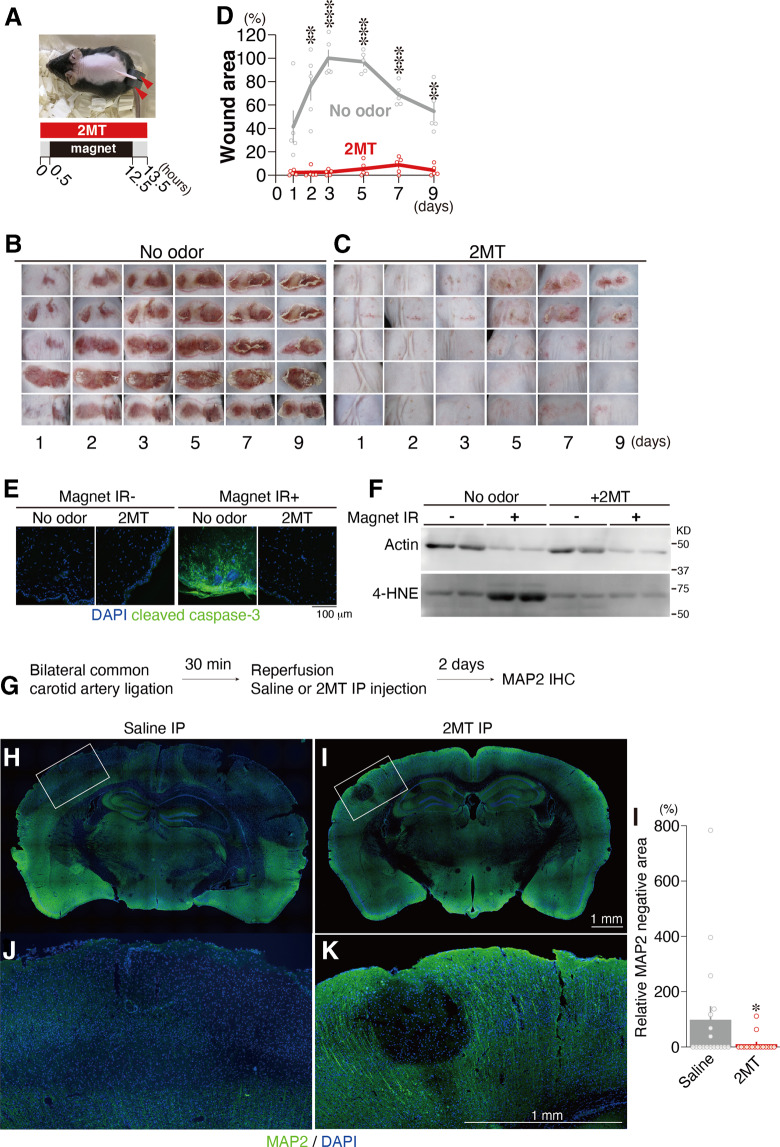
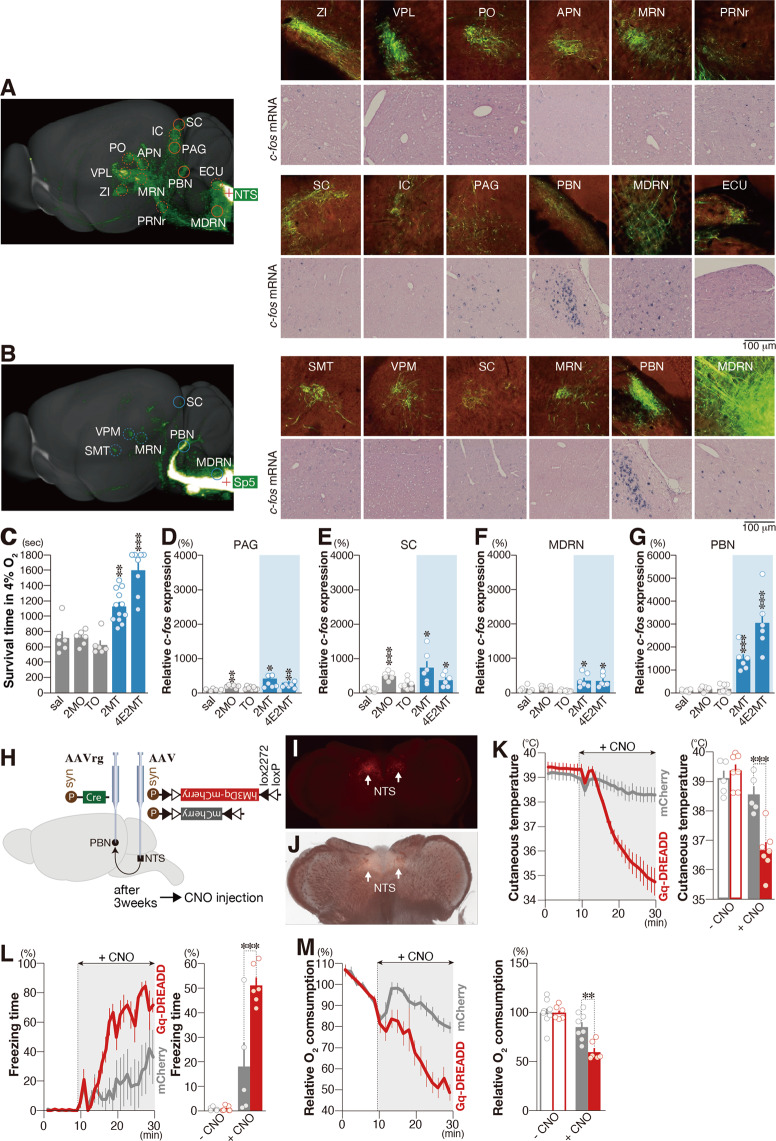
Innate fear intimately connects to the life preservation in crises, although this relationships is not fully understood. Here, we report that presentation of a supernormal innate fear inducer 2-methyl-2-thiazoline (2MT), but not learned fear stimuli, induced robust systemic hypothermia/hypometabolism and suppressed aerobic metabolism via phosphorylation of pyruvate dehydrogenase, thereby enabling long-term survival in a lethal hypoxic environment. These responses exerted potent therapeutic effects in cutaneous and cerebral ischemia/reperfusion injury models. In contrast to hibernation, 2MT stimulation accelerated glucose uptake in the brain and suppressed oxygen saturation in the blood. Whole-brain mapping and chemogenetic activation revealed that the sensory representation of 2MT orchestrates physiological responses via brain stem Sp5/NST to midbrain PBN pathway. 2MT, as a supernormal stimulus of innate fear, induced exaggerated, latent life-protective effects in mice. If this system is preserved in humans, it may be utilized to give rise to a new field: "sensory medicine."


Conflict of interest statement

The authors declare no competing interests.

Figures

Fig. 1
Fig. 1. Physiological responses induced by innate versus learned fear stimuli.
A Infrared dorsal view images taken 1–8 min after odorant presentation. BD Temporal analyses (left panels) and the mean values (right panels) for cutaneous temperatures (B; n = 8 for control, n = 18 for Anis (FS+), and n = 8 for 2MT), core body temperatures [C; n = 6 for control, n = 8 for Anis (FS+), and n = 8 for 2MT], and heart rates (D; n = 6 for control, n = 8 for Anis (FS+), and n = 8 for 2MT) in response to a conditioned odor (anisole) paired with foot shock [Anis (FS+); orange] and 2MT (blue). Red vertical lines indicate the onset of odor presentation. E Temporal analyses of core body temperature in response to long exposure to 2MT and no-odor control (n = 6 each). Filter paper scented with 2MT or saline was introduced into the test cage with a lid at 10 min. Core body temperature decreased by >10°C after 5 h of the odor presentation (red arrow) and reached near-ambient temperature (~2 °C above ambient temperature) after 12 h. Decreasing body temperature to 2–3 °C above ambient temperature is observed in torpor. F Filter paper scented with 2MT or saline was introduced into the cage, which was then covered by a plastic wrap for 6 h. After 1 week of recovery, mice were transferred into a new cage and locomotor activities were analyzed (n = 4 each). Track plots of the movement (left) and the mean distance traveled (right) are shown. G, H The mean change in core body temperature (G) and heart rate (H) in response to intraperitoneal (IP) injection of saline or LiCl (gray) and those induced by a conditioned odorant (anisole) paired with IP injection of saline or LiCl [Anis (Saline+) or Anis (LiCl+); orange (n = 6 each)]. I, J The mean change in core body temperature (I) and heart rate (J) in response to 5 min of restraint (yellow) and control condition (n = 6 each). Data are means ± SEM. One-way ANOVA followed by Dunnett’s multiple comparison or Student’s t test was performed. *P < 0.05; ***p < 0.01; ***p < 0.001; n.s. not significant.
Fig. 2
Fig. 2. Innate fear stimuli suppress basal metabolism to confer anti-hypoxia.
A Temporal analyses of cutaneous blood flow in response to 2MT and Anis (FS+) are shown [n = 9 for 2MT and n = 8 for Anis (FS+); upper panel]. The mean cutaneous blood flow in the no-odor (black), Anis-FS+ (orange), and 2MT (blue) conditions are also shown (lower panel). Levels in no-odor condition were set at 100%. B, C Temporal analyses (upper panels) and mean values (lower panels) for core body temperature induced by 2MT under ambient (black) and thermoneutral (red) conditions (B; n = 6 for control condition and n = 5 for thermoneutral condition), and in control (black) and ucp1−/− (red) mice (C; n = 7 for control and n = 8 for ucp1−/−). D, E Temporal analyses of respiratory rate (D) and oxygen saturation (E) in response to eugenol (gray), a neutral odor, and 2MT (blue) (n = 6 each). Mean respiratory rate (D) and oxygen saturation (E) in response to no odor (open bars), eugenol (solid gray bars), and 2MT (solid blue bars) are also shown (lower panels). F Temporal analyses of oxygen consumption in response to saline (gray) and 2MT (blue) (n = 8 each). Mean oxygen consumption in response to no odor (open bars), saline (solid gray bars), and 2MT (solid red bars) are also shown (lower panel). G The experimental procedure (top), and survival rate in 4% oxygen with (blue; n = 6) and without (gray; n = 6) prior presentation of 2MT. H Survival time in 4% oxygen with 30 min prior presentation of indicated concentration of 2MT gas (n = 5 for 100 p.p.m., n = 6 for other concentrations and n = 34 for control). Data are means ± SEM. Student’s t test, two-way ANOVA followed by Tukey’s multiple comparison or Student’s t test followed by Bonferroni correction was performed. For comparison of survival curve, log-rank test was performed. *P < 0.05; **p < 0.01; ***p < 0.001; n.s., p > 0.05.
Fig. 3
Fig. 3. Innate fear stimuli induce crisis-response metabolism.
AH Metabolome analysis for 2MT-treated and control mice (n = 6 each). Mean percentages of 13C-unlabeled (A, B) and 13C-labeled (D, E) metabolites in the brain in response to saline (gray) and 2MT (red or blue). Metabolite levels in response to saline presentation were set at 100%. The experimental procedure (C) and the ratios of indicated metabolite pairs are also shown (FH). IL Mean percentages of pyruvate dehydrogenase (PDH) (I), pPDH(S232) (J), pPDH(S300) (K), and PDH activity (L) in the brain in response to saline (gray) and 2MT (black). Levels for the saline condition were set at 100% (n = 6 each). M Schematic diagram of glycolysis and the tricarboxylic acid (TCA) cycle. Red, blue, black, and gray colored are significantly increased, significantly decreased, unchanged, and undetected metabolites, respectively. Data are means±SEM. Student’s t test was performed between saline and 2MT conditions. *P < 0.05; **p < 0.01; ***p < 0.001.
Fig. 4
Fig. 4. Suppression of ischemia/reperfusion injury by innate fear stimuli.
A Timeline of cutaneous ischemia/reperfusion experiments. BD Photographs of cutaneous ischemia/reperfusion lesions for the no-odor control (B) and 2MT-treated (C) animals at each time point after reperfusion (n = 5 each). The percentage of lesioning at each time point after reperfusion with (red) and without (gray) 2MT stimulation relative to the wound area in the no-odor condition 3 days after reperfusion is also shown (D). E Representative images of immunohistochemistry for cleaved caspase-3 in the control (magnet IR) and ischemia/reperfusion (magnet IR+) areas with and without 2MT administration. F Immunoblots of actin and 4-HNE in cutaneous lysates from control (magnet IR) and ischemia/reperfusion (magnet IR+) areas. GL Timeline of cerebral ischemia/reperfusion experiments (G), and representative images of immunohistochemistry for MAP2 in coronal brain sections from the saline and 2MT-treated animals (HK). The areas indicated by white boxes in (H and I) are magnified and shown in (J and K). The mean percentages of MAP2-negative areas are also shown for both groups (L; n = 18 for the control group and n = 16 for 2MT-treated group). The size of the MAP2-negative area for the saline condition was set at 100%. Data are means ± SEM. Student’s t test or Mann–Whitney test was performed. *P < 0.05; **p < 0.01; ***p < 0.001.
Fig. 5
Fig. 5. C-fos mRNA expression analysis of the hibernation/torpor brain areas.
Representative images of in situ hybridization of c-fos mRNA in response to no odor, Anis (FS+), and 2MT in the MPA [n = 8 for no odor, n = 11 for Anis (FS+), and n = 12 for 2MT], PVN (n = 6 each), SCN (n = 6 each), reticular thalamic nucleus (Rt) (n = 6 each), choroid plexus (Chp) (n = 6 each), and Ta (n = 4 each). Quantification of c-fos+ cells are also shown. Data are means ± SEM. One-way ANOVA followed by Tukey’s multiple comparison was performed. *P < 0.05; **p < 0.01; ***p < 0.001; n.s., p > 0.05.
Fig. 6
Fig. 6. Identification of the central crisis pathway.
A, B The mouse connectivity data for AAV-EYFP injection in the NST (A) and the Sp5 (B) derived from the Allen Mouse Brain Connectivity Atlas (2011) (sagittal images in the left and enlarged coronal images in the upper columns in the right panels), and representative images of in situ hybridization of c-fos mRNA in response to 4E2MT (enlarged coronal images in the lower columns in the right panels). C Mean survival time in 4% oxygen in response to IP administration of the odorants indicated (n = 6 for saline, n = 6 for 2MO, n = 6 for TO, n = 12 for 2MT, and n = 8 for 4E2MT). DG Quantification of c-fos mRNA expression in response to IP administration of the indicated odorants in the PAG (D), SC (E), MDRN (F), and PBN (G) (n = 6 for saline, 2MO, 2MT, and 4E2MT, and n = 8 for TO). Mean expression in saline conditions was set at 100%. H Experimental design for chemogenetic activation of the NST-PBN pathway. I, J Representative fluorescent (I) and bright (J) images of hM3Dq-fused mCherry expression in the NST for AAV-FLEX-hM3Dq-mCherry injected animal. KM Temporal analyses of cutaneous temperature (K), freezing behavior (L), and oxygen consumption (M) after CNO administration are shown for AAV-FLEX-hM3Dq-infected (red) and control (gray) mice (K; n = 5 for control and n = 7 for hM3Dq, L; n = 5 for control and n = 6 for hM3Dq, M; n = 8 for control and n = 6 for hM3Dq). Statistical significance was assessed for 20 min after CNO administration. Data are shown as mean ± SEM. Student’s t test followed by Bonferroni correction or two-way ANOVA followed by Sidak’s multiple comparisons was used to assess significance. *P < 0.05; **p < 0.01; ***p < 0.001. ZI zona incerta, VPL ventral posterolateral nucleus of the thalamus, PO posterior thalamic nuclear group, APN anterior pretectal nucleus, MRN midbrain reticular nucleus, PRNr pontine reticular nucleus, SC superior colliculus, IC inferior colliculus, PAG periaqueductal gray, PBN parabrachial nucleus, MDRN medullary reticular nucleus, ECU external cuneate nucleus, SMT submedial nucleus of the thalamus, VPM, ventromedial nucleus of the thalamus.

References

    1. Nedergaard J, Cannon B. Mammalian hibernation. Philos. Trans. R. Soc. Lond. Ser. 1990;326:669–685. - PubMed
    1. Lindell SL, et al. Natural resistance to liver cold ischemia-reperfusion injury associated with the hibernation phenotype. Am. J. Physiol. Gastrointest. Liver Physiol. 2005;288:G473–G480. doi: 10.1152/ajpgi.00223.2004. - DOI - PubMed
    1. Forreider B, Pozivilko D, Kawaji Q, Geng X, Ding Y. Hibernation-like neuroprotection in stroke by attenuating brain metabolic dysfunction. Prog. Neurobiol. 2017;157:174–187. doi: 10.1016/j.pneurobio.2016.03.002. - DOI - PubMed
    1. Group HaCAS. Mild therapeutic hypothermia to improve the neurologic outcome after cardiac arrest. N. Engl. J. Med. 2002;346:549–556. doi: 10.1056/NEJMoa012689. - DOI - PubMed
    1. Weant KA, Martin JE, Humphries RL, Cook AM. Pharmacologic options for reducing the shivering response to therapeutic hypothermia. Pharmacotherapy. 2010;30:830–841. doi: 10.1592/phco.30.8.830. - DOI - PubMed

Publication types

LinkOut - more resources