. 2021 Apr 12;180(2):325-341.
doi: 10.1093/toxsci/kfab007.

Structure-Activity Relationship of Neuroactive Steroids, Midazolam, and Perampanel Toward Mitigating Tetramine-Triggered Activity in Murine Hippocampal Neuronal Networks

Affiliations

Structure-Activity Relationship of Neuroactive Steroids, Midazolam, and Perampanel Toward Mitigating Tetramine-Triggered Activity in Murine Hippocampal Neuronal Networks

Shane Antrobus et al. Toxicol Sci. .

Abstract

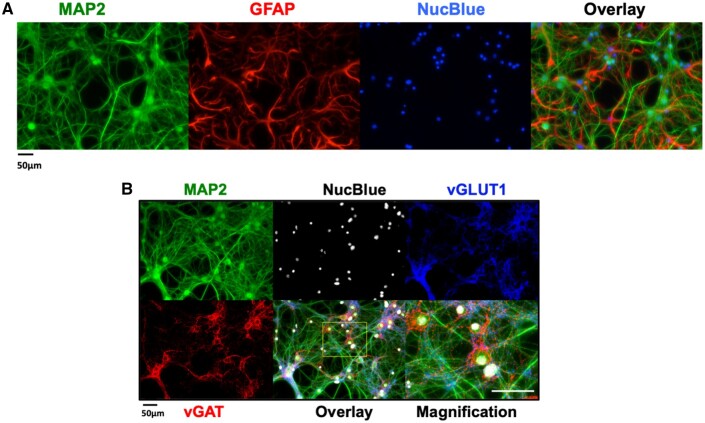
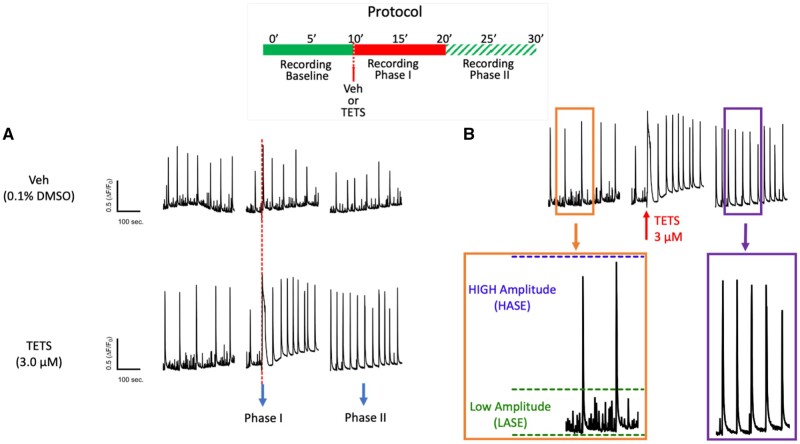
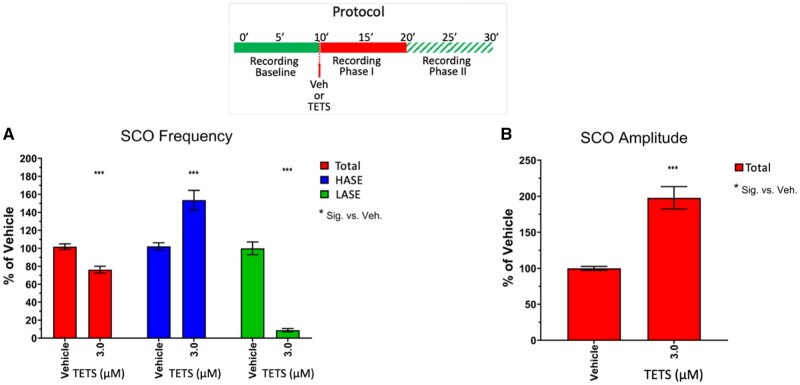
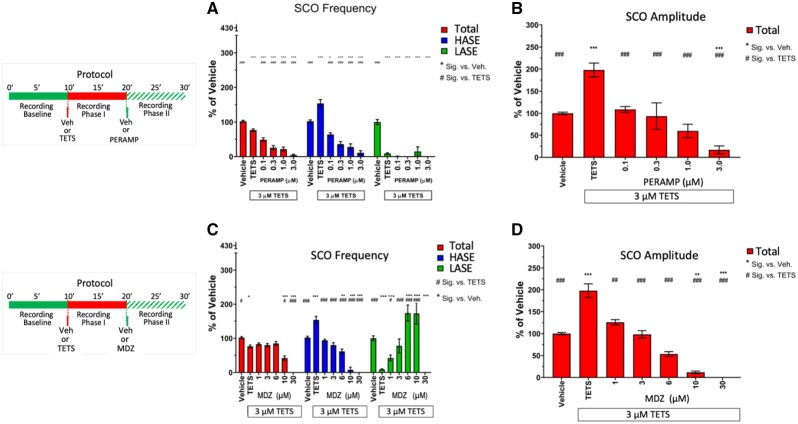
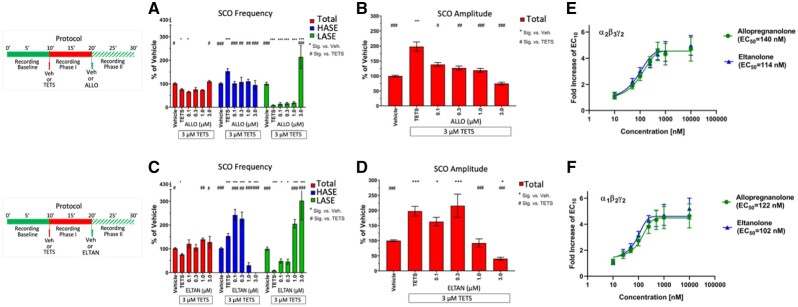
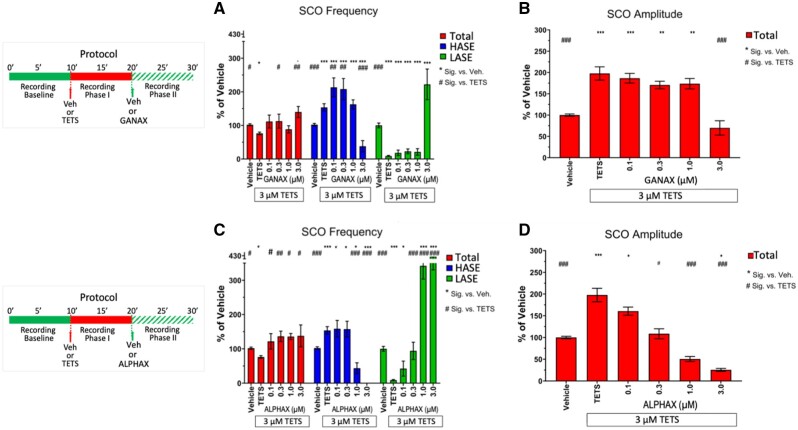
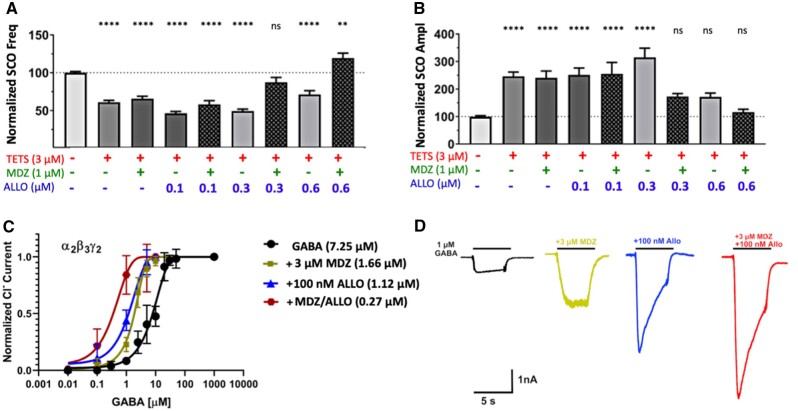
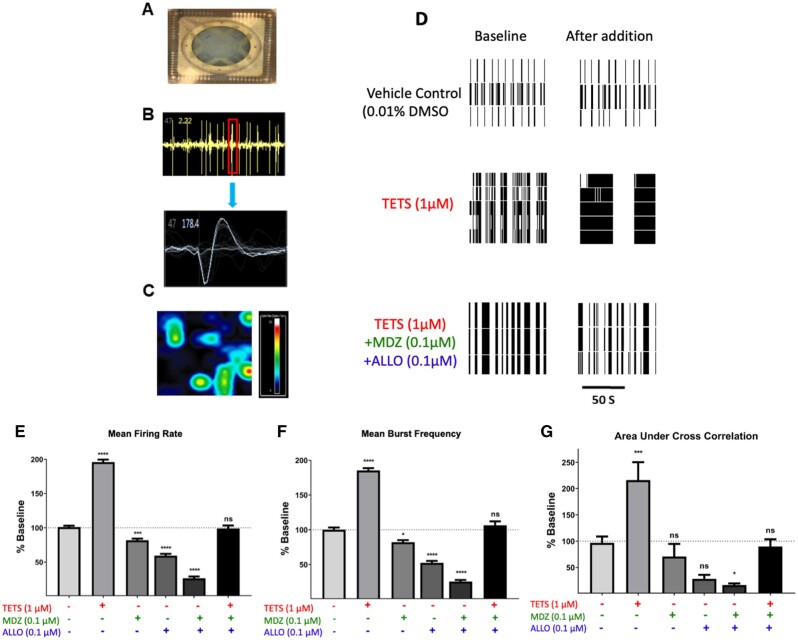
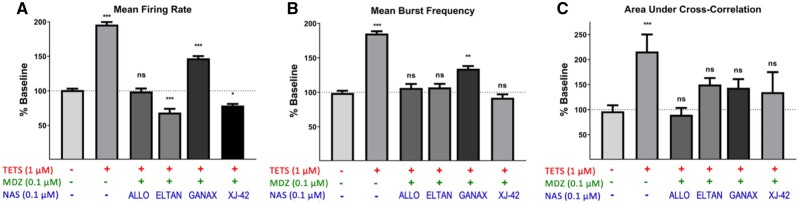
Tetramethylenedisulfotetramine (tetramine or TETS), a potent convulsant, triggers abnormal electrical spike activity (ESA) and synchronous Ca2+ oscillation (SCO) patterns in cultured neuronal networks by blocking gamma-aminobutyric acid (GABAA) receptors. Murine hippocampal neuronal/glial cocultures develop extensive dendritic connectivity between glutamatergic and GABAergic inputs and display two distinct SCO patterns when imaged with the Ca2+ indicator Fluo-4: Low amplitude SCO events (LASE) and High amplitude SCO events (HASE) that are dependent on TTX-sensitive network electrical spike activity (ESA). Acute TETS (3.0 µM) increased overall network SCO amplitude and decreased SCO frequency by stabilizing HASE and suppressing LASE while increasing ESA. In multielectrode arrays, TETS also increased burst frequency and synchronicity. In the presence of TETS (3.0 µM), the clinically used anticonvulsive perampanel (0.1-3.0 µM), a noncompetitive AMPAR antagonist, suppressed all SCO activity, whereas the GABAA receptor potentiator midazolam (1.0-30 µM), the current standard of care, reciprocally suppressed HASE and stabilized LASE. The neuroactive steroid (NAS) allopregnanolone (0.1-3.0 µM) normalized TETS-triggered patterns by selectively suppressing HASE and increasing LASE, a pharmacological pattern distinct from its epimeric form eltanolone, ganaxolone, alphaxolone, and XJ-42, which significantly potentiated TETS-triggered HASE in a biphasic manner. Cortisol failed to mitigate TETS-triggered patterns and at >1 µM augmented them. Combinations of allopregnanolone and midazolam were significantly more effective at normalizing TETS-triggered SCO patterns, ESA patterns, and more potently enhanced GABA-activated Cl- current, than either drug alone.

Keywords: acute neurotoxicity; benzodiazepines; calcium signaling; neuroactive steroids; neuronal networks; pesticides; seizure; tetramine.


Figures

Figure 1.
Figure 1.
Mouse hippocampal neuron and glia co-culture at 14 days in vitro (DIV) express both glutamatergic and GABAergic neurons. A, Representative immunocytofluorescence images showing the neuronal/glial cultures at 14 DIV used to perform functional studies. Neuronal soma, axons and dendritic processes were stained with MAP2 and glia stained with GFAP. Nuclei were stained with NucBlue. Right-most panel is an overlay of all 3 stains. B, Representative immunocytofluorescence images showing the distribution of vesicular GABA transporters (vGAT) and vesicular glutamate transporters within MAP2 positive neurons. The overlay at higher resolution resolves the punctate pattern of the vGAT positive GABAergic neurons.
Figure 2.
Figure 2.
Tetramethylenedisulfotetramine (tetramine or TETS) triggers rapid overall changes in neuronal network synchronous Ca2+ oscillation (SCO) patterns by stabilizing high amplitude SCO events (HASE) and eliminating low amplitude SCO events (LASE). Graphic representation of the experimental protocol (inset). A, representative SCO traces before (Baseline) and after addition of TETS (3.0 µM) illustrate a rapid but transient rise in cytoplasmic Ca2+ (phase I response) and subsequent alterations in 2 distinct populations of SCO events: HASE and LASE (phase II response). Vehicle (0.01% DMSO) showed no significant influences on SCO during either Phase of recording. B, Magnified traces recorded during Baseline, phases I and II; Orange box: Baseline activity showing the green-dashed line is the cut-cutoff thresholds for binning LASE (ΔF/F0 ≤ 0.3) and the blue-dashed line is the binning cutoff for HASE. Purple box: typical phase II response after applying 3 μM TETS, which eliminates all LASE.
Figure 3.
Figure 3.
Tetramethylenedisulfotetramine (tetramine or TETS; 3 µM) decreases overall total SCO frequency and increases SCO amplitude by stabilizing high amplitude SCO events (HASE) and suppressing low amplitude SCO events (LASE). Upper panel shows the experimental protocol for recording baseline and phases I and II recordings postaddition of TETS (3.0 µM). A, Total SCO frequency (red bars), HASE (blue bars) and LASE (green bars) and (B) total amplitude are measured after addition of TETS and normalized to Vehicle control (0.01% DMSO). Total frequency and amplitude are measures of all events (HASE+LASE). All responses to TETS are normalized to respective vehicle controls and reported as mean ± SEM percent change (n = 10–15 wells measured on 3 independent culture days). ANOVA with Tukey post hoc correction *p < .05; **p < .01; ***p <.001.
Figure 4.
Figure 4.
Perampanel (PERAMP) and midazolam (MDZ) mitigate tetramethylenedisulfotetramine (tetramine or TETS) -triggered synchronous Ca2+ oscillation patterns. Upper panels in (A) and (B) show the experimental protocol for recording baseline and phases I and II recordings postaddition of TETS (3.0 µM) and subsequent addition of either PERAMP (0.1–3.0 µM) or MDZ (1–30 µM), respectively. Only phase II responses are analyzed in this study. A, PERAMP and (B) MDZ total amplitude (red bars), high amplitude SCO events (blue bars) and low amplitude SCO events (green bars) are normalize to Vehicle control (0.01% DMSO) and statistically compared with Vehicle (*) or TETS (#) using ANOVA with Tukey post hoc correction. Mean ± SEM (n = 8–15 wells measured on 3 independent culture days). *,#p < .05; **,##p < .01; ***,###p <.001. Summary statistics are reported in Table 1.
Figure 5.
Figure 5.
Allopregnanolone (ALLO) and eltanolone (ELTAN) differentially mitigate tetramethylenedisulfotetramine (TETS)-triggered SCO patterns. Upper panels in (A–D) show the experimental protocol for recording SCO during baseline and phases I and II postaddition of TETS (3.0 µM) and subsequent addition of either 0.1–3.0 µM ALLO or 0.1–3.0 µM ELTAN, respectively. Only phase II responses are analyzed in this study. A–D, Total amplitude (red bars), high amplitude SCO events (blue bars) and low amplitude SCO events (green bars) are normalize to Vehicle control (0.1% DMSO) and statistically compared with Vehicle (*) or TETS (#) using ANOVA with Tukey post hoc correction. Mean ± SEM (n = 14–15 wells measured on 3 independent culture days). *,#p < .05; **,##p < .01; ***,###p <.001. Summary statistics are reported in Table 2. E, Concentration-response curves for ALLO and ELTAN induced potentiation of peak inward Cl current responses of α1β2γ2 gamma-aminobutyric acid (GABAA) receptors to 1 µM GABA (EC10 value) in patch-clamp recordings. EC50 values for ALLO and ELTAN are 122 nM (95% CI: 105–139 nM) and 102 nM (95% CI: 76–128 nM) when concentration response curves are fitted with a Hill coefficient of 1.0. F, Concentration-response curves for ALLO and ELTAN induced potentiation of peak inward Cl current responses of α2β3γ2 GABAA receptors to 2 µM GABA (EC10 value). EC50 values for allopregnanolone and eltanolone are 140 nM (95% CI: 121–159 nM) and 114 nM (95% CI: 97–131 nM). Each data point is the mean ± SD of measurements of 4–8 cells.
Figure 6.
Figure 6.
Ganaxolone (GANAX) and alphaxolone (ALPHAX) differentially mitigate tetramethylenedisulfotetramine (TETS)-triggered SCO patterns. Upper panels in (A–D) show the experimental protocol for recording SCO during baseline and phases I and II postaddition of TETS (3.0 µM) and subsequent addition of either 0.1–3.0 µM GANAX or 0.1–3.0 µM ALPHAX, respectively. Only phase II responses were analyzed in this study. A–D, Total amplitude (red bars), high amplitude SCO events (blue bars) and low amplitude SCO events (green bars) are normalize to Vehicle control (0.01% DMSO) and statistically compared with Vehicle (*) or TETS (#) using ANOVA with Tukey post hoc correction. Mean ± SEM (n = 9–15 wells measured on 3 independent culture days). * #p < .05; **,##p < .01; ***,###p <.001. Summary statistics are reported in Table 2.
Figure 7.
Figure 7.
Midazolam (MDZ) in combination with allopregnanolone (ALLO) mitigates TETS-triggered SCO patterns at concentrations that are individually less effective and their combination is more potent as positive allosteric modulator. A and B, MDZ (1 μM) or ALLO (0.1-0.3 µM) applied individually do not significantly reverse tetramethylenedisulfotetramine (TETS)-triggered synchronous Ca2+ oscillation (SCO) dysregulation. MDZ (1 µM) in combination with ≥ 0.3 µM ALLO restored SCO to (frequency and amplitude), or above (frequency) respective measures in Vehicle control. One-way ANOVA with additional correction (Tukey) for post hoc multiple comparison was applied to determine the statistical differences. Each data point represents mean ± SEM of data from 10–15 wells. *p < .05; **p < .01; ***p <.001, and ****p <.0001. C, Effect of MDZ (3 µM), ALLO (100 nM) or of the combination of MDZ and ALLO on the gamma-aminobutyric acid (GABA) concentration response curve of α2β3γ2 GABAA receptors. GABA: EC50 7.25 µM (95% CI: 6.39–8.11 µM; nH = 1.66); GABA + 3 µM MDZ: EC50 1.66 µM (95% CI: 1.57–1.74 µM; nH = 1.87); GABA + 100 nM ALLO: EC50 1.12 µM (95% CI: 1.05–1.20 µM; nH = 1.30); GABA + 3 mM MDZ + 100 nM ALLO: EC50 0.27 µM (95% CI: 0.12–0.42 µM; nH = 1.21). D, Representative currents elicited by 1 µM of GABA in the absence and the presence of MDZ (3 µM), ALLO (100 nM) or of the combination of MDZ and ALLO are shown below the data plot. Each data point is the mean ± SD of measurements of 4–8 cells.
Figure 8.
Figure 8.
Abnormal network electrical spike activity (ESA) triggered by tetramethylenedisulfotetramine (TETS) is mitigated by the combination of midazolam (MDZ) and allopregnanolone (ALLO). A, ESA recordings were performed on 12 well microelectrode array plates consisting of 64 electrodes/well. B, Example of waveforms counted in ESA data capture using Axis software with the threshold set at 8 times the noise (faint gray trace in lower panel). C, Microelectrode array heat map shows the spatial distribution of ESA. D, Representative raster plots showing ESA activities before (Baseline) and after addition of TETS (1.0 μM) or TETS with the combination of MDZ (0.1 µM) and ALLO (0.1 µM). Summary data showing the influence of TETS, MDZ, and ALLO, singly or in combination, on Mean firing rate (E), mean burst frequency (F), and area under cross correlation—a measure of neuronal network synchronicity (G). ESA measures after TETS + drug additions are to their respective baseline periods before addition and statistically compared using ANOVA with Tukey post hoc correction. Mean ± SEM (n = 5–18 wells measured on 2–3 independent culture days). *p < .05; **p < .01; ***p <.001; and **** p <.0001.
Figure 9.
Figure 9.
Comparative analysis of 4 neuroactive steroid (NAS) for normalizing tetramethylenedisulfotetramine (TETS)-triggered electrical spike activity (ESA) patterns in the presence of midazolam (MDZ). Mean firing rate (A), mean burst frequency (B) and area under cross correlation (C) of neuronal networks after introducing TETS (1 µM) in the presence of combinations of MDZ (0.1 µM) plus 0.1 µM allopregnanolone, ganaxolone, XJ-42, or eltanolone. ESA events are acquired for 10 min before and after addition of compounds and normalized to their respective baselines. Means of each ESA parameter for each dual intervention were compared with the respective timeframe recorded from Veh control. One-way ANOVA with additional correction (Tukey) for post hoc multiple comparisons are applied to determine the statistical differences. Data represent mean ± SEM of data from 5 to 18 wells. *p < .05; **p < .01; ***p <.001 compared with Veh (no exposure to TETS or MDZ/NAS).

References

    1. Bacci A., Verderio C., Pravettoni E., Matteoli M. (1999). Synaptic and intrinsic mechanisms shape synchronous oscillations in hippocampal neurons in culture. Eur. J. Neurosci. 11, 389–397. - PubMed
    1. Bandara S. B., Carty D. R., Singh V., Harvey D. J., Vasylieva N., Pressly B., Wulff H., Lein P. J. (2020). Susceptibility of larval zebrafish to the seizurogenic activity of GABA type A receptor antagonists. Neurotoxicology 76, 220–234. - PMC - PubMed
    1. Barrueto F., Furdyna P. M., Hoffman R. S., Hoffman R. J., Nelson L. S. (2003a). Status epilepticus from an illegally imported Chinese rodenticide: “tetramine”. J. Toxicol. Clin. Toxicol. 41, 991–994. - PubMed
    1. Barrueto F., Nelson L. S., Hoffman R. S. (2003b). Poisoning by an illegally imported Chinese rodenticide containing tetramethylenedisulfotetramine-New York City, 2002. MMWR Morb. Mortal Wkly. Rep. 52, 199–201. Available at: https://www.cdc.gov/mmwr/preview/mmwrhtml/mm5210a4.htm. - PubMed
    1. Ben-Ari Y., Cherubini E., Corradetti R., Gaiarsa J. L. (1989). Giant synaptic potentials in immature rat CA3 hippocampal neurones. J. Physiol. 416, 303–325. - PMC - PubMed

Publication types