Spicy food consumption and risk of gastrointestinal-tract cancers: findings from the China Kadoorie Biobank
- PMID: 33484129
- PMCID: PMC7938514
- DOI: 10.1093/ije/dyaa275
Spicy food consumption and risk of gastrointestinal-tract cancers: findings from the China Kadoorie Biobank
Abstract
Background: Previous case-control studies have reported positive associations of spicy food consumption with risks of certain gastrointestinal-tract (GI) cancers. However, there is no prospective evidence on such associations, particularly from China, where there are high incidence rates of GI cancers and spicy food is widely consumed.
Methods: The prospective China Kadoorie Biobank study recruited >512 000 adults aged 30-79 years from 10 areas in China during 2004-2008; 2350 oesophageal, 3350 stomach and 3061 colorectal incident cancer cases were recorded by 1 January 2017, after a median of 10.1 years of follow-up. Cox regression yielded adjusted hazard ratios (HRs) for each cancer associated with spicy food intake.
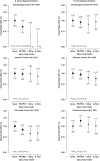
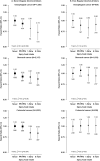
Results: Overall, 30% of participants reported daily spicy food consumption at baseline. Spicy food consumption was inversely associated with oesophageal cancer risk, with adjusted HRs of 1.00, 0.88, 0.76, 0.84 and 0.81 for those who never/rarely consumed (reference) and consumed monthly, 1-2 days/week, 3-5 days/week and 6-7 days/week, respectively (ptrend < 0.002). The association remained similar after excluding the first 3 years of follow-up but appeared stronger in participants who did not smoke or drink alcohol regularly (ptrend < 0.0001). The corresponding HRs for stomach cancer were 1.00, 0.97, 0.95, 0.92 and 0.89 (ptrend = 0.04), with the association disappearing after excluding the first 3 years of follow-up. For colorectal cancer, the HRs were 1.00, 1.00, 0.95, 0.87 and 0.90, respectively (ptrend = 0.04) and the inverse association appeared to be restricted to rectal rather than colon cancer (pheterogeneity = 0.004). The types and strength of spice used showed little additional effects on these associations.
Conclusion: In Chinese adults, higher spicy food consumption was associated with lower risks of certain GI cancers, particularly among individuals who never smoked or drank alcohol regularly.
Keywords: Spicy food; chilli peppers; digestive cancers; gastrointestinal cancers; prospective cohort studies.
© The Author(s) 2021. Published by Oxford University Press on behalf of the International Epidemiological Association.
Figures


References
-
- GLOBOCAN 2018: Estimated age-standardised incidence and mortality rates [Internet]. IARC. 2018. http://gco.iarc.fr/today/online-analysis-multi-bars (1 November 2018, date last accessed)
-
- Kamangar F, Dores GM, Anderson WF.. Patterns of cancer incidence, mortality, and prevalence across five continents: defining priorities to reduce cancer disparities in different geographic regions of the world. J Clin Oncol 2006;24:2137–50. - PubMed
-
- Yang L, Parkin DM, Li L, Chen Y.. Time trends in cancer mortality in China: 1987–1999. Int J Cancer 2003;106:771–83. - PubMed
-
- IARC. GLOBOCAN 2018: Cancer Fact Sheets (China). 2018. IARC, WHO, Geneva https://gco.iarc.fr/today/data/factsheets/populations/160-china-fact-she...
Publication types
MeSH terms
Grants and funding
LinkOut - more resources
Full Text Sources
Other Literature Sources
Medical

