. 2021 Feb;35(2):e21329.
doi: 10.1096/fj.202002163R.

Amelioration of the abnormal phenotype of a new L1 syndrome mouse mutation with L1 mimetics

Affiliations

Amelioration of the abnormal phenotype of a new L1 syndrome mouse mutation with L1 mimetics

Gabriele Loers et al. FASEB J. 2021 Feb.

Abstract

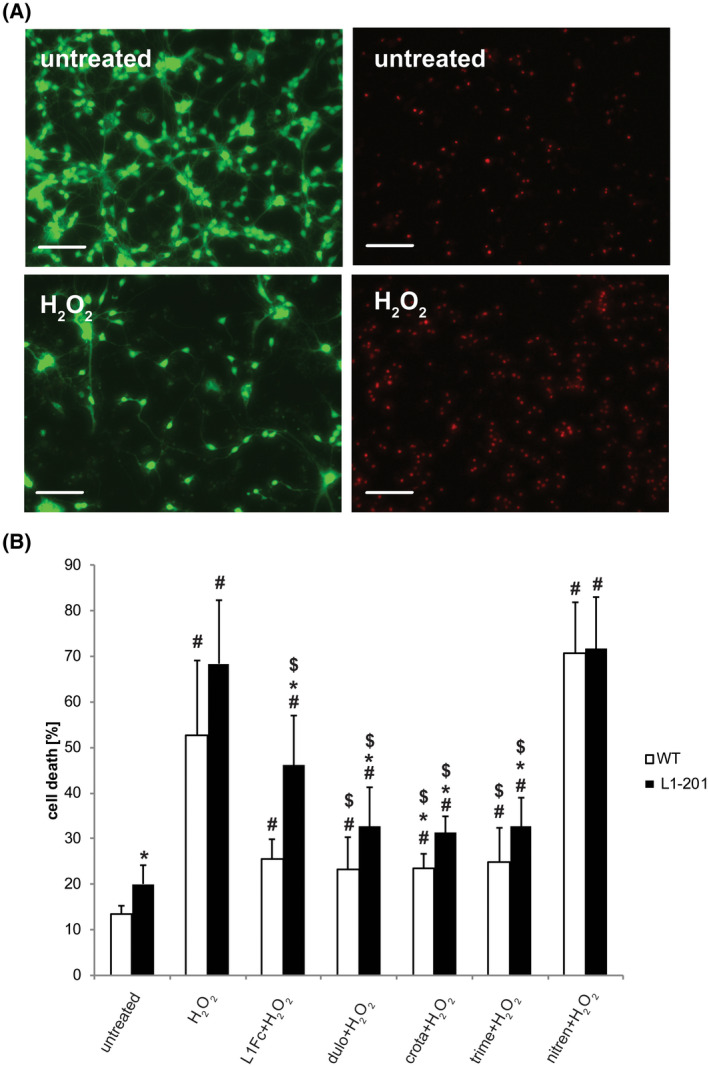
L1 syndrome is a rare developmental disorder characterized by hydrocephalus of varying severity, intellectual deficits, spasticity of the legs, and adducted thumbs. Therapy is limited to symptomatic relief. Numerous gene mutations in the L1 cell adhesion molecule (L1CAM, hereafter abbreviated L1) were identified in L1 syndrome patients, and those affecting the extracellular domain of this transmembrane type 1 glycoprotein show the most severe phenotypes. Previously analyzed rodent models of the L1 syndrome focused on L1-deficient animals or mouse mutants with abrogated cell surface expression of L1, making it difficult to test L1 function-triggering mimetic compounds with potential therapeutic value. To overcome this impasse, we generated a novel L1 syndrome mouse with a mutation of aspartic acid at position 201 in the extracellular part of L1 (p.D201N, hereafter termed L1-201) that displays a cell surface-exposed L1 accessible to the L1 mimetics. Behavioral assessment revealed an increased neurological deficit score and increased locomotor activity in male L1-201 mice carrying the mutation on the X-chromosome. Histological analyses of L1-201 mice showed features of the L1 syndrome, including enlarged ventricles and reduced size of the corpus callosum. Expression levels of L1-201 protein as well as extent of cell surface biotinylation and immunofluorescence labelling of cultured cerebellar neurons were normal. Importantly, treatment of these cultures with the L1 mimetic compounds duloxetine, crotamiton, and trimebutine rescued impaired cell migration and survival as well as neuritogenesis. Altogether, the novel L1 syndrome mouse model provides a first experimental proof-of-principle for the potential therapeutic value of L1 mimetic compounds.

Keywords: L1 syndrome; cell adhesion molecule L1; neuritogenesis; neuronal cell migration; neuronal survival.


Conflict of interest statement

None declared.

Figures

FIGURE 1
FIGURE 1
Neurological deficits and increased locomotor activity of L1‐201 mice. A‐D, Behavioral analyses of male L1‐201 mice compared to wild‐type littermates (L1+/y). E‐H, Behavioral analyses of heterozygous female L1‐201 and wild‐type littermates (L1+/+). Mice were examined for neurological deficits using NDS, motor coordination using rotarod, and locomotor activity and rearing in a field maze. Histograms show values from individual mice and mean ± SEM. *P <  .05; **P  <  .01; *** <  .001, Student's t test or Wilcoxon‐Mann‐Whitney test for pairwise comparison
FIGURE 2
FIGURE 2
L1‐201 mice display histopathological features of L1 syndrome. A, Cresyl violet staining of coronal sections from male L1‐201 mice at Bregma −0.34 and −2.46 showing enlarged ventricles compared to male wild‐type mice (L1+/y). B and C, Histograms showing ventricle area relative to the brain section area at Bregma −0.34 (B) and Bregma −2.46 (C). D, Luxol fast blue and Cresyl violet staining of coronal sections from male L1‐201 mice at Bregma −2.46. Arrows point to the corpus callosum at the midline and its lateral projection. Higher magnification shows corpus callosum thickness at these sites as indicated by double‐headed arrows. E and F, Histograms show reduced corpus callosum thickness in L1‐201 mice in the midline and its lateral projections. Values from individual mice and mean ± SEM are shown. *P <  .05; **P <  .01, Student's t test or Wilcoxon‐Mann‐Whitney test for pairwise comparison
FIGURE 3
FIGURE 3
L1‐201 expression in brain and at the neuronal surface. A, Levels of wild‐type L1 (WT) and L1‐201 (L1‐201) RNA were determined by qRT‐PCR using brains of postnatal day 7 and 56 male littermate mice. Actin and tubulin served as controls to determine ΔΔCt levels. The average of the expression levels of these genes in 7‐day‐old (P7) wild‐type (WT) mice was set to 1.0, and relative expression in transgenic mice and 56‐day‐old (P56) mice was calculated (mean values + SD; three mice per group). Wilcoxon‐Mann‐Whitney test for pairwise comparison was used and showed no significant differences between the genotypes. B and C, Total protein levels of wild‐type L1 (WT) and L1‐201 mice were determined using brains of P7 and P56 male mice for western blot analysis. GAPDH was used as loading control. A representative western blot is shown. Protein levels of full‐length L1 (L1‐fl) and of the 70 kDa L1‐fragment (L1‐70) were determined by densitometry. Mean values + SD are shown for total L1 levels relative to GAPDH levels (P7: P =  .121, P56: P = .343, Wilcoxon‐Mann‐Whitney test; three mice per group). D, Biotinylated cell surface proteins isolated by streptavidin beads from cell lysates of cultured WT and L1‐201 cerebellar granule neurons (surface) and cell lysates (input) were subjected to western blot analysis using L1 antibody to evaluate if L1 is present at the cell surface. The experiment was performed independently three times. A representative western blot is shown
FIGURE 4
FIGURE 4
L1‐201 neurons show impaired outgrowth and migration that can be ameliorated with L1 mimetic agonists. A and B, Cerebellar granule neurons from wild‐type (WT) and L1‐201 mice were cultured on PLL in the presence of PBS (PLL), 20 μg/mL L1Fc, 100 nM duloxetine (dulo), 100 nM crotamiton (crota), 100 nM trimebutine maleate (trime) or 100 nM nitrendipine (nitren) as control compound. A, Length of all neurites were measured from at least 100 cells per treatment and genotype. Mean values + SEM are shown. # P < .0001 compared to values obtained with PLL substrate; *P < .0001 compared to the respective WT values. The experiment was performed independently three times with two mice per genotype and experiment. Scale bars: 25 µm. B, Migrated cells from cerebellar explants were determined from at least 10 explants per treatment and genotype. Mean values + SEM are shown. # P < .05 compared to values obtained on PLL substrate; *P < .05 compared to respective WT values. The experiment was performed independently three times with two mice per genotype and experiment. Scale bars: 50 µm
FIGURE 5
FIGURE 5
L1‐201 neurons show impaired cell survival that can be ameliorated with L1 mimetics. A and B, Cerebellar neurons cultured in the presence or absence of compounds or L1Fc (20 μg/mL L1Fc, 100 nM duloxetine (dulo), 100 nM crotamiton (crota), 100 nM trimebutine maleate (trime), or 100 nM nitrendipine (nitren)) were treated with 10 μM hydrogen peroxide (H2O2) to induce cell death. Twenty‐four hours after cell death induction, live and dead cells were stained with calcein‐AM (green) and propidium iodide (red) and four images were taken from each of three wells per treatment and genotype. A, Representative images of L1‐201 cells without cell death induction (untreated) and after induction of cell death (H2O2) are shown for live (left images, green cells) and dead (right images, red nuclei) cells. Scale bars: 100 µm. B, Bar diagram shows mean values + SEM of live and dead cells. # P < .001 compared to values obtained on PLL substrate; *P < .001 compared to respective WT values. $ P < .001 compared to values obtained with H2O2 treatment alone. The experiment was performed independently three times with two mice per genotype and experiment
FIGURE 6
FIGURE 6
L1‐201 Schwann cells show impaired process formation that can be ameliorated with the L1 mimetic duloxetine. A and B, Wild‐type (WT) and L1‐201 Schwann cells were cultured on PLL in the presence of phosphate‐buffered saline, pH 7.4 (PBS) or 100 nM duloxetine (dulo). A, Representative images of L1‐201 Schwann cells maintained on PLL without compound (PBS) and on PLL with duloxetine (dulo). Scale bars: 50 µm. B, Diagram shows lengths of processes measured from at least 100 cells per treatment and genotype. Mean values + SEM are shown. # P < .001 compared to values obtained on the PLL substrate; *P < .001 compared to the respective WT values. The experiment was performed independently three times with two mice per genotype and experiment

Similar articles

Cited by

References

    1. Maness PF, Schachner M. Neural recognition molecules of the immunoglobulin superfamily: signaling transducers of axon guidance and neuronal migration. Nat Neurosci. 2007;10:19‐26. - PubMed
    1. Sytnyk V, Leshchyns'ka I, Schachner M. Neural cell adhesion molecules of the immunoglobulin superfamily regulate synapse formation, maintenance, and function. Trends Neurosci. 2017;40:295‐308. - PubMed
    1. Schäfer MK, Frotscher M. Role of L1CAM for axon sprouting and branching. Cell Tissue Res. 2012;349:39‐48. - PubMed
    1. Harper JR, Prince JT, Healy PA, Stuart JK, Nauman SJ, Stallcup WB. Isolation and sequence of partial cDNA clones of human L1: homology of human and rodent L1 in the cytoplasmic region. J Neurochem. 1991;56:797‐804. - PubMed
    1. Sadoul K, Sadoul R, Faissner A, Schachner M. Biochemical characterization of different molecular forms of the neural cell adhesion molecule L1. J Neurochem. 1988;50:510‐521. - PubMed

Publication types

MeSH terms

Supplementary concepts

LinkOut - more resources