. 2021 Mar;112(3):1289-1299.
doi: 10.1111/cas.14820. Epub 2021 Feb 12.

TARBP2 promotes tumor angiogenesis and metastasis by destabilizing antiangiogenic factor mRNAs

Affiliations

TARBP2 promotes tumor angiogenesis and metastasis by destabilizing antiangiogenic factor mRNAs

Meicen Zhou et al. Cancer Sci. 2021 Mar.

Abstract

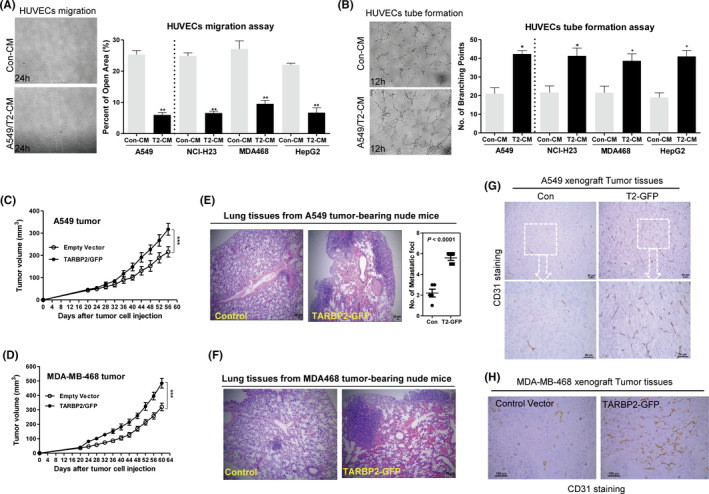
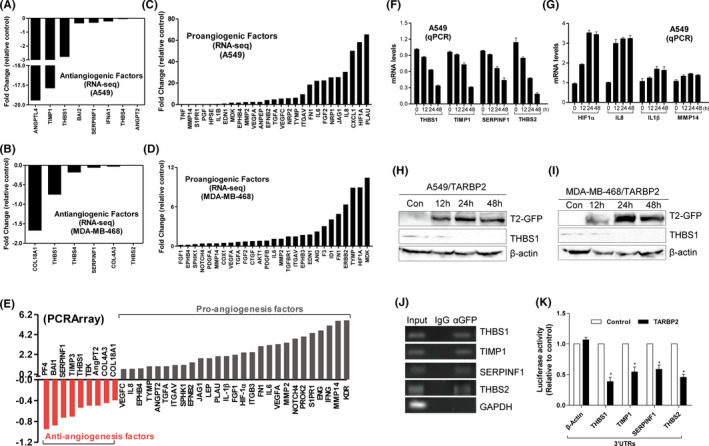
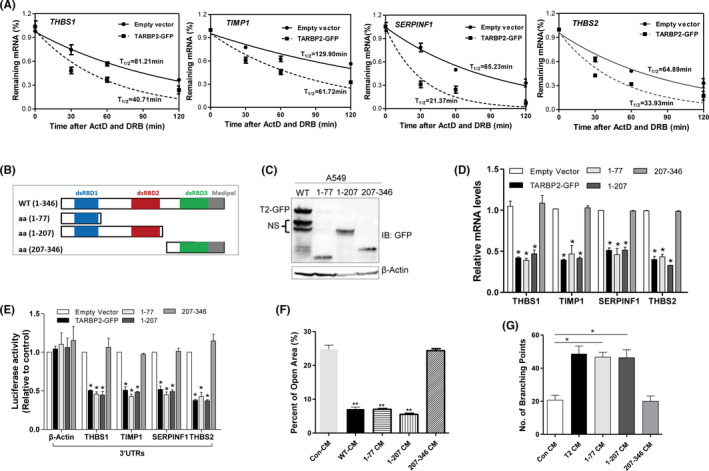
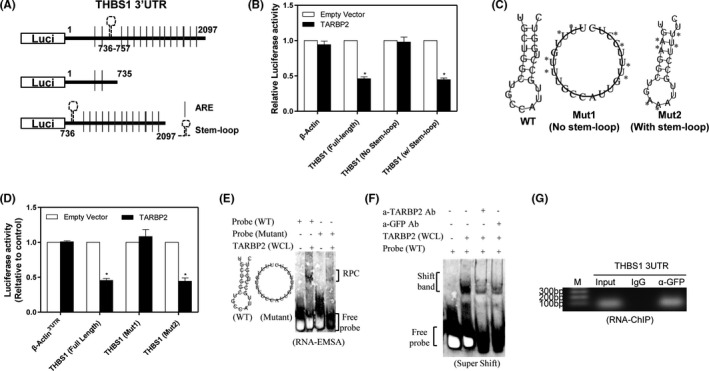
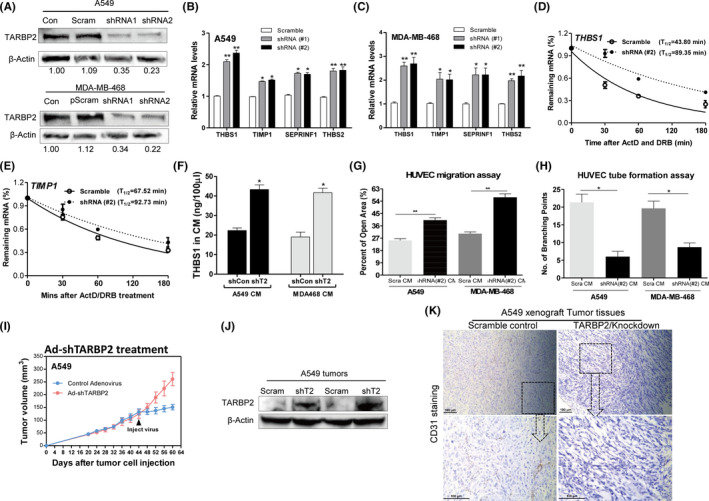
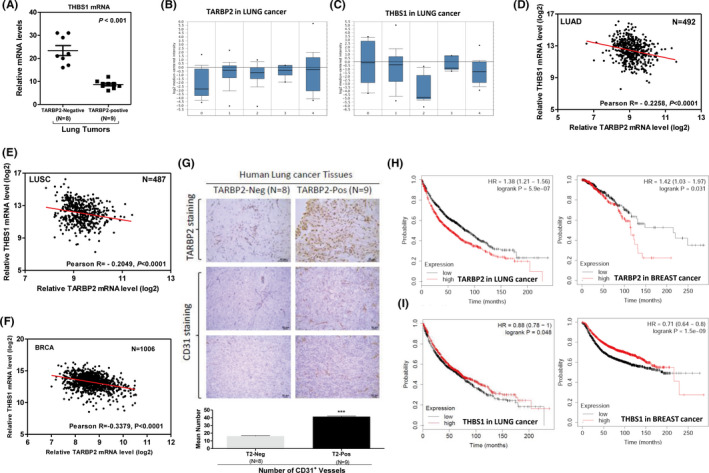
Tumor angiogenesis is a crucial step in the further growth and metastasis of solid tumors. However, its regulatory mechanism remains unclear. Here, we showed that TARBP2, an RNA-binding protein, played a role in promoting tumor-induced angiogenesis both in vitro and in vivo through degrading the mRNAs of antiangiogenic factors, including thrombospondin1/2 (THBS1/2), tissue inhibitor of metalloproteinases 1 (TIMP1), and serpin family F member 1 (SERPINF1), by targeting their 3'untranslated regions (3'UTRs). Overexpression of TARBP2 promotes tumor cell-induced angiogenesis, while its knockdown inhibits tumor angiogenesis. Clinical cohort analysis revealed that high expression level of TARBP2 was associated with poor survival of lung cancer and breast cancer patients. Mechanistically, TARBP2 physically interacts with the stem-loop structure located in the 3'UTR of antiangiogenic transcripts, leading to mRNA destabilization by the dsRNA-binding domains 1/2 (dsRBDs1/2). Notably, the expression level of TARBP2 in human tumor tissue is negatively correlated with the expression of antiangiogenic factors, including THBS1/2, and brain-specific angiogenesis inhibitor 1 (BAI1). Moreover, TARBP2 expression is strongly associated with tumor angiogenesis in a group of human lung cancer samples. Collectively, our results highlight that TARBP2 is a novel tumor angiogenesis regulator that could promote tumor angiogenesis by selectively downregulating antiangiogenic gene expression.

Keywords: TARBP2; mRNA destabilization; metastasis; thrombospondin1; tumor angiogenesis.


Conflict of interest statement

The authors have no conflict of interest.

Figures

FIGURE 1
FIGURE 1
TARBP2 promotes tumor‐induced angiogenesis in vitro and in vivo. A, Wound‐healing assays were performed to detect the cell migration induced by indicated conditioned mediums (CMs) from TARBP2‐overexpressing tumor cells in HUVECs; n = 3. 100×. B, Tube formation assays were also deployed to verify the tube‐formed HUVECs after treatment with CMs from TARBP2‐overexpressing tumor cells; n = 3. 100×. C, D, Tumor growth curves in nude mice received TARBP2‐overexpressing A549/TARBP2 (C), MDA‐MB‐468/TARBP2 (D), and their control cells, respectively; n = 6. E, F, H&E staining of lung tissue sections from nude mice bearing A549 or MDA‐MB‐468 tumors; n = 3. Scale bar: 50 µm. G, H, Representative histological sections from A549 and MDA‐MB‐468 xenografts stained with a specific anti‐CD31 antibody; n = 3. Scale bar: 50 µm. *P < .05, **P < .01, ***P < .0001
FIGURE 2
FIGURE 2
TARBP2 downregulates the expression of antiangiogenic factor mRNAs via targeting 3′UTRs. A, B, RNA‐seq data showing the antiangiogenic factor mRNAs were downregulated in TARBP2‐expressing A549 cells (A) and MDA‐MB‐468 cells (B). C, D, Proangiogenic factor mRNAs were upregulated by TARBP2 in A549 (C) and MDA‐MB‐468 cells (D). E, Human angiogenesis pathway PCR array was performed in A549/TARBP2 cells. F, G, mRNA expressions of the indicated antiangiogenic (F) and proangiogenic (G) genes were measured by qRT‐PCR in TARBP2‐overexpressing A549 cells. H, I, Cell lysates were isolated from the A549/TARBP2 (H) and MDA‐MB‐468/TARBP2 (I) cells followed by Western blot analysis with GFP, THBS1, and β‐actin antibodies. J, RNA‐IP was performed using anti‐GFP antibody or IgG in the extraction of A549/TARBP2 cells. Antiangiogenic factor transcripts were enriched by TARBP2. GAPDH transcript was used as a negative control. K, Luciferase assays were performed by cotransfecting HEK293 cells with reporter constructs containing 3′UTRs of the indicated genes as well as TARBP2 expression vector and empty vector. The ratio of luciferase activity in cells transfected with TARBP2 relative to empty vector was determined, respectively; n = 3. *P < .05
FIGURE 3
FIGURE 3
TARBP2 destabilizes the mRNAs of antiangiogenic factors via the dsRBD1/2 domains. A, Half‐lives of indicated antiangiogenic factor genes were measured in TARBP2‐overexpressing A549 cells. B, Schematic representation of the domains in TARBP2 and their truncation mutants. C, Western blot was used to verify the expression of TARBP2 truncation mutants in A549 cells (NS, nonspecific band). D, qRT‐PCR was used to measure the mRNA expression of indicated antiangiogenic genes in A549 cells overexpressing TARBP2 or its mutants; n = 3. E, Luciferase assays were performed by transfecting HEK293 cells with reporter constructs containing 3′UTRs of the indicated genes. The ratio of luciferase activity in cells transfected with TARBP2 and its mutants relative to empty vector was determined, respectively; n = 3. F, Quantification of open area in the wound‐healing assay of HUVECs treated with conditioned mediums (CMs) from A549 cells stably expressing TARBP2 (wt) and its mutants; n = 3. G, Quantification of the number of branching points of HUVECs treated with indicated tumor CMs in the tube formation assay; n = 3. *P < .05, **P < .01
FIGURE 4
FIGURE 4
TARBP2 binds to conserved guanine cytosine‐rich stem‐loop structure in THBS1 3′UTR. A, Schematic representation of the luciferase reporter constructs of THBS1 containing truncated 3′UTRs with/without the stem‐loop structure. B, Relative luciferase activities of the indicated reporters were determined by luciferase assay; n = 3. C, The predicted stem‐loop structure of THBS1 (left) in its 3′UTR and mutation strategy (asterisks indicate base substitution). Mutant1 becomes unable to form a stem‐loop structure (middle), while Mutant2 forms a stem‐loop structure (right). D, Relative luciferase activities of the indicated reporters were evaluated by luciferase assay. E, RNA‐EMSA was performed with biotin‐labeled probes corresponding to the THBS1 3′UTR, including WT probe and mutant probe, in the presence of whole‐cell lysates (WCL) extracted from A549/TARBP2 cells. F, Supershift assay was performed using anti‐TARBP2 or anti‐GFP antibodies, followed by performing EMSA assay as described above. G, RNA‐ChIP assay was conducted in A549 cells after TARBP2/GFP fusion protein expression. *P < .05
FIGURE 5
FIGURE 5
Knocking down TARBP2 increases the stability of antiangiogenic factor transcripts and inhibits tumor angiogenesis. A, Western blot was used to verify the efficiency of TARBP2 knockdown in protein level in A549 cells (upper) and MDA‐MB‐468 cells (lower), respectively. B, C, qRT‐PCR was used to measure the mRNA expression of indicated antiangiogenic genes in A549 cells (B) and MDA‐MB‐468 cells (C) after knockdown of TARBP2; n = 3. D, E, Half‐lives of indicated antiangiogenic factor genes were measured by qRT‐PCR after TARBP2 knockdown in A549 cells. F, ELISA quantification of THBS1 in the serum‐free culture medium of TARBP2 knocked down A549 and MDA‐MB‐468 cells; n = 3. G, Quantification of the open area of HUVECs treated with indicated tumor conditioned mediums (CMs) in the wound‐healing assay; n = 3. H, Quantification of the number of branching points of HUVECs treated with indicated tumor CMs in the tube formation assay; n = 3. *P < .05, **P < .01. I, Tumor growth curves in nude mice after treatment with adenovirus. Black arrows indicate the time point of adenovirus injection. J, Western blot was used to confirm knockdown of TARBP2 in A549 xenografts. K, Representative histological sections from tumors treated with control adenovirus or shTARBP2‐expressing adenovirus; tumor tissues stained with anti‐CD31 antibody. Scale bar, 100 µm
FIGURE 6
FIGURE 6
TARBP2 expression was associated with increased tumor angiogenesis and poor prognosis in human cancers. A, qRT‐PCR was used to analyze the THBS1 expression level in TARBP2‐negative (n = 8) or ‐positive (n = 9) human lung tumors. B, C, Comparison of TARBP2 (B) and THBS1 (C) expression between normal tissue (0) (n = 17), lung adenocarcinoma (1) (n = 139), lung carcinoid tumor (2) (n = 20), small cell lung carcinoma (3) (n = 6), and squamous cell lung carcinoma (4) (n = 21). D‐F, Pearson's correlation analysis between TARBP2 and THBS1 expression levels in log2 values in human lung adenocarcinoma (D), lung squamous cell carcinoma (E), and breast cancer patients (F). G, Representative images of IHC staining for TARBP2 (upper) and CD31 (middle) in human lung cancer tissues. Quantification of the number of CD31+ vessels per section from TARBP2‐negative and TARBP2‐positive lung tumor tissues (lower). H, I, Kaplan‐Meier overall survival curves for human lung and breast cancer patients with low and high tumor TARBP2 (H) and THBS1 (I) transcripts, respectively.

Similar articles

Cited by

References

    1. Kerbel RS. Tumor angiogenesis. N Engl J Med. 2008;358(19):2039‐2049. - PMC - PubMed
    1. Fidler IJ. Critical determinants of metastasis. Semin Cancer Biol. 2002;12(2):89‐96. - PubMed
    1. Husemann Y, Geigl JB, Schubert F, et al. Systemic spread is an early step in breast cancer. Cancer Cell. 2008;13(1):58‐68. - PubMed
    1. Viallard C, Larrivee B. Tumor angiogenesis and vascular normalization: alternative therapeutic targets. Angiogenesis. 2017;20(4):409‐426. - PubMed
    1. Weis SM, Cheresh DA. Tumor angiogenesis: molecular pathways and therapeutic targets. Nat Med. 2011;17(11):1359‐1370. - PubMed

MeSH terms