. 2021 Mar;32(3):802-812.
doi: 10.1111/jce.14896. Epub 2021 Feb 10.

Feasibility of intraprocedural integration of cardiac CT to guide left ventricular lead implantation for CRT upgrades

Affiliations

Feasibility of intraprocedural integration of cardiac CT to guide left ventricular lead implantation for CRT upgrades

Justin Gould et al. J Cardiovasc Electrophysiol. 2021 Mar.

Abstract

Background: Optimal positioning of the left ventricular (LV) lead is an important determinant of cardiac resynchronization therapy (CRT) response.

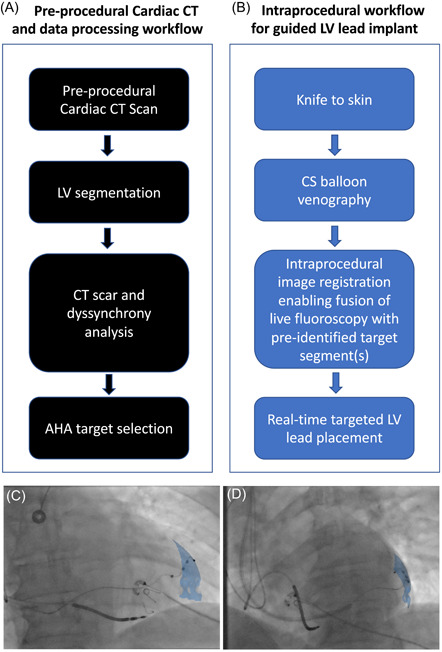
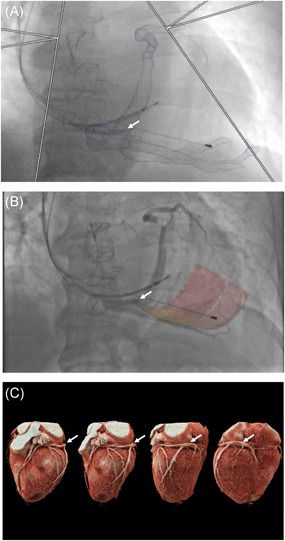
Objective: Evaluate the feasibility of intraprocedural integration of cardiac computed tomography (CT) to guide LV lead implantation for CRT upgrades.

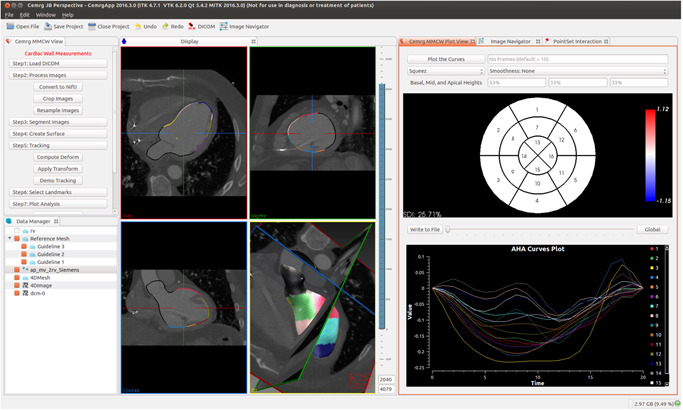
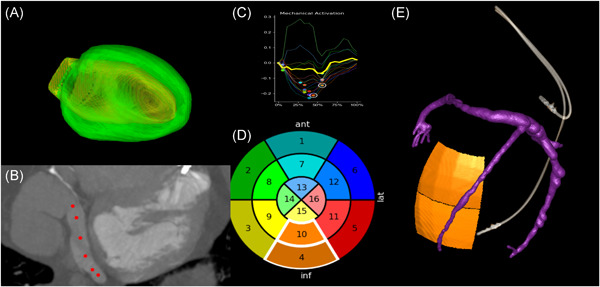
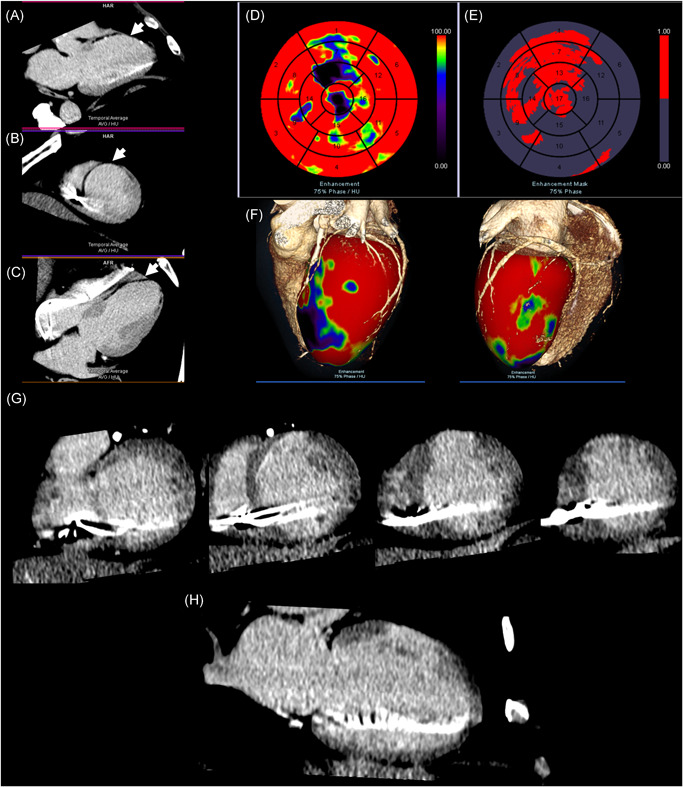
Methods: Patients undergoing LV lead upgrade underwent ECG-gated cardiac CT dyssynchrony and LV scar assessment. Target American Heart Association segment selection was determined using latest non-scarred mechanically activating segments overlaid onto real-time fluoroscopy with image co-registration to guide optimal LV lead implantation. Hemodynamic validation was performed using a pressure wire in the LV cavity (dP/dtmax) ).

Results: 18 patients (male 94%, 55.6% ischemic cardiomyopathy) with RV pacing burden 60.0 ± 43.7% and mean QRS duration 154 ± 30 ms underwent cardiac CT. 10/10 ischemic patients had CT evidence of scar and these segments were excluded as targets. Seventeen out of 18 (94%) patients underwent successful LV lead implantation with delivery to the CT target segment in 15 out of 18 (83%) of patients. Acute hemodynamic response (dP/dtmax ≥ 10%) was superior with LV stimulation in CT target versus nontarget segments (83.3% vs. 25.0%; p = .012). Reverse remodeling at 6 months (LV end-systolic volume improvement ≥15%) occurred in 60% of subjects (4/8 [50.0%] ischemic cardiomyopathy vs. 5/7 [71.4%] nonischemic cardiomyopathy, p = .608).

Conclusion: Intraprocedural integration of cardiac CT to guide optimal LV lead placement is feasible with superior hemodynamics when pacing in CT target segments and favorable volumetric response rates, despite a high proportion of patients with ischemic cardiomyopathy. Multicentre, randomized controlled studies are needed to evaluate whether intraprocedural integration of cardiac CT is superior to standard care.

Keywords: CRT; cardiac CT; image guidance; improving CRT response.


Figures

Figure 1
Figure 1
Cardiac computed tomography (CT) yssynchrony analys is platform based on open‐source software medical imaging interaction toolkit (MITK) provides a simple stepwise approach for tracking wall motion from cardiac CT datasets. (A) Interactive image rendering for visualizing 3D images and surface meshes. (B) 16‐segment bullseye plot for visualization of myocardial strain. (C) Individual strain curves; each color represents an American Heart Association (AHA) segment
Figure 2
Figure 2
Pre‐implant CT Guided CRT workflow. (A) Automatic segmentation of LV epicardium and endocardium to create 3D LV mesh. (B) Semi‐automatic segmentation of coronary venous anatomy using intermittent 3D markers (red circles) generates 3D reconstruction of coronary sinus (CS)/veins. (C) Integration of CT‐derived dyssynchrony plots allows selection of latest mechanically activating segment. (D) Target selection on AHA 16‐segment bullseye plot using dyssynchrony curves. Latest mechanically activating segments (time to peak contraction) without LV scar defined the optimal target segments for LV lead delivery. Septal and minimal endocardial strain segments were excluded as likely represent regions of nonviability. 11 Each color represents an AHA segment. (E) 3D fusion of target AHA segments with CS segmentation to identify target veins subtending the target segment. A large posterolateral vein subtends basal‐mid inferior segments in this example. AHA, American Heart Association; CRT, cardiac resynchronization therapy; CT, computed tomography; LV, left ventricular
Figure 3
Figure 3
Guide CRT workflows. (A–C) Preprocedural data processing (A) and intraprocedural (B) workflows. (C–D) Final LV lead position with LV lead deployed in mid‐anterolateral AHA (blue) target segment represented in (C) posterior‐anterior and (D) left‐anterior‐oblique 30 degree projections. AHA, American Heart Association; CRT, cardiac resynchronization therapy; LV, left ventricular
Figure 4
Figure 4
Cardiac CT scar analysis. Images acquired with dynamic single‐energy cardiac CT, 12.5 min post‐contrast administration. (A) Three‐chamber acquisition showing hypoattenuation (white arrow) in basal‐anteroseptal, mid‐anteroseptal and apical‐anterior segments. (B) Short‐axis slice showing hypoattenuation (white arrow) in mid‐anterior and anteroseptal segments. (C) Two‐chamber acquisition slice showing hypoattenuation (white arrow) in basal‐apical anterior segments. (D) AHA 17‐segment LV polar plot showing first‐pass enhancement mapping. Red represents high CT values ≥100HU with good first‐pass enhancement. Purple/blue represents CT values 0–75HU with less contrast in first‐pass enhancement. (E) AHA 17‐segment LV polar plot showing enhancement mask mapping. Red represents hypodense myocardial areas in first‐pass enhancement (relatively low contrasted regions). (F) Three dimensional volume‐rendered cardiac CT angiography images and first‐pass enhancement map fused with LV endocardial mesh. Color spectra as per (D). (G) Series of short‐axis slices showing late iodine enhancement in mid‐apical anterior segments, extending into mid‐anterolateral segment in keeping with prior left‐anterior‐descending artery territory infarction. (H) Single two‐chamber slice showing transmural late iodine enhancement in mid‐anterior segment. AHA, American Heart Association; CT, computed tomography; LV, left ventricular
Figure 5
Figure 5
CT‐derived coronary venous anatomy. (A) Overlaid onto fluoroscopy to aid operator CS cannulation. Guide catheter (arrowed) entering CS ostium. (B) Balloon venogram of corresponding coronary venous anatomy with target segments overlaid onto fluoroscopy. (C) Volume‐rendered cardiac CT angiography series delineating coronary venous anatomy (arrowed). CS, coronary sinus; CT, computed tomography

Similar articles

Cited by

References

    1. Curtis AB, Worley SJ, Adamson PB, et al. Biventricular pacing for atrioventricular block and systolic dysfunction. N Engl J Med. 2013;17368:1585‐1593. - PubMed
    1. Ypenburg C, van Bommel RJ, Delgado V, et al. Optimal left ventricular lead position predicts reverse remodeling and survival after cardiac resynchronization therapy. J Am Coll Cardiol Elsevier. 2008;52:1402‐1409. - PubMed
    1. Behar JM, Mountney P, Toth D, et al. Real‐time X‐MRI‐guided left ventricular lead implantation for targeted delivery of cardiac resynchronization therapy. JACC Clin Electrophysiol Elsevier. 2017;3:803‐814. - PubMed
    1. Daubert JC, Saxon L, Adamson PB, et al. EHRA/HRS expert consensus statement on cardiac resynchronization therapy in heart failure: implant and follow‐up recommendations and management. Heart Rhythm. 2012;2012(9):1524‐1576. - PubMed
    1. Behar JM, Rajani R, Pourmorteza A, et al. Comprehensive use of cardiac computed tomography to guide left ventricular lead placement in cardiac resynchronization therapy. Heart Rhythm. 2017;14:1364‐1372. - PMC - PubMed

Publication types