. 2021 Jan;9(2):e14709.
doi: 10.14814/phy2.14709.

Computational and theoretical insights into the homeostatic response to the decreased cell size of midbrain dopamine neurons

Affiliations

Computational and theoretical insights into the homeostatic response to the decreased cell size of midbrain dopamine neurons

Francisco Arencibia-Albite et al. Physiol Rep. 2021 Jan.

Abstract

Midbrain dopamine neurons communicate signals of reward anticipation and attribution of salience. This capacity is distorted in heroin or cocaine abuse or in conditions such as human mania. A shared characteristic among rodent models of these behavioral disorders is that dopamine neurons in these animals acquired a small size and manifest an augmented spontaneous and burst activity. The biophysical mechanism underlying this increased excitation is currently unknown, but is believed to primarily follow from a substantial drop in K+ conductance secondary to morphology reduction. This work uses a dopamine neuron mathematical model to show, surprisingly, that under size diminution a reduction in K+ conductance is an adaptation that attempts to decrease cell excitability. The homeostatic response that preserves the intrinsic activity is the conservation of the ion channel density for each conductance; a result that is analytically demonstrated and challenges the experimentalist tendency to reduce intrinsic excitation to K+ conductance expression level. Another unexpected mechanism that buffers the raise in intrinsic activity is the presence of the ether-a-go-go-related gen K+ channel since its activation is illustrated to increase with size reduction. Computational experiments finally demonstrate that size attenuation results in the paradoxical enhancement of afferent-driven bursting as a reduced temporal summation indexed correlates with improved depolarization. This work illustrates, on the whole, that experimentation in the absence of mathematical models may lead to the erroneous interpretation of the counterintuitive aspects of empirical data.

Keywords: capacitance; cell size; computational modeling; dopamine neurons.


Conflict of interest statement

No conflicts of interest, financial or otherwise, are declared by the authors.

Figures

FIGURE 1
FIGURE 1
DA neuron model electrophysiology. (a) All compartments in the model are equivalent to the depicted circuit. Na+ and Ca++ currents are inward whereas K+ currents are outward. The h and leak currents reverse direction during the action potential time course. For further details see Materials and Methods. (b) The model's soma compartment exhibits a slow pacemaker firing at 2.16 Hz under control conditions. (c) Measurement of the model's membrane time constants when the soma compartment is held at −70 mV. (d1) Input resistance test performed at the soma compartment. (d2) The graph expands the content of the dashed box in c1. (e) The model's burst response as elicited by NMDA channels placed at the soma compartment. (f) The soma spontaneous activity in the model is driven by the L‐type Ca++ conductance (g CaL); g CaL was set to zero in all compartments. (g) The inhibition of the h‐conductance (g H) has no impact on the model's pacemaker activity; g H was set to zero in all compartments. (h) Depolarization sag response measured at the soma compartment. (i1) Simulated voltage‐clamp whole‐cell recording. The pipette was placed at the soma compartment. The access resistance is 30 MΩ. (i2) Zoom in on the recording in i1.
FIGURE 2
FIGURE 2
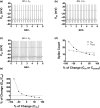
Effects of DA cell size attenuation in the presence of a fixed number of membrane ion channels. (a) A C m reduction of 30% elevates cell firing by ~31% (from 2.16 to 2.83 Hz) and increases the action potential amplitude (APA) by 5.98 mV (from 98.46 to 104.44 mV). (b) A C m reduction of 50% elevates cell firing by ~54% (from 2.16 to 3.33 Hz) and increases the APA by 9.86 mV (from 98.46 to 108.32 mV). (c) A C m reduction of 80% elevates cell firing by ~115% (from 2.16 to 4.66 Hz) and increases the APA by 14.98 mV (from 98.46 to 113.44 mV). (d) Scatter plot that summarizes the effects of cell size alterations in the presence of a fixed number of membrane ion channels. (e) Scatter plot showing that a decline in C m, under a fixed number of membrane ion channels, results in a substantial elevation of the densities of each channel type. For example, a 30% drop in capacitance elevates densities by about 43%.
FIGURE 3
FIGURE 3
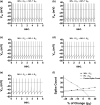
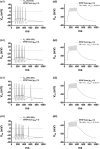
Effects of channel density scaling secondary to DA cell size reduction. (a) A reduction of 30% in C m with a 15% increase in G m elevates the channel density of each conductance by ~64%, in contrast, to control (Figure 1b). In this case, the spike count has augmented by five spikes (from 13 to 18; 2.16 Hz → 3 Hz). Notice here that g K has augmented by 15% yet cell firing is enhanced. (b) A reduction of 30% in C m with a 30% increase in G m elevates the channel density of each conductance by ~86%, in contrast, to control (Figure 1b). In this case, the spike count has augmented by seven spikes (from 13 to 20; 2.16 Hz → 3.33 Hz). Notice here that g K has raised by 30% yet cell firing is enhanced. (c) A reduction of 30% in C m with a 15% decrease in G m elevates the channel density of each conductance by ~21%, in contrast, to control (Figure 1b). In this case, the spike count has augmented by two spikes (from 13 to 15; 2.16 Hz → 2.5 Hz). When contrasted to Figure 2a, the 15% declined in g K correlates with cell excitation dampening and not with enhance cell firing. (d) A reduction of 30% in C m with a 30% decrease in G m conserves the channel density of each conductance. In this case, the spike count and the membrane voltage trace remain identical to control (Figure 1b). When contrasted to parts a, b, and c, the 30% declined in g K correlates with the preservation of cell excitation and not with enhance cell firing. (e) A reduction of 30% in C m with a 50% decrease in G m decreases the channel density of each conductance by ~29%, in contrast, to control (Figure 1b). In this case, the spike count has declined by three spikes (from 13 to 10; 2.16 Hz → 1.66 Hz). When contrasted to parts a, b, c, and d, the 50% declined in g K correlates with cell excitation dampening and not with enhance cell firing. (f) Scatter plot that summarizes the above simulations (black dots). The horizontal axis has been label as g K, and not G m, to emphasize that a decrease in g K, after size reduction, correlates with cell excitation dampening and not with enhance cell firing. A decrease in g K increases cell excitation only when all other cell properties are held constant (white dots).
FIGURE 4
FIGURE 4
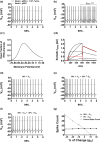
The ether‐a‐go‐go related gen K+ (ERG) current may prevent the increased DA cell firing secondary to size reduction. (a) The initial placement of the ERG conductance in the DA neuron model breaks the balance between inward and outward currents abolishing intrinsic activity (gray trace). After placing the ERG conductance in all compartments, the control firing frequency is recovered by increasing the non‐inactivating L‐type Ca++ conductance (g CaL). (b) The blockade of I ERG doubles the firing frequency (from 2.16 to 4.33 Hz); the ERG conductance (g ERG) was set to zero in all compartments. (c1) ERG channel activation curve. (c2) I–V curve of the somatic I ERG. Holding potential was −70 mV. Step commands were from −50 to 50 mV in 20 mV increments. The red trace is the current response to the 50 mV step. (d) In the absence of I ERG, a 30% reduction in C m, with no change in G m, increases the spike count by four spikes (from 13 to 17; 2.16 → 2.83 Hz, see Figure 2a). In the presence of I ERG, however, the spike count increases by one spike (from 13 to 14; 2.16 → 2.33 Hz). (e) In the absence of I ERG, a 30% reduction in C m, with a 30% increase in G m, increases the spike count by seven spikes (from 13 to 20; 2.16 → 3.33 Hz, see Figure 3b). In the presence of I ERG, however, the spike count increases by one spike (from 13 to 14; 2.16 → 2.33 Hz). (f) A reduction of 30% in C m together with a 30% decrease in G m conserves the spike count. In this case, the membrane voltage trace remains identical to control (Figure 4a). (g) Scatter plot that summarizes the simulations in the presence of I ERG (black dots). The horizontal axis has been label as g K, and not G m, to emphasize that when other biophysical attributes are changing is not possible predict the adjustments in cell firing by just measuring the expression level of g K; g K is inversely related to cell excitation only when all other membrane properties are held constant (white dots).
FIGURE 5
FIGURE 5
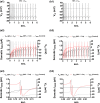
IERG amplitude increases in response to cell size reduction. (a1) In the absence of I ERG, a reduction of 50% in C m, with no change in G m, increases the spike count by seven spikes (from 13 to 20; 2.16 → 3.33 Hz, see Figure 2b). In the presence of I ERG, however, the spike count increases by one spike (from 13 to 14; 2.16 → 2.33 Hz). The APA was increased by 9.64 mV (from 98.46 to 108.1 mV). (a2) The increment in APA measured in a1 increases I ERG activation (black trace vs. red trace). The somatic I ERG mean value was augmented by ~22% (from 0.91 to 1.11 pA). Such enhanced amplitude was able to effectively dampen the expected raise in intrinsic firing after a 50% C m reduction. IERG mean value is defined as I¯ERG=1606IERGdt. The V m gray trace is identical to the V m trace in a1. (a3) The graph expands the content in a2 in the shown time interval. (b1) In the absence of I ERG, a reduction of 80% in C m, with no change in G m, increases the spike count by 15 spikes (from 13 to 28; 2.16 → 4.66 Hz, see Figure 2c). In the presence of I ERG, however, the spike count remains constant. The APA was increased by 14.93 mV (from 98.46 to 113.39 mV). (b2) The APA increment measured in C1 increases the I ERG mean value by ~37% (from 0.91 to 1.25 pA). This elevated amplitude was sufficient to prevent the expected raise in intrinsic firing after an 80% C m reduction. The V m gray trace is identical to the V m trace in b1. (b3) The graph expands the content in b2 in the shown time interval.
FIGURE 6
FIGURE 6
DA cell size reduction results in a paradoxical enhancement of the afferent‐evoked burst signal. AMPA (4 nS) and NMDA (15 nS) channels were placed in the distal dendrite. This compartment was then excited by a train of 10 glutamate squared pulses. Simulations in this figure include the ERG conductance in all compartments as no substantial differences were observed in its absence (data not shown). (a1) Control burst signal at the soma compartment. The EPSP summation that elicits this response is exposed by setting g Na = 0 in all compartments (dashed curve). C m and G m were held fixed. (b1) Burst signal after C m and G m are decreased by 30% and 15%, respectively. (c1) Burst signal after C m and G m are both decreased by 30%. (d1) Burst signal after C m and G m are decreased by 30% and 50%, respectively. a2, b2, c2, d2. Zoom in on the temporal summation recording in part 1. In c2, b2, and d2, the TSI has experienced a substantial depression relative to that of the control recording (a2), yet the average membrane depolarization has increased. Such behavior represents a paradoxical response according to the current view of the TSI. Notice that, in all figures relative to a1, the elevated average membrane depolarization is what underlies the reduced inter‐spike interval and elevated spike count.
FIGURE 7
FIGURE 7
A hypothesis that experimental evidence seems to validate may be shown to be erroneous by numerical simulation. Chronic morphine exposure results in smaller midbrain dopamine neurons that express an elevated spontaneous firing which as argues by qualitative reasoning is simply a consequence of the rise in the cell's input resistance (R N) after size reduction. Motivated by this apparently reasonable hypothesis, experimental studies have shown that concomitant to this increased excitation g K expression is substantially diminished and thus it is concluded that such finding is at least one of the main factors that elevate intrinsic activity. Computational analysis suggests, however, that we should rethink this conclusion even if the aforementioned evidence indicates otherwise. If this conclusion is correct then the appropriate homeostatic response that restores spontaneous activity should be the conservation of the pre‐exposure population size for each ion channel type; which elevates the number of channels per unit of membrane area for each distinct membrane conductance (see boxes below activity patterns in 1 and 2). The numerical recreation in 1 shows, nonetheless, that although this adaptation preserves R N and g K it did not prevent the elevation in cell firing. Moreover, in 2 R N has dropped, while g K has increased yet the cell spiking is not decelerated but further augmented. Surprisingly, and against the predominant descriptive reasoning that dominates the electrophysiological literature, 3 illustrates that the firing rate and spike waveform are insensitive to changes in cell size as long as the number of channels per unit of membrane area is preserved. Altogether, it signifies that the intrinsic firing pattern is only determined by the ion channel density of each conductance and not by the absolute magnitude of R N or g K. Notice that such counterintuitive observation emerges as a consequence of computational analysis and not as a result of real experimentation. Consequently, a hypothesis that experimental evidence seems to validate may be shown to be erroneous by numerical simulation.

Similar articles

References

    1. Angelo, K. , London, M. , Christensen, S. R. , & Hausser, M. (2007). Local and global effects of Ih distribution in dendrites of mammalian neurons. Journal of Neuroscience, 27(32), 8643–8653. - PMC - PubMed
    1. Arencibia‐Albite, F. , Paladini, C. , Williams, J. , & Jiménez‐Rivera, C. (2007). Noradrenergic modulation of the hyperpolarization‐activated cation current (Ih) in dopamine neurons of the ventral tegmental area. Neuroscience, 149(2), 303–314. - PMC - PubMed
    1. Arencibia‐Albite, F. , Vázquez, R. , Velásquez‐Martinez, M. C. , & Jiménez‐Rivera, C. A. (2012). Cocaine sensitization inhibits the hyperpolarization‐activated cation current Ih and reduces cell size in dopamine neurons of the ventral tegmental area. Journal of Neurophysiology, 107(8), 2271–2282. - PMC - PubMed
    1. Arencibia‐Albite, F. , Vázquez‐Torres, R. , & Jiménez‐Rivera, C. A. (2017). Cocaine sensitization increases subthreshold activity in dopamine neurons from the ventral tegmental area. Journal of Neurophysiology, 117(2), 612–623. - PMC - PubMed
    1. Brager, D. H. , & Johnston, D. (2007). Plasticity of intrinsic excitability during long‐term depression is mediated through mGluR‐dependent changes in Ih in hippocampal CA1 pyramidal neurons. Journal of Neuroscience, 27(51), 13926–13937. - PMC - PubMed

Publication types

LinkOut - more resources