

Immunotherapy response modeling by ex-vivo organ culture for lung cancer
- PMID: 33484295
- PMCID: PMC10992805
- DOI: 10.1007/s00262-020-02828-w
Immunotherapy response modeling by ex-vivo organ culture for lung cancer
Abstract
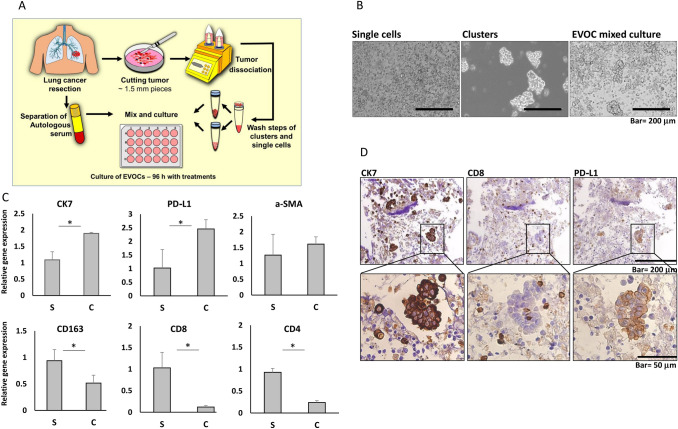
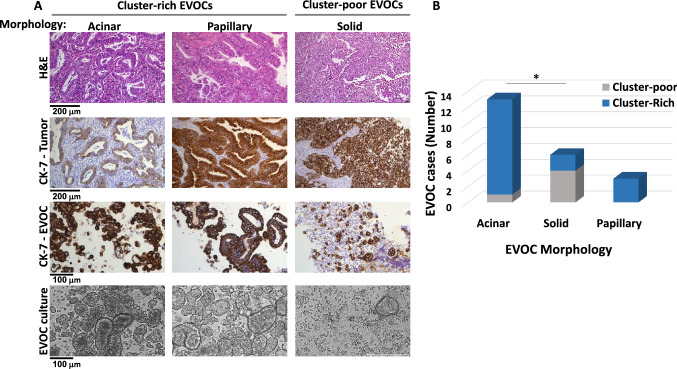
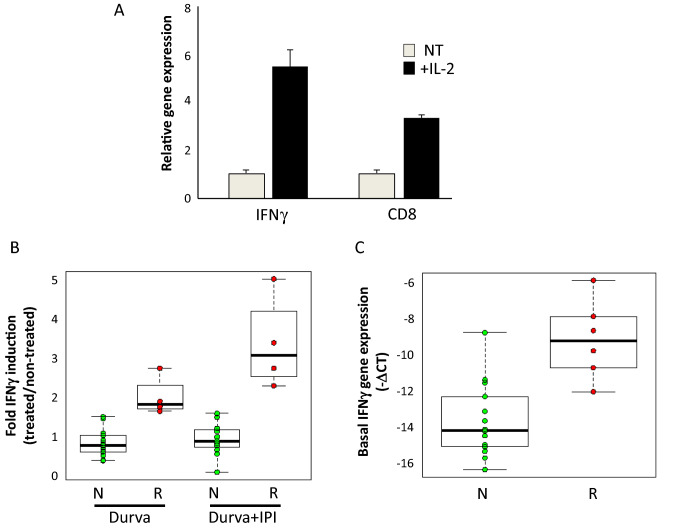
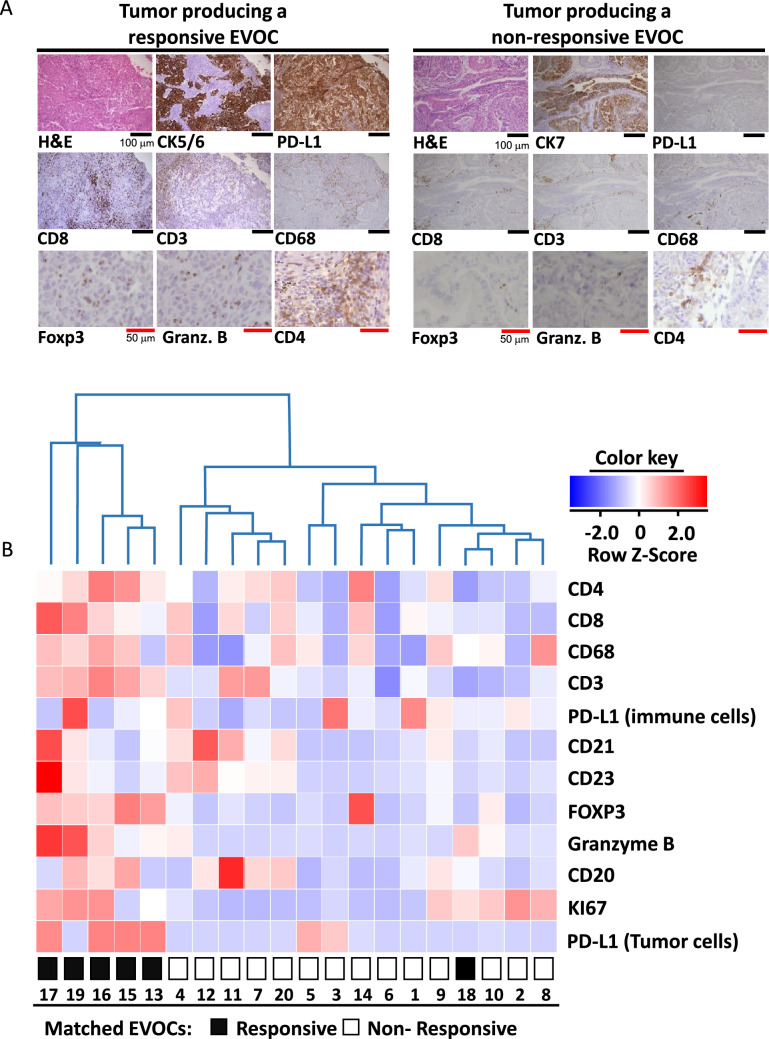
One of the major hurdles for the advancement of cancer immunotherapy is lack of robust, accessible experimental models. We aimed to produce an ex-vivo organ culture (EVOC) model of immunotherapy for non-small cell lung cancer (NSCLC). Freshly resected early stage tumors were collected from the operating room, fragmented to clusters < 450 µm and cultured with fetal calf serum and human autologous serum. The resulting EVOC includes cancer epithelial cells within tumor tissue clusters and immune cells. Original tissue features are reflected in the EVOCs. The response to immune checkpoint inhibitors (ICI) was assessed by IFNγ gene induction. Interestingly, IFNγ EVOC induction was numerically higher when anti-CTLA4 was added to anti-PD-L1 treatment, supporting the notion that anti-CTLA4 impacts cancer partly through tumor-resident immune cells. In parallel, immunohistochemistry (IHC) for key immune-related proteins was performed on the formalin-fixed paraffin embedded (FFPE) corresponding tumors. EVOC IFNγ induction by ICI correlated with basal non-induced IFNγ, CD8, CD4 and FOXP3 mRNA levels within EVOCs and with tumor-FFPE-IHC for CD8 and granzyme B. A weaker correlation was seen with tumor-FFPE-IHC for CD3, CD4, CD68, FOXP3 and tumor-PD-L1. Tertiary lymphoid structure density was also correlated with the ICI response. Our study provides novel data about biomarkers that correlate with ICI-induced response of early stage NSCLC. Retention of the microenvironment and minimal addition of exogenous factors suggest this model to reliably represent the original tumor. The cluster-based EVOC model we describe can provide a valuable, yet simple and widely applicable tool for the study of immunotherapy in NSCLC.
Keywords: Anti-CTLA4; Anti-PD-L1; Early-stage NSCLC; IFNγ; Tumor-microenvironment.
© 2021. The Author(s), under exclusive licence to Springer-Verlag GmbH, DE part of Springer Nature.
Conflict of interest statement
A.O. reports research funding for the institution from Boehringer Ingelheim, Roche, Sanofi-Aventis, Xcovery, AstraZeneca, BMS and MSD, advisory fees from Boehringer Ingelheim, MSD, Takeda and AstraZeneca, and honoraria from Takeda, Roche and Boehringer Ingelheim. J.B reports research funding for the institution from Roche, MSD, BMS, AstraZeneca, Pfizer, Abbvie, and consulting fees from Roche, MSD, BMS, AstraZeneca, Pfizer, Takeda, Novartis, Boehringer Ingelheim, VBL and Bayer. All reported above are unrelated to the submitted work; All other authors declare no potential conflict of interests.
Figures
Similar articles
-
Machine learning reveals a PD-L1-independent prediction of response to immunotherapy of non-small cell lung cancer by gene expression context.Eur J Cancer. 2020 Nov;140:76-85. doi: 10.1016/j.ejca.2020.09.015. Epub 2020 Oct 12. Eur J Cancer. 2020. PMID: 33059196
-
Analysis of the immune microenvironment in resected non-small cell lung cancer: the prognostic value of different T lymphocyte markers.Oncotarget. 2016 Aug 16;7(33):52849-52861. doi: 10.18632/oncotarget.10811. Oncotarget. 2016. PMID: 27463005 Free PMC article.
-
Immune profiling reveals the diverse nature of the immune response in NSCLC and reveals signaling pathways that may influence the anti-tumor immune response.Exp Mol Pathol. 2019 Aug;109:1-15. doi: 10.1016/j.yexmp.2019.04.004. Epub 2019 Apr 3. Exp Mol Pathol. 2019. PMID: 30953647
-
Therapeutic Implications of Tumor Microenvironment in Lung Cancer: Focus on Immune Checkpoint Blockade.Front Immunol. 2022 Jan 7;12:799455. doi: 10.3389/fimmu.2021.799455. eCollection 2021. Front Immunol. 2022. PMID: 35069581 Free PMC article. Review.
-
Immunotherapy: Beyond Anti-PD-1 and Anti-PD-L1 Therapies.Am Soc Clin Oncol Educ Book. 2016;35:e450-8. doi: 10.1200/EDBK_158712. Am Soc Clin Oncol Educ Book. 2016. PMID: 27249753 Review.
Cited by
-
Density of tertiary lymphoid structures and their correlation with prognosis in non-small cell lung cancer.Front Immunol. 2024 Aug 13;15:1423775. doi: 10.3389/fimmu.2024.1423775. eCollection 2024. Front Immunol. 2024. PMID: 39192984 Free PMC article.
-
Functional precision oncology using patient-derived assays: bridging genotype and phenotype.Nat Rev Clin Oncol. 2023 May;20(5):305-317. doi: 10.1038/s41571-023-00745-2. Epub 2023 Mar 13. Nat Rev Clin Oncol. 2023. PMID: 36914745 Review.
-
Biomedical Applications of Non-Small Cell Lung Cancer Spheroids.Front Oncol. 2021 Dec 7;11:791069. doi: 10.3389/fonc.2021.791069. eCollection 2021. Front Oncol. 2021. PMID: 34950592 Free PMC article. Review.
-
Lung Cancer Organoids: The Rough Path to Personalized Medicine.Cancers (Basel). 2022 Jul 29;14(15):3703. doi: 10.3390/cancers14153703. Cancers (Basel). 2022. PMID: 35954367 Free PMC article. Review.
-
Current challenges and practical aspects of molecular pathology for non-small cell lung cancers.Virchows Arch. 2024 Feb;484(2):233-246. doi: 10.1007/s00428-023-03651-1. Epub 2023 Oct 6. Virchows Arch. 2024. PMID: 37801103 Free PMC article. Review.
References
MeSH terms
Substances
Grants and funding
LinkOut - more resources
Full Text Sources
Other Literature Sources
Medical
Research Materials
