

Association of AI quantified COVID-19 chest CT and patient outcome
- PMID: 33484428
- PMCID: PMC7822756
- DOI: 10.1007/s11548-020-02299-5
Association of AI quantified COVID-19 chest CT and patient outcome
Abstract
Purpose: Severity scoring is a key step in managing patients with COVID-19 pneumonia. However, manual quantitative analysis by radiologists is a time-consuming task, while qualitative evaluation may be fast but highly subjective. This study aims to develop artificial intelligence (AI)-based methods to quantify disease severity and predict COVID-19 patient outcome.
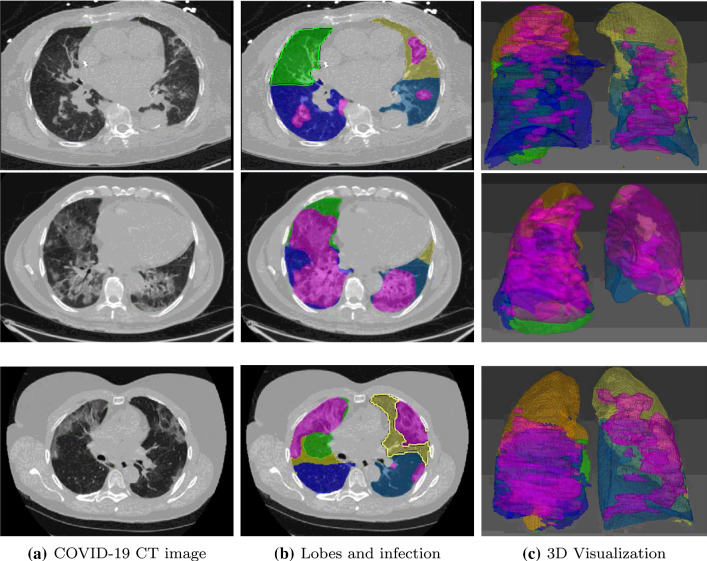
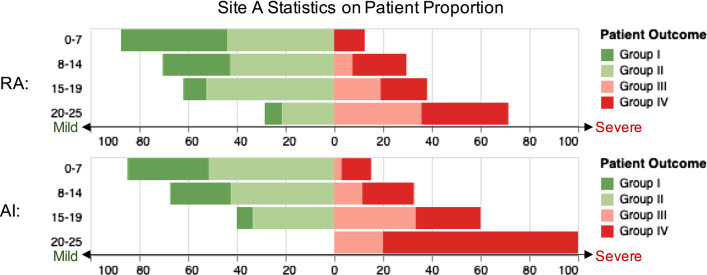
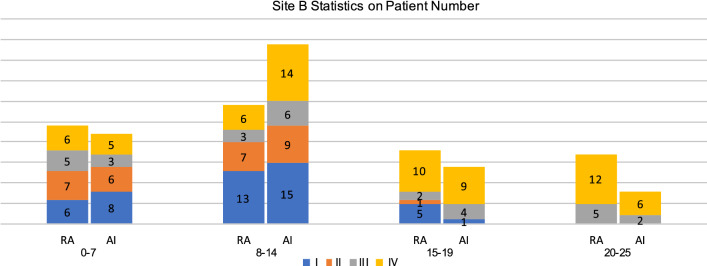
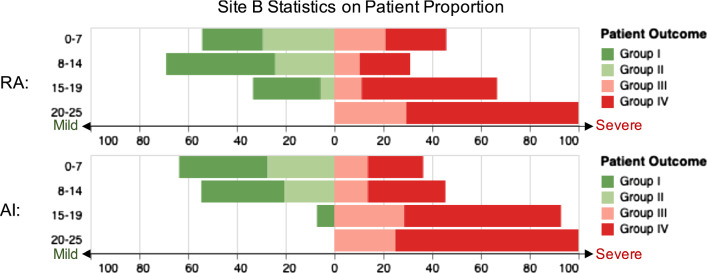
Methods: We develop an AI-based framework that employs deep neural networks to efficiently segment lung lobes and pulmonary opacities. The volume ratio of pulmonary opacities inside each lung lobe gives the severity scores of the lobes, which are then used to predict ICU admission and mortality with three different machine learning methods. The developed methods were evaluated on datasets from two hospitals (site A: Firoozgar Hospital, Iran, 105 patients; site B: Massachusetts General Hospital, USA, 88 patients).
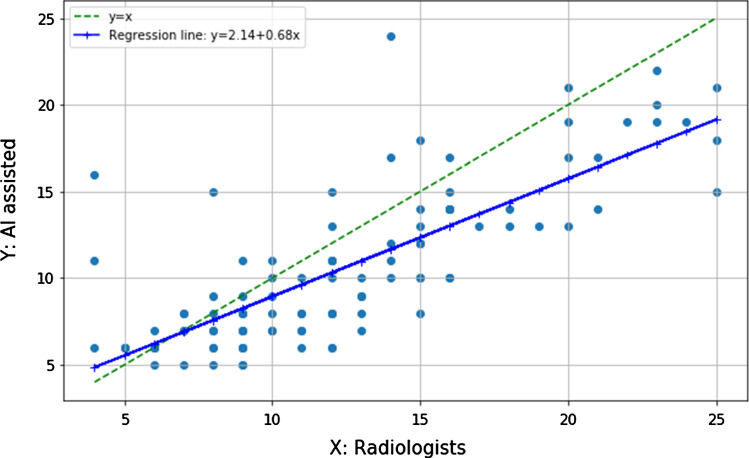
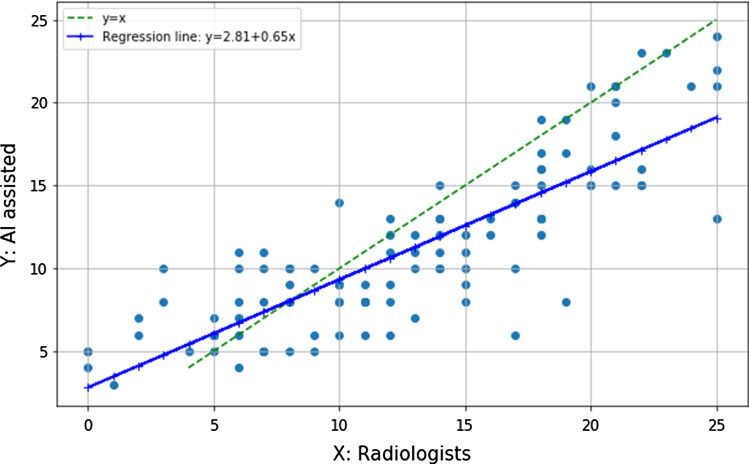
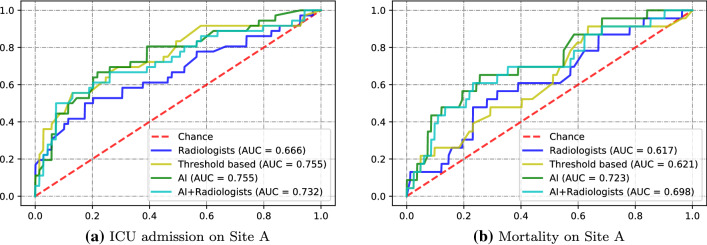
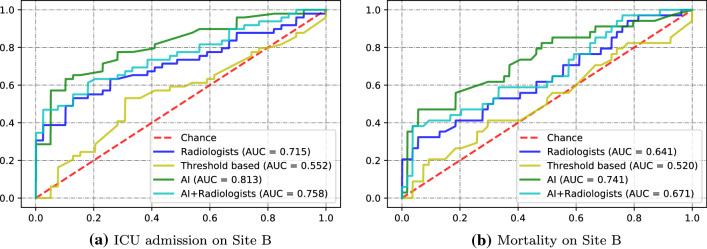
Results: AI-based severity scores are strongly associated with those evaluated by radiologists (Spearman's rank correlation 0.837, [Formula: see text]). Using AI-based scores produced significantly higher ([Formula: see text]) area under the ROC curve (AUC) values. The developed AI method achieved the best performance of AUC = 0.813 (95% CI [0.729, 0.886]) in predicting ICU admission and AUC = 0.741 (95% CI [0.640, 0.837]) in mortality estimation on the two datasets.
Conclusions: Accurate severity scores can be obtained using the developed AI methods over chest CT images. The computed severity scores achieved better performance than radiologists in predicting COVID-19 patient outcome by consistently quantifying image features. Such developed techniques of severity assessment may be extended to other lung diseases beyond the current pandemic.
Keywords: Artificial intelligence; COVID-19; Chest CT; Patient outcome; Severity scoring.
Conflict of interest statement
The authors declare that they have no conflict of interest.
Figures
References
-
- Chao H, Fang X, Zhang J, Homayounieh F, Arru CD, Digumarthy SR, Babaei R, Mobin HK, Mohseni I, Saba L, Carriero A, Falaschi Z, Pasche A, Wang G, Kalra MK, Yan P. Integrative analysis for COVID-19 patient outcome prediction. Med Image Anal. 2021;67:101844. doi: 10.1016/j.media.2020.101844. - DOI - PMC - PubMed
-
- Harmon SA, Sanford TH, Xu S, Turkbey EB, Roth H, Xu Z, Yang D, Myronenko A, Anderson V, Amalou A, Blain M, Kassin M, Long D, Varble N, Walker SM, Bagci U, Ierardi AM, Stellato E, Plensich GG, Franceschelli G, Girlando C, Irmici G, Labella D, Hammoud D, Malayeri A, Jones E, Summers RM, Choyke PL, Xu D, Flores M, Tamura K, Obinata H, Mori H, Patella F, Cariati M, Carrafiello G, An P, Wood BJ, Turkbey B. Artificial intelligence for the detection of COVID-19 pneumonia on Chest CT using multinational datasets. Nat Commun. 2020;11(1):4080. doi: 10.1038/s41467-020-17971-2. - DOI - PMC - PubMed
-
- He K, Zhao W, Xie X, Ji W, Liu M, Tang Z, Shi F, Gao Y, Liu J, Zhang J, Shen D (2020) Synergistic learning of lung lobe segmentation and hierarchical multi-instance classification for automated severity assessment of COVID-19 in CT images. arXiv preprint arXiv:2005.03832 - PMC - PubMed
MeSH terms
Grants and funding
LinkOut - more resources
Full Text Sources
Other Literature Sources
Medical
