. 2021 Jan;1(1):e14.
doi: 10.1002/cpz1.14.

N-Terminal Protein Labeling with N-Hydroxysuccinimide Esters and Microscale Thermophoresis Measurements of Protein-Protein Interactions Using Labeled Protein

Affiliations

N-Terminal Protein Labeling with N-Hydroxysuccinimide Esters and Microscale Thermophoresis Measurements of Protein-Protein Interactions Using Labeled Protein

Hanjie Jiang et al. Curr Protoc. 2021 Jan.

Erratum in

Abstract

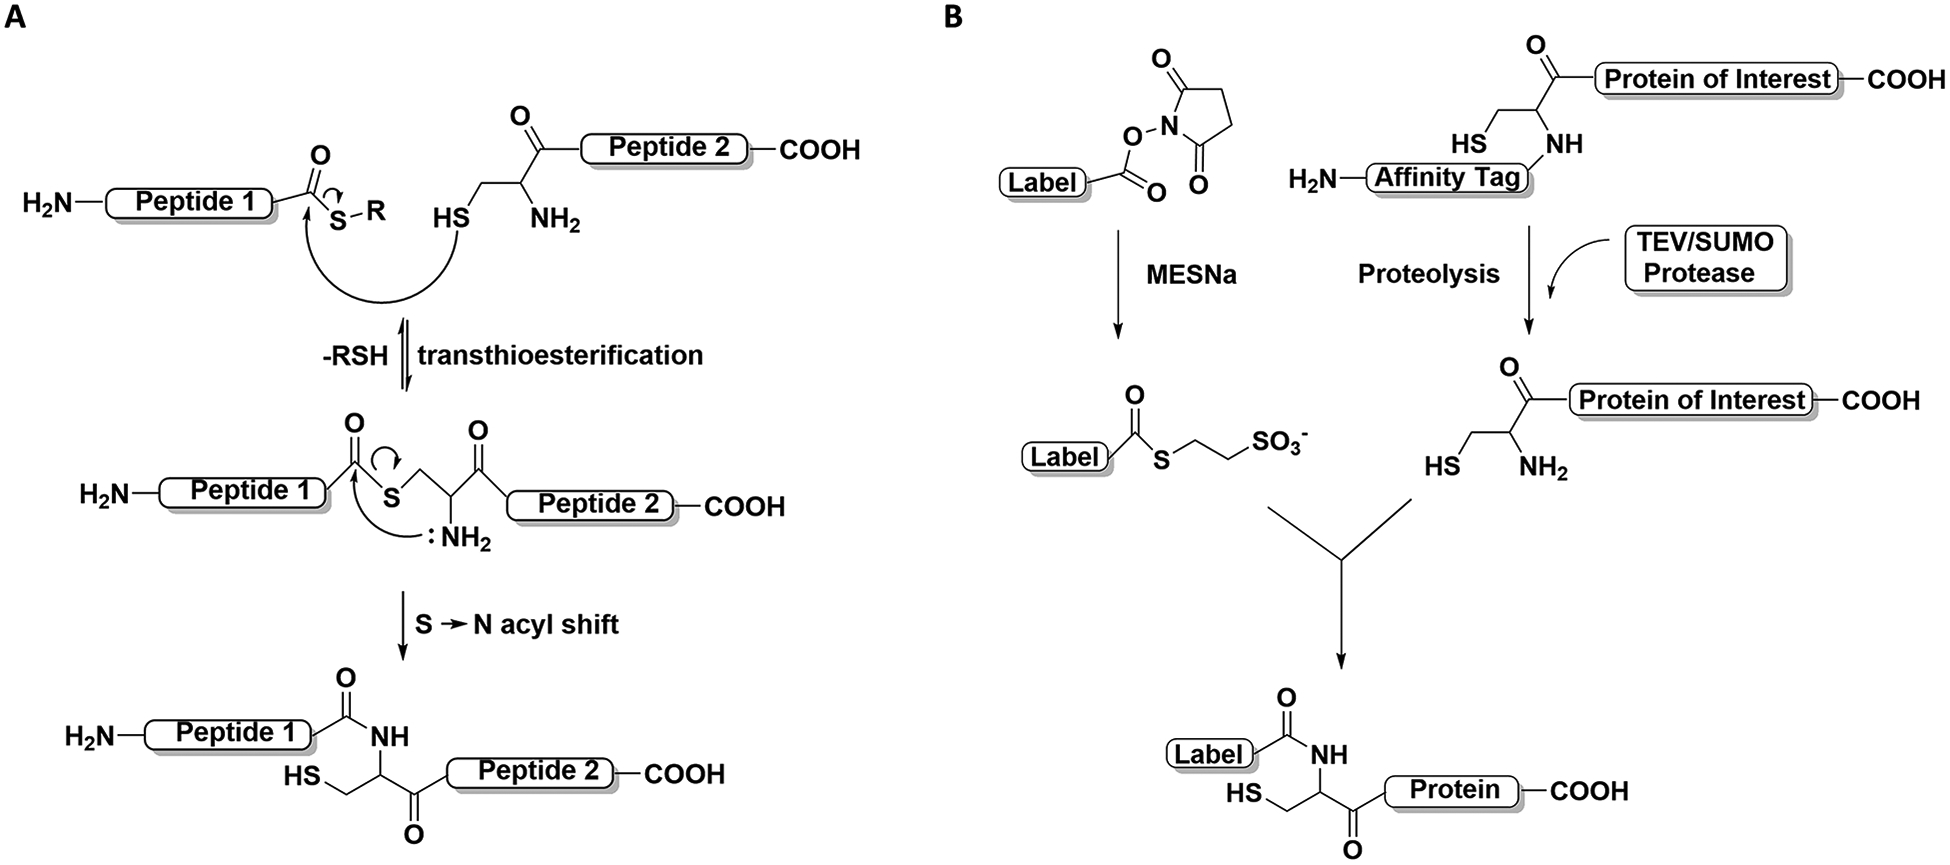
Protein labeling strategies have been explored for decades to study protein structure, function, and regulation. Fluorescent labeling of a protein enables the study of protein-protein interactions through biophysical methods such as microscale thermophoresis (MST). MST measures the directed motion of a fluorescently labeled protein in response to microscopic temperature gradients, and the protein's thermal mobility can be used to determine binding affinity. However, the stoichiometry and site specificity of fluorescent labeling are hard to control, and heterogeneous labeling can generate inaccuracies in binding measurements. Here, we describe an easy-to-apply protocol for high-stoichiometric, site-specific labeling of a protein at its N-terminus with N-hydroxysuccinimide (NHS) esters as a means to measure protein-protein interaction affinity by MST. This protocol includes guidelines for NHS ester labeling, fluorescent-labeled protein purification, and MST measurement using a labeled protein. As an example of the entire workflow, we additionally provide a protocol for labeling a ubiquitin E3 enzyme and testing ubiquitin E2-E3 enzyme binding affinity. These methods are highly adaptable and can be extended for protein interaction studies in various biological and biochemical circumstances. © 2021 Wiley Periodicals LLC. Basic Protocol 1: Labeling a protein of interest at its N-terminus with NHS esters through stepwise reaction Alternate Protocol: Labeling a protein of interest at its N-terminus with NHS esters through a one-pot reaction Basic Protocol 2: Purifying the N-terminal fluorescent-labeled protein and determining its concentration and labeling efficiency Basic Protocol 3: Using MST to determine the binding affinity of an N-terminal fluorescent-labeled protein to a binding partner. Basic Protocol 4: NHS ester labeling of ubiquitin E3 ligase WWP2 and measurement of the binding affinity between WWP2 and an E2 conjugating enzyme by the MST binding assay.

Keywords: N-hydroxysuccinimide ester; fluorescent label; microscale thermophoresis; native chemical ligation; protein-protein interaction.


Conflict of interest statement

CONFLICT OF INTEREST

The authors declare there are no conflicts of interest.

Figures

Figure 1
Figure 1. Outline of the protocols for N-terminal labeling with NHS ester and binding affinity measurement by MST.
Basic Protocol 1 describes how to conduct the NHS ester labeling reaction. Basic Protocol 2 describes how to purify the NHS ester labeling reaction and get the labeled protein ready for the MST measurement. Basic Protocol 3 describes the procedure to conduct the binding assay on an MST instrument.
Figure 2
Figure 2. Reaction mechanisms for N-terminal labeling with NHS ester.
(A) Native Chemical ligation (NCL) reaction mechanisms in steps. The key steps are shown, namely, the transthioesterification step and the S-to-N acyl shift step. (B) N-terminal Cys site-specific labeling with an NHS ester. The labeling reaction follows the NCL reaction mechanism to form an isopeptide bond between the label and the target protein.
Figure 3
Figure 3. Microscale thermophoresis instrument and MST binding assay.
(A) MST instrument layout. Monolith NT.115 is taken as an example. The infrared (IR) laser is included in the same light path of fluorescence excitation and detection through the dichroic mirror. Capillaries filled with MST samples are placed onto the capillary tray. LCD detector scans the MST samples in the capillaries one by one. (B) A representative MST trace, or the fluorescence intensity over time trace, is shown. Phases 1 to 4 represent different stages of thermophoresis. At time 0 sec, the IR laser is turned on. At 20s, the IR laser is turned off. Each stage is depicted in the cartoon on top, where the green circles represent the fluorescent labeled protein molecules, the red circle represents the region heated by the IR laser, and the arrows indicate the direction of movement of the fluorescent labeled molecules. (C) Different MST traces from bound and unbound target protein are shown. Four different MST traces are listed as examples. A representative unbound protein MST trace is colored in blue. A representative bound protein MST trace is colored in red. Two of the transient-state MST traces are colored in green and yellow. Note the MST trace shift from unbound to bound state. Fnorm represents normalized fluorescence intensity. (D) MST binding curve plotted using the thermophoresis signals Fnorm (normalized fluorescence intensity) on the y-axis versus the ligand concentrations (μM) on the x-axis. The example data points are colored as in Figure 3C.
Figure 4.
Figure 4.. Case study of measuring the binding affinity of the E3 FAM-WWP protein to the E2 enzyme UbcH5c.
(A) Capillary scan data from the MST pre-test confirms the target protein working concentration is well-selected and no adsorption to the capillaries is observed. (B) MST traces from the MST pre-test. Smooth and standard MST traces are acquired with no bumps, which verifies that the MST conditions are suitable. (C) Capillary scan data from the MST binding measurement. 16 capillaries are scanned and examined, showing symmetric peaks with proper intensities. (D) MST traces from the E2, E3 binding affinity measurement. The x-axis represents time (s), and the y-axis indicates Fnorm value measurement obtained by the MST instrument. 15s time-zone is selected (highlighted in red, Fhot, fluorescence in the heated zone) as it provides a decent signal to noise ratio. The time frame before the laser turning on is highlighted in blue (Fcold, fluorescence at the initial state or the cooled state) (E) Dose-response curve generated from three replicates. The x-axis is the log10 scale of the ligand concentration in molar. The y-axis represents Fnorm (per thousand) obtained at different ligand concentrations. The KD value was calculated using the isothermal binding equation model in the MO. Affinity Analysis software associated with the MST instrument.

References

    1. Anderson GW (1964). The Use of Activated Esters in Peptide Synthesis. Metabolism, 13, SUPPL:1026–1031. doi: 10.1016/s0026-0495(64)80022-6 - DOI - PubMed
    1. Antos JM, Chew G-L, Guimaraes CP, Yoder NC, Grotenbreg GM, Popp MW-L, & Ploegh HL (2009). Site-specific N- and C-terminal labeling of a single polypeptide using sortases of different specificity. J. Am. Chem. Soc, 131(31), 10800–10801. doi: 10.1021/ja902681k - DOI - PMC - PubMed
    1. Asmari M, Ratih R, Alhazmi HA, & El Deeb S (2018). Thermophoresis for characterizing biomolecular interaction. Methods, 146, 107–119. doi: 10.1016/j.ymeth.2018.02.003 - DOI - PubMed
    1. Baksh MM, Kussrow AK, Mileni M, Finn MG, & Bornhop DJ (2011). Label-free quantification of membrane-ligand interactions using backscattering interferometry. Nat. Biotechnol, 29(4), 357–360. doi: 10.1038/nbt.1790 - DOI - PMC - PubMed
    1. Berndsen CE, & Wolberger C (2014). New insights into ubiquitin E3 ligase mechanism. Nat Struct Mol Biol, 21(4), 301–307. doi: 10.1038/nsmb.2780 - DOI - PubMed

LinkOut - more resources