. 2021 Aug 2;113(8):1053-1064.
doi: 10.1093/jnci/djab003.

Deficit Accumulation Frailty Trajectories of Older Breast Cancer Survivors and Non-Cancer Controls: The Thinking and Living With Cancer Study

Affiliations

Deficit Accumulation Frailty Trajectories of Older Breast Cancer Survivors and Non-Cancer Controls: The Thinking and Living With Cancer Study

Jeanne S Mandelblatt et al. J Natl Cancer Inst. .

Abstract

Background: We evaluated deficit accumulation and how deficits affected cognition and physical activity among breast cancer survivors and non-cancer controls.

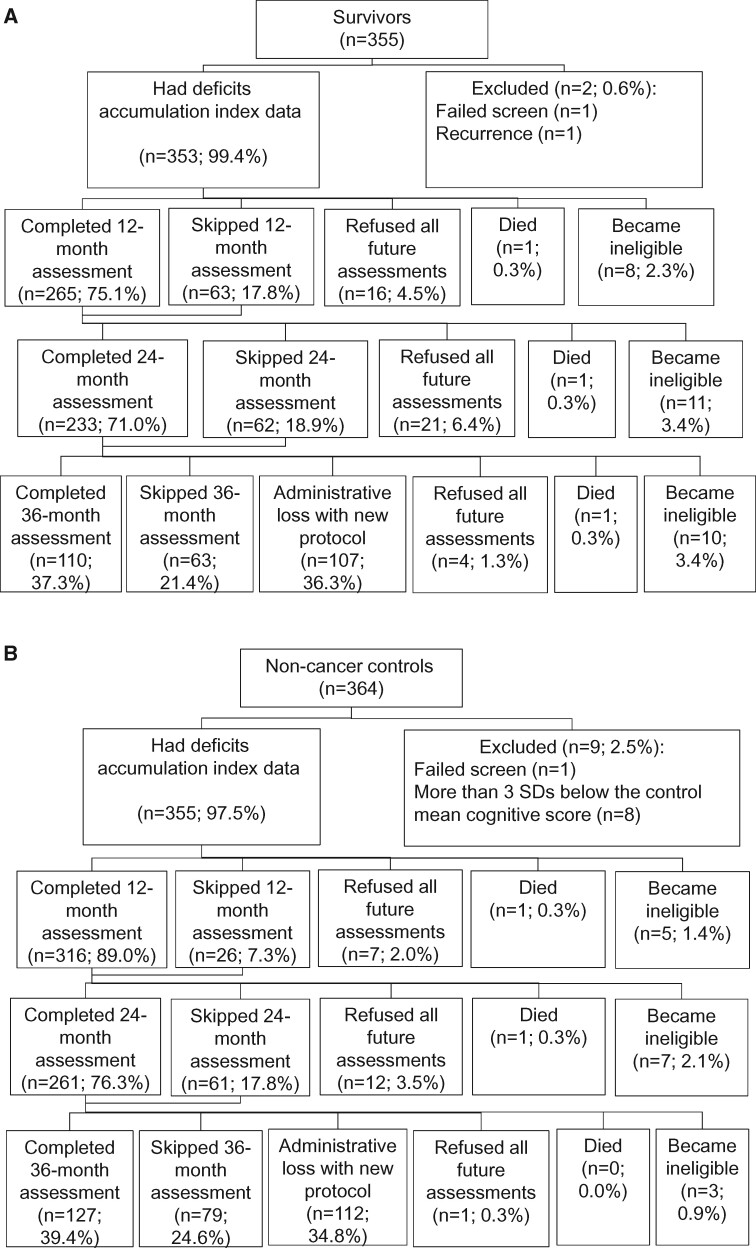
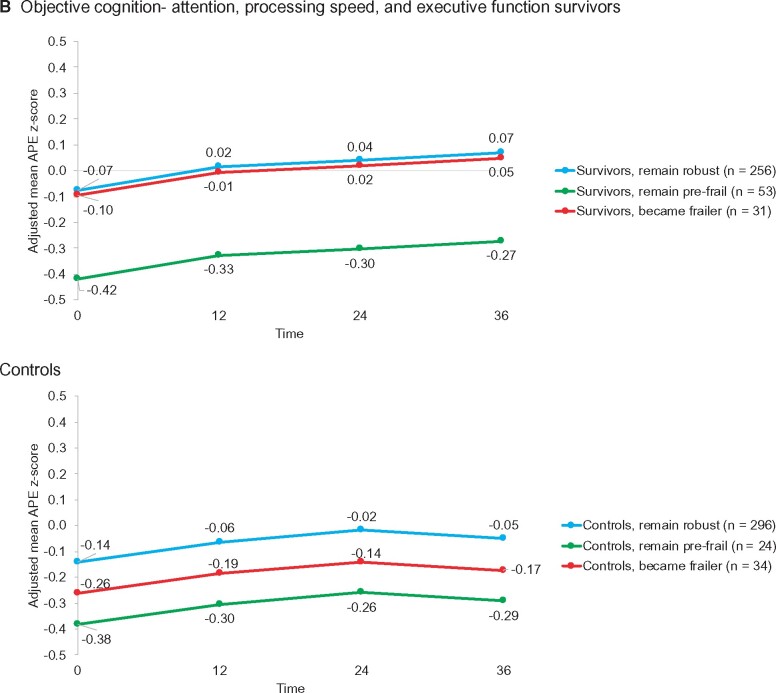
Methods: Newly diagnosed nonmetastatic survivors (n = 353) and matched non-cancer controls (n = 355) ages 60-98 years without neurological impairments were assessed presystemic therapy (or at enrollment for controls) from August 2010 to December 2016 and followed for 36 months. Scores on a 42-item index were analyzed in growth-mixture models to determine deficit accumulation trajectories separately and combined for survivors and controls. Multilevel models tested associations between trajectory and cognition (FACT-Cog and neuropsychological tests) and physical activity (IPAQ-SF) for survivors and controls.

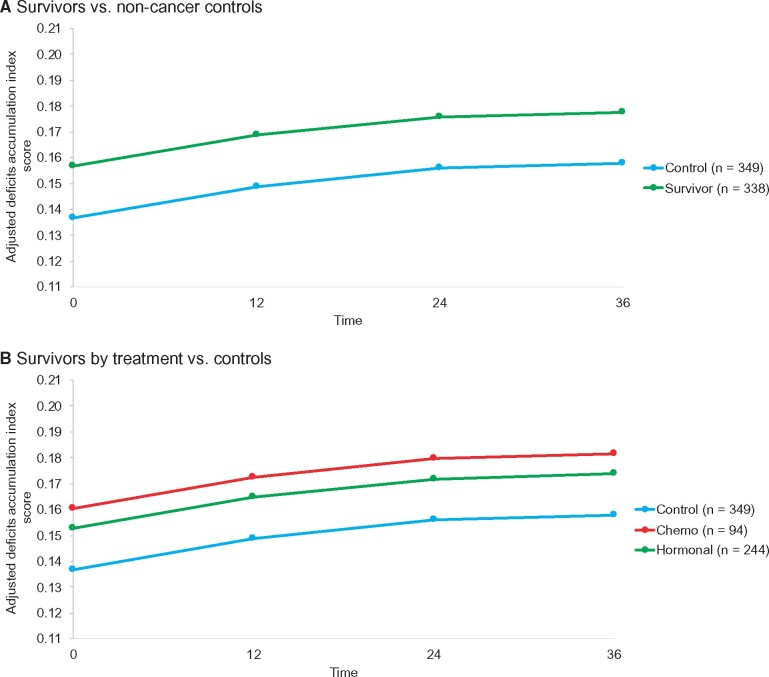
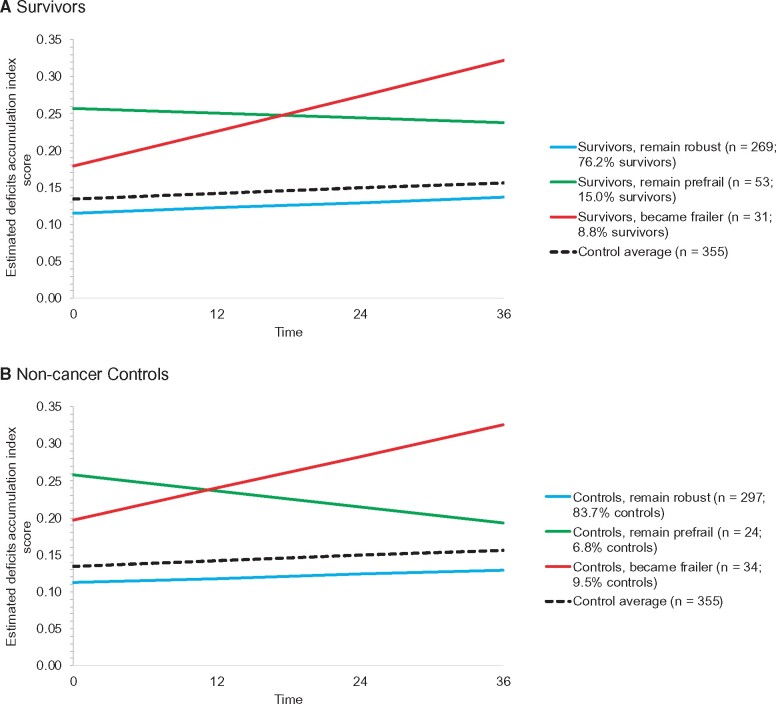
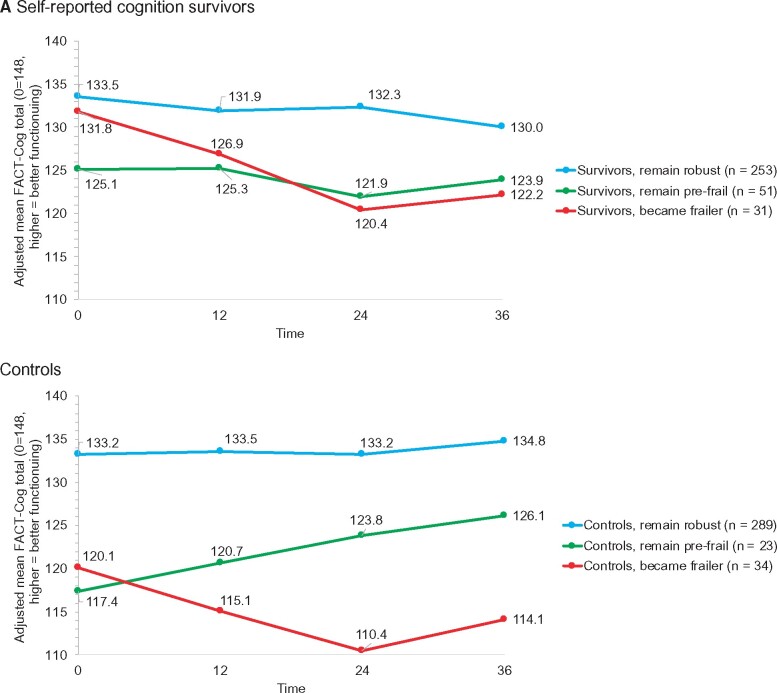
Results: Deficit accumulation scores were in the robust range, but survivors had higher scores (95% confidence intervals [CI]) than controls at 36 months (0.18, 95% CI = 0.16 to 0.19, vs 0.16, 95% CI = 0.14 to 0.17; P = .001), and averages included diverse deficit trajectories. Survivors who were robust but became frailer (8.8%) had similar baseline characteristics to those remaining robust (76.2%) but experienced a 9.6-point decline self-reported cognition (decline of 9.6 vs 3.2 points; P = .04) and a 769 MET minutes per week decline in physical activity (P < .001). Survivors who started and remained prefrail (15.0%) had self-reported and objective cognitive problems. At baseline, frail controls (9.5%) differed from robust controls (83.7%) on deficits and self-reported cognition (P < .001). Within combined trajectories, frail survivors had more sleep disturbances than frail controls (48.6% [SD = 17.4%] vs 25.0% [SD = 8.2%]; P = .05).

Conclusions: Most survivors and controls remained robust, and there were similar proportions on a frail trajectory. However, there were differences in deficit patterns between survivors and controls. Survivor deficit accumulation trajectory was associated with patient-reported outcomes. Additional research is needed to understand how breast cancer and its treatments affect deficit accumulation.


Figures

Figure 1.
Figure 1.
Sample for evaluation of deficits accumulation in older breast cancer survivors and matched non-cancer controls. The percent consenting and refusing was calculated among those alive and eligible to continue the study at each timepoint. Eligibility for continuing in the study was the same as enrollment eligibility and included development of a neurological disease (eg, stroke, Parkinson disease) and being diagnosed with cancer. Data for survivors who were diagnosed with a breast cancer recurrence were excluded starting from 6 months prior to the diagnosis of recurrence. Participants may have skipped a follow-up assessment at 1 timepoint but completed later assessments. Most participants completed 3-4 assessments; 14.8% (17.0% of survivors and 12.6% of controls) completed 2 assessments, and 14.0% (19.5% of survivors and 8.5% of controls) completed baseline only. Analytic models used all data available.
Figure 2.
Figure 2.
Adjusted mean deficits accumulation scores for older breast cancer survivors and frequency-matched controls. A) Shows adjusted mean deficits accumulation index scores in survivors (green) and controls (blue) from mixed models using least square mean outcome values adjusted for baseline covariates (see Supplementary Tables 4 and 5, available online). B) Adjusted mean deficits accumulation index scores are shown for survivors exposed to chemotherapy with or without hormonal therapy (red), survivors exposed to hormonal therapy only (blue), and controls (green) derived from mixed models using least square mean outcome values adjusted for baseline covariates (see Supplementary Tables 4 and 5, available online). On both panels, the models used data from all women and all timepoints they contributed.
Figure 3.
Figure 3.
Deficits accumulation index frailty trajectory groups. Deficits accumulation index scores at each assessment were used to derive trajectory groups using growth mixture models. Data were used from all women and all timepoints they contributed. The number of groups was determined by having at least 2% of participants in a group, likelihood ratio tests, the smallest Bayesian information criterion (BIC), and a priori expectation. Based on these criteria, 3 groups best fit the data for each group. The 3 trajectories were statistically significantly different from each other in both the survivor and control models, and the 3 survivor trajectory groups were statistically significantly different than the average of the overall control group (dotted black line) (all 2-sided P < .001 from growth mixture models).
Figure 4.
Figure 4.
Outcomes over 36 months in survivors and controls by deficits accumulation index trajectory group. A) Adjusted mean self-reported cognitive function based on FACT-cog total scores (range = 0-148, higher is better function) by deficits accumulation frailty score trajectory groups from separate mixed models for survivors and controls. Least square mean values for each timepoint for each trajectory group were adjusted for baseline covariates (age, race, Wide Range Achievement Test [WRAT] scores, time, treatment group [survivors only], trajectory group by time interaction, and recruitment site). Among survivors, there were clinically meaningful (7-10 points) and statistically significant differences (P = .002) in cognition scores by trajectory group, but the group by time interaction was not statistically significant (P = .10). Among controls, there were also clinically meaningful (7-10 points) and statistically significant differences (P < .001) in cognition scores by trajectory groups, and the group differences varied over time (group by time interaction P = .001). Detailed results are available in Supplementary Tables 6 and 7 (available online). B) Adjusted objective cognitive test z scores for the attention, processing speed, and executive function (APE) by deficits accumulation frailty score trajectory groups from separate mixed models for survivors and controls. Least square mean values for each timepoint for each trajectory group were adjusted for baseline covariates (age, race, WRAT scores, time, treatment group [survivors only], and recruitment site). Because there were no differences in scores among groups over time, an interaction of group by time was not included in the final models. Among survivors (P < .001) and controls (P = 0.03), the prefrail trajectory group had statistically significantly lower scores over time than the robust groups, and the survivor group that became frailer was not different from the robust group at baseline but was different among controls. Detailed results are available in Supplementary Tables 8 and 9 (available online). C) Adjusted mean MET minutes per week based on IPAQ-SF by deficits accumulation frailty score trajectory groups from separate mixed models for survivors and controls. Least square mean values for each timepoint for each trajectory group were adjusted for baseline covariates (age, race, WRAT scores, time, treatment group [survivors only], trajectory group by time interaction [survivors only; interaction NS in controls], and recruitment site). Survivor trajectory groups differed over time (P < .05), and in post hoc comparisons, the group that started robust and became frailer had statistically significantly lower physical activity levels over time than those in the group that remained robust (P < .001); the prefrail group also had lower physical activity than the robust group (P = .013). Control deficits accumulation frailty trajectory groups were different from each other in mean physical activity levels (P < .001), but physical activity did not change over time for the groups. Detailed results are available in Supplementary Tables 12 and 13 (available online). Data on all panels were derived from all data available for all women at all time points. Blue = remains robust; green = prefrail; red = frail or becomes frailer.
Figure 4.
Figure 4.
Outcomes over 36 months in survivors and controls by deficits accumulation index trajectory group. A) Adjusted mean self-reported cognitive function based on FACT-cog total scores (range = 0-148, higher is better function) by deficits accumulation frailty score trajectory groups from separate mixed models for survivors and controls. Least square mean values for each timepoint for each trajectory group were adjusted for baseline covariates (age, race, Wide Range Achievement Test [WRAT] scores, time, treatment group [survivors only], trajectory group by time interaction, and recruitment site). Among survivors, there were clinically meaningful (7-10 points) and statistically significant differences (P = .002) in cognition scores by trajectory group, but the group by time interaction was not statistically significant (P = .10). Among controls, there were also clinically meaningful (7-10 points) and statistically significant differences (P < .001) in cognition scores by trajectory groups, and the group differences varied over time (group by time interaction P = .001). Detailed results are available in Supplementary Tables 6 and 7 (available online). B) Adjusted objective cognitive test z scores for the attention, processing speed, and executive function (APE) by deficits accumulation frailty score trajectory groups from separate mixed models for survivors and controls. Least square mean values for each timepoint for each trajectory group were adjusted for baseline covariates (age, race, WRAT scores, time, treatment group [survivors only], and recruitment site). Because there were no differences in scores among groups over time, an interaction of group by time was not included in the final models. Among survivors (P < .001) and controls (P = 0.03), the prefrail trajectory group had statistically significantly lower scores over time than the robust groups, and the survivor group that became frailer was not different from the robust group at baseline but was different among controls. Detailed results are available in Supplementary Tables 8 and 9 (available online). C) Adjusted mean MET minutes per week based on IPAQ-SF by deficits accumulation frailty score trajectory groups from separate mixed models for survivors and controls. Least square mean values for each timepoint for each trajectory group were adjusted for baseline covariates (age, race, WRAT scores, time, treatment group [survivors only], trajectory group by time interaction [survivors only; interaction NS in controls], and recruitment site). Survivor trajectory groups differed over time (P < .05), and in post hoc comparisons, the group that started robust and became frailer had statistically significantly lower physical activity levels over time than those in the group that remained robust (P < .001); the prefrail group also had lower physical activity than the robust group (P = .013). Control deficits accumulation frailty trajectory groups were different from each other in mean physical activity levels (P < .001), but physical activity did not change over time for the groups. Detailed results are available in Supplementary Tables 12 and 13 (available online). Data on all panels were derived from all data available for all women at all time points. Blue = remains robust; green = prefrail; red = frail or becomes frailer.

References

    1. Armenian SH, Gibson CJ, Rockne RC, et al. Premature aging in young cancer survivors. J Natl Cancer Inst. 2019;111(3):226–232. - PubMed
    1. Alfano CM, Peng J, Andridge RR, et al. Inflammatory cytokines and comorbidity development in breast cancer survivors versus noncancer controls: evidence for accelerated aging? J Clin Oncol. 2017;35(2):149–156. - PMC - PubMed
    1. Hodes RJ, Sierra F, Austad SN, et al. Disease drivers of aging. Ann NY Acad Sci. 2016;1386(1):45–68. - PMC - PubMed
    1. Guida JL, Ahles TA, Belsky D, et al. Measuring aging and identifying aging phenotypes in cancer survivors. J Natl Cancer Inst. 2019;111(12):1245–1254. - PMC - PubMed
    1. Ness KK, Wogksch MD.. Frailty and aging in cancer survivors. Transl Res. 2020;221:65–82. - PMC - PubMed

Publication types