. 2021 Mar 22;31(6):1165-1174.e6.
doi: 10.1016/j.cub.2020.12.034. Epub 2021 Jan 22.

Binocular integration of retinal motion information underlies optic flow processing by the cortex

Affiliations

Binocular integration of retinal motion information underlies optic flow processing by the cortex

Rune Nguyen Rasmussen et al. Curr Biol. .

Abstract

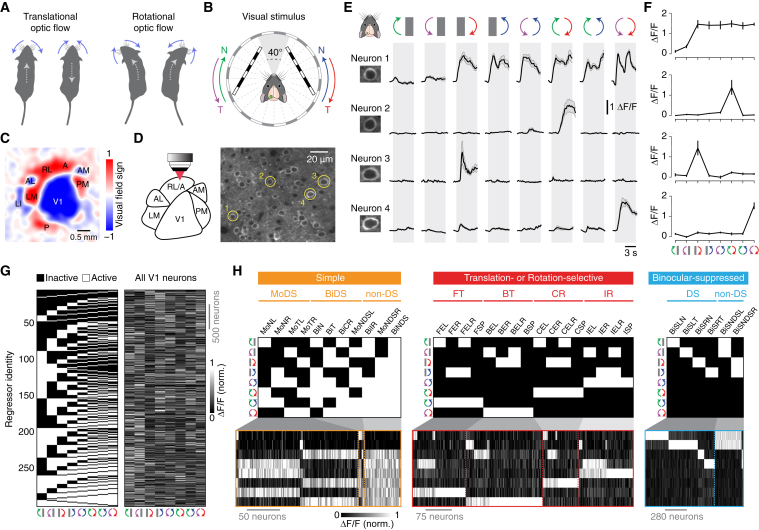
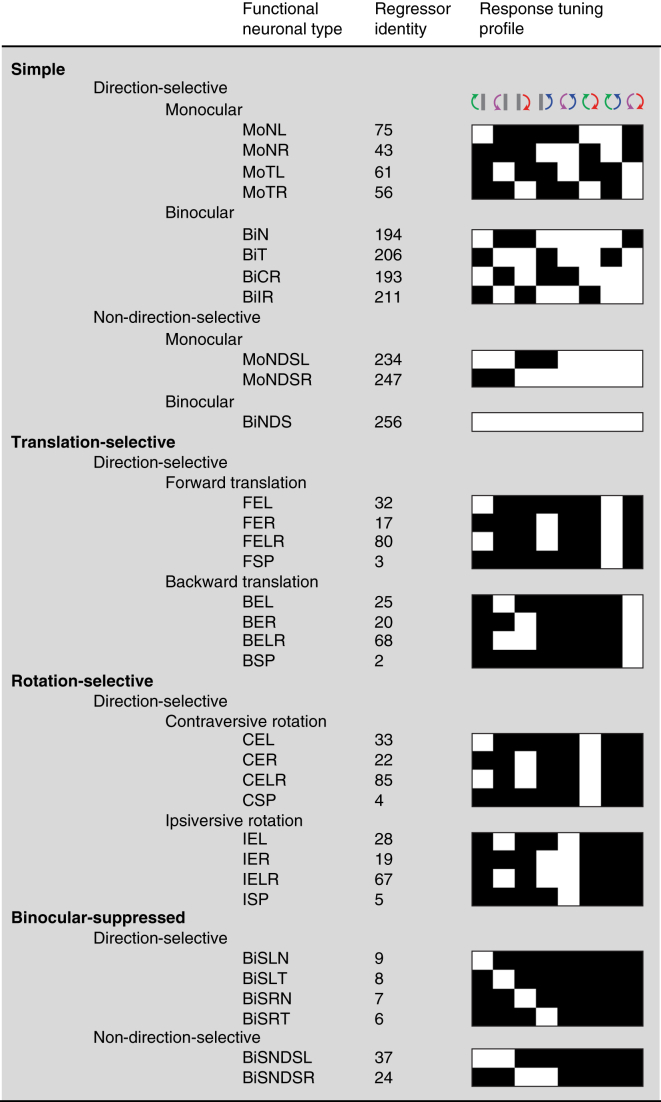
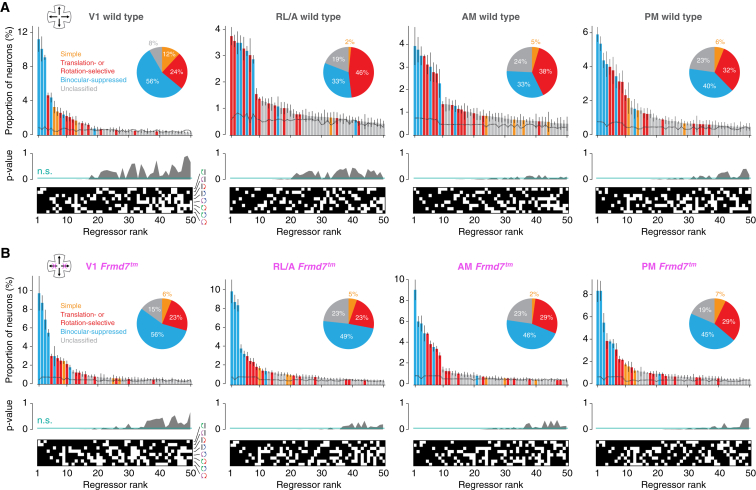
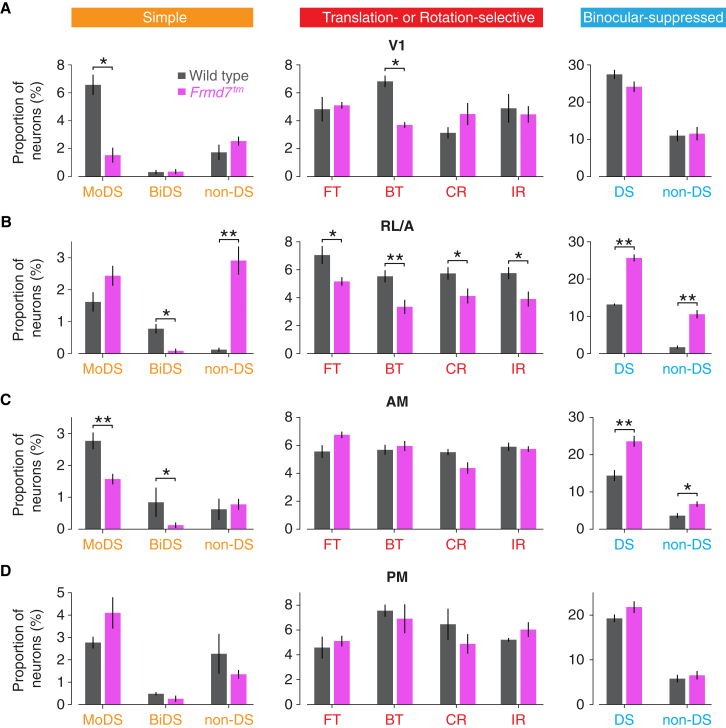
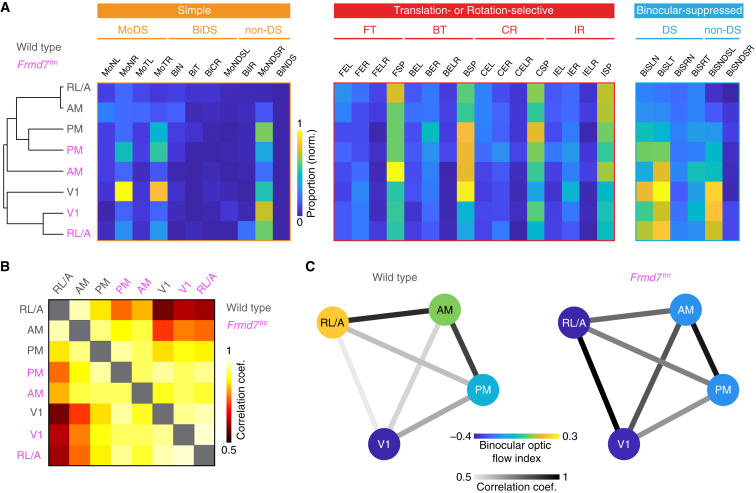
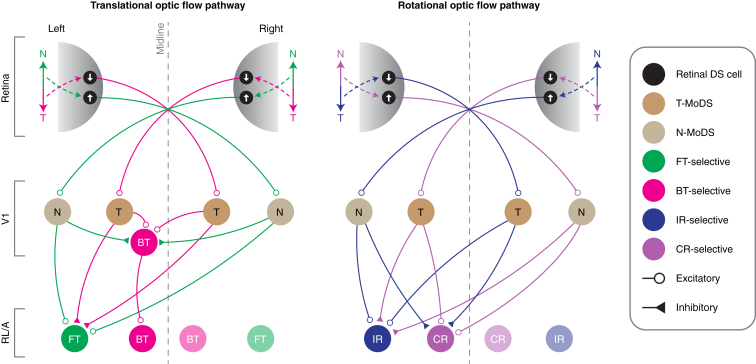
Locomotion creates various patterns of optic flow on the retina, which provide the observer with information about their movement relative to the environment. However, it is unclear how these optic flow patterns are encoded by the cortex. Here, we use two-photon calcium imaging in awake mice to systematically map monocular and binocular responses to horizontal motion in four areas of the visual cortex. We find that neurons selective to translational or rotational optic flow are abundant in higher visual areas, whereas neurons suppressed by binocular motion are more common in the primary visual cortex. Disruption of retinal direction selectivity in Frmd7 mutant mice reduces the number of translation-selective neurons in the primary visual cortex and translation- and rotation-selective neurons as well as binocular direction-selective neurons in the rostrolateral and anterior visual cortex, blurring the functional distinction between primary and higher visual areas. Thus, optic flow representations in specific areas of the visual cortex rely on binocular integration of motion information from the retina.

Keywords: direction-selective cells; intrinsic signal optical imaging; optic flow; retina; rotation; translation; two-photon calcium imaging; visual cortex.


Conflict of interest statement

Declaration of interests The authors declare no competing interests.

Figures

Figure 1
Figure 1
Discrete neuronal responses to motion stimuli in monocular visual fields can be imaged in the visual cortex of awake mice (A) Diagram illustrating optic flow patterns induced by self-motion. Forward and backward movements induce translational optic flow (left), and leftward and rightward turns induce rotational optic flow (right). Blue arrows indicate the dominant apparent motions in the visual space surrounding the mouse; gray dotted arrows indicate direction of locomotion. (B) Diagram of the visual stimulus setup. Spherically corrected gratings moved in either nasal (N) or temporal (T) directions (10°/s or 40°/s with 0.03 cycles/°). The stimulus was not displayed in the binocular visual field (frontal 40°) to ensure stimulation of only the monocular visual fields. Imaging was performed in the visual cortex of the left hemisphere. (C) Visual field sign map obtained with intrinsic signal optical imaging showing the location of visual cortical areas. (D) (Left) Two-photon imaging was performed from identified visual cortical areas. (Right) Example image of GCaMP6f-expressing neurons in layer 2/3 of V1 is shown. (E) Example trial-averaged fluorescence intensity (ΔF/F) time courses for the neurons highlighted in (D) in response to monocular and binocular motion at 10°/s. Error bars are mean ± SEM. (F) Tuning curves of the neurons in (E). Error bars are mean ± SEM. (G) (Left) Map of all 256 regressors. (Right) Response matrix of the tuning curves for all consistently responsive V1 neurons is shown. (H) Regressor profiles and tuning curves for V1 neurons assigned to functional groups within the simple, translation- or rotation-selective, and binocular-suppressed response classes. BiDS, binocular DS; BiS, binocular suppressed; BT, backward translational; CR, contraversive rotational; E, excited by; FT, forward translational; IR, ipsiversive rotational; L, left eye; MoDS, monocular DS; N, nasalward; NDS, non-DS; R, right eye; SP, specific; T, temporalward. See also Table S1, Figures S1–S4, and Video S1.
Figure 2
Figure 2
Summary of response types and terminology Figure providing an overview of the response classes, functional groups, and response types together with their corresponding regressor identity and response profile.
Figure 3
Figure 3
The RL/A area of the visual cortex is enriched with optic-flow-selective neurons in wild-type mice Top: ranked distribution of the 50 most abundant response types and response classes in the V1, RL/A, AM, and PM areas of wild-type mice (A) and Frmd7tm mice with disrupted retinal direction selectivity along the horizontal axis (B). Dotted line denotes chance level obtained from averaging distributions from shuffled response profiles generated by bootstrapping (500 samples). Error bars are mean ± SEM. Middle: p values indicating the probability of proportions being higher in the shuffled than in the original dataset are shown. Values above the green line are not significant (n.s.) (p ≥ 0.05). Bottom: corresponding ranked regressor profiles are shown (white, active; black, inactive). Inset: pie chart shows proportion of neurons within response classes for the significantly overrepresented (p < 0.05) response types. See also Table S1 and Figures S3–S5.
Figure 4
Figure 4
Retinal direction selectivity contributes to optic-flow-selective responses in an area-specific manner Proportion of V1 (A), RL/A (B), AM (C), and PM (D) neurons in simple, translation- or rotation-selective, and binocular-suppressed functional groups for wild-type and Frmd7tm mice. Error bars are mean ± SEM. p < 0.05; ∗∗p < 0.01; two-sided Mann-Whitney U test. See also Figure S6.
Figure 5
Figure 5
Retinal direction selectivity establishes functional segregation between V1 and RL/A (A) (Left) Hierarchy showing similarity in proportion of functional response types between visual areas in wild-type and Frmd7tm mice. (Right) Mean proportion of neurons in simple, translation- or rotation-selective, and binocular-suppressed functional response types between visual areas in wild-type and Frmd7tm mice is shown, sorted according to the similarity hierarchy (left). (B) Correlation in functional response type proportions between visual areas and genetic groups. (C) Diagram of the binocular optic flow index for each visual area, and the correlation in functional response type proportions between areas, in wild-type and Frmd7tm mice.
Figure 6
Figure 6
Proposed circuit model for translational and rotational optic flow processing Left: FT optic flow activates nasal motion-preferring DS cells in the left and right retinas, mediating activity in nasal (N) motion-preferring MoDS (N-MoDS) neurons in V1 of both hemispheres, and subsequently their combination in FT-selective neurons in area RL/A. Activity in N-MoDS neurons also inhibits BT-selective neurons. BT optic flow activates temporal (T) motion-preferring DS cells in the left and right retinas, mediating activity in temporal motion-preferring MoDS (T-MoDS) neurons in V1 of both hemispheres, and subsequently their combination in BT-selective neurons in V1 and RL/A. Activity in T-MoDS neurons also inhibits FT-selective neurons. Right: IR optic flow activates temporal and nasal motion-preferring DS cells in the left and right retinas, respectively, mediating activity in N- and T-MoDS neurons in V1 of the left and right hemispheres, respectively. The signals from these V1 neurons, in turn, combine at IR-selective neurons in RL/A of the left hemisphere, and their activity inhibits CR-selective neurons in the left hemisphere. CR optic flow activates nasal and temporal motion-preferring DS cells in the left and right retinas, respectively, mediating activity in T- and N-MoDS neurons in V1 of the left and right hemispheres, respectively. The signals from these V1 neurons, in turn, combine at CR-selective neurons in RL/A of the left hemisphere, and their activity inhibits IR-selective neurons of the left hemisphere. The wiring diagram is expected to be mirror symmetric in relation to the midline.

Similar articles

Cited by

References

    1. Krapp H.G., Hengstenberg R., Egelhaaf M. Binocular contributions to optic flow processing in the fly visual system. J. Neurophysiol. 2001;85:724–734. - PubMed
    1. Farrow K., Haag J., Borst A. Nonlinear, binocular interactions underlying flow field selectivity of a motion-sensitive neuron. Nat. Neurosci. 2006;9:1312–1320. - PubMed
    1. Kubo F., Hablitzel B., Dal Maschio M., Driever W., Baier H., Arrenberg A.B. Functional architecture of an optic flow-responsive area that drives horizontal eye movements in zebrafish. Neuron. 2014;81:1344–1359. - PubMed
    1. Naumann E.A., Fitzgerald J.E., Dunn T.W., Rihel J., Sompolinsky H., Engert F. From whole-brain data to functional circuit models: the zebrafish optomotor response. Cell. 2016;167:947–960.e20. - PMC - PubMed
    1. Wylie D.R.W., Bischof W.F., Frost B.J. Common reference frame for neural coding of translational and rotational optic flow. Nature. 1998;392:278–282. - PubMed

Publication types

LinkOut - more resources