. 2021 Feb 8;56(3):356-365.e9.
doi: 10.1016/j.devcel.2020.12.020. Epub 2021 Jan 22.

Transit-Amplifying Cells Coordinate Changes in Intestinal Epithelial Cell-Type Composition

Affiliations

Transit-Amplifying Cells Coordinate Changes in Intestinal Epithelial Cell-Type Composition

Laura E Sanman et al. Dev Cell. .

Abstract

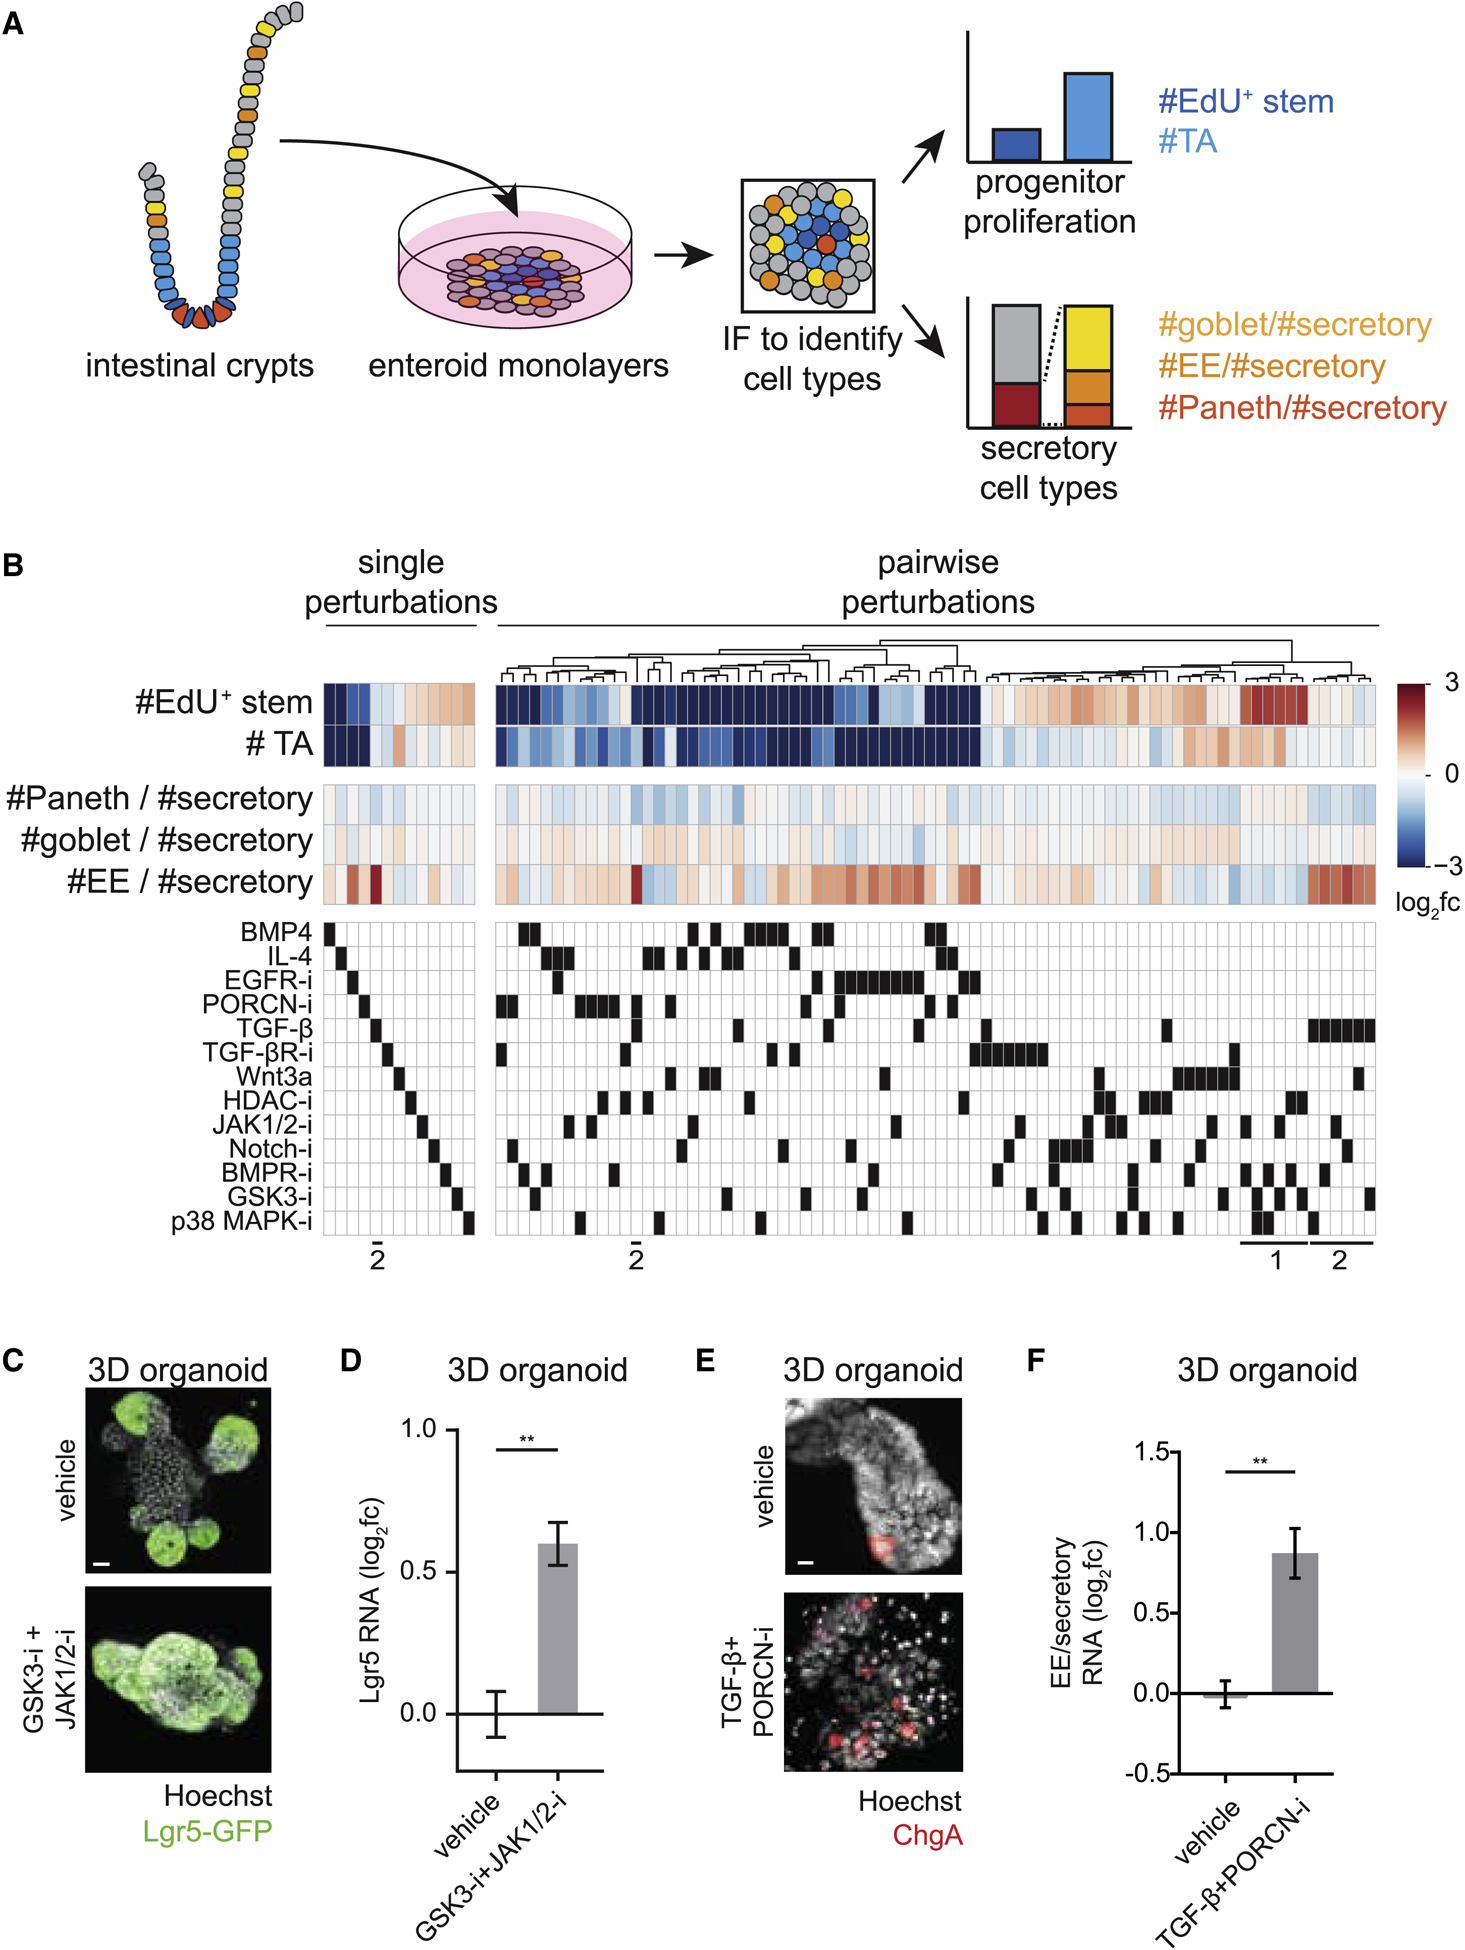
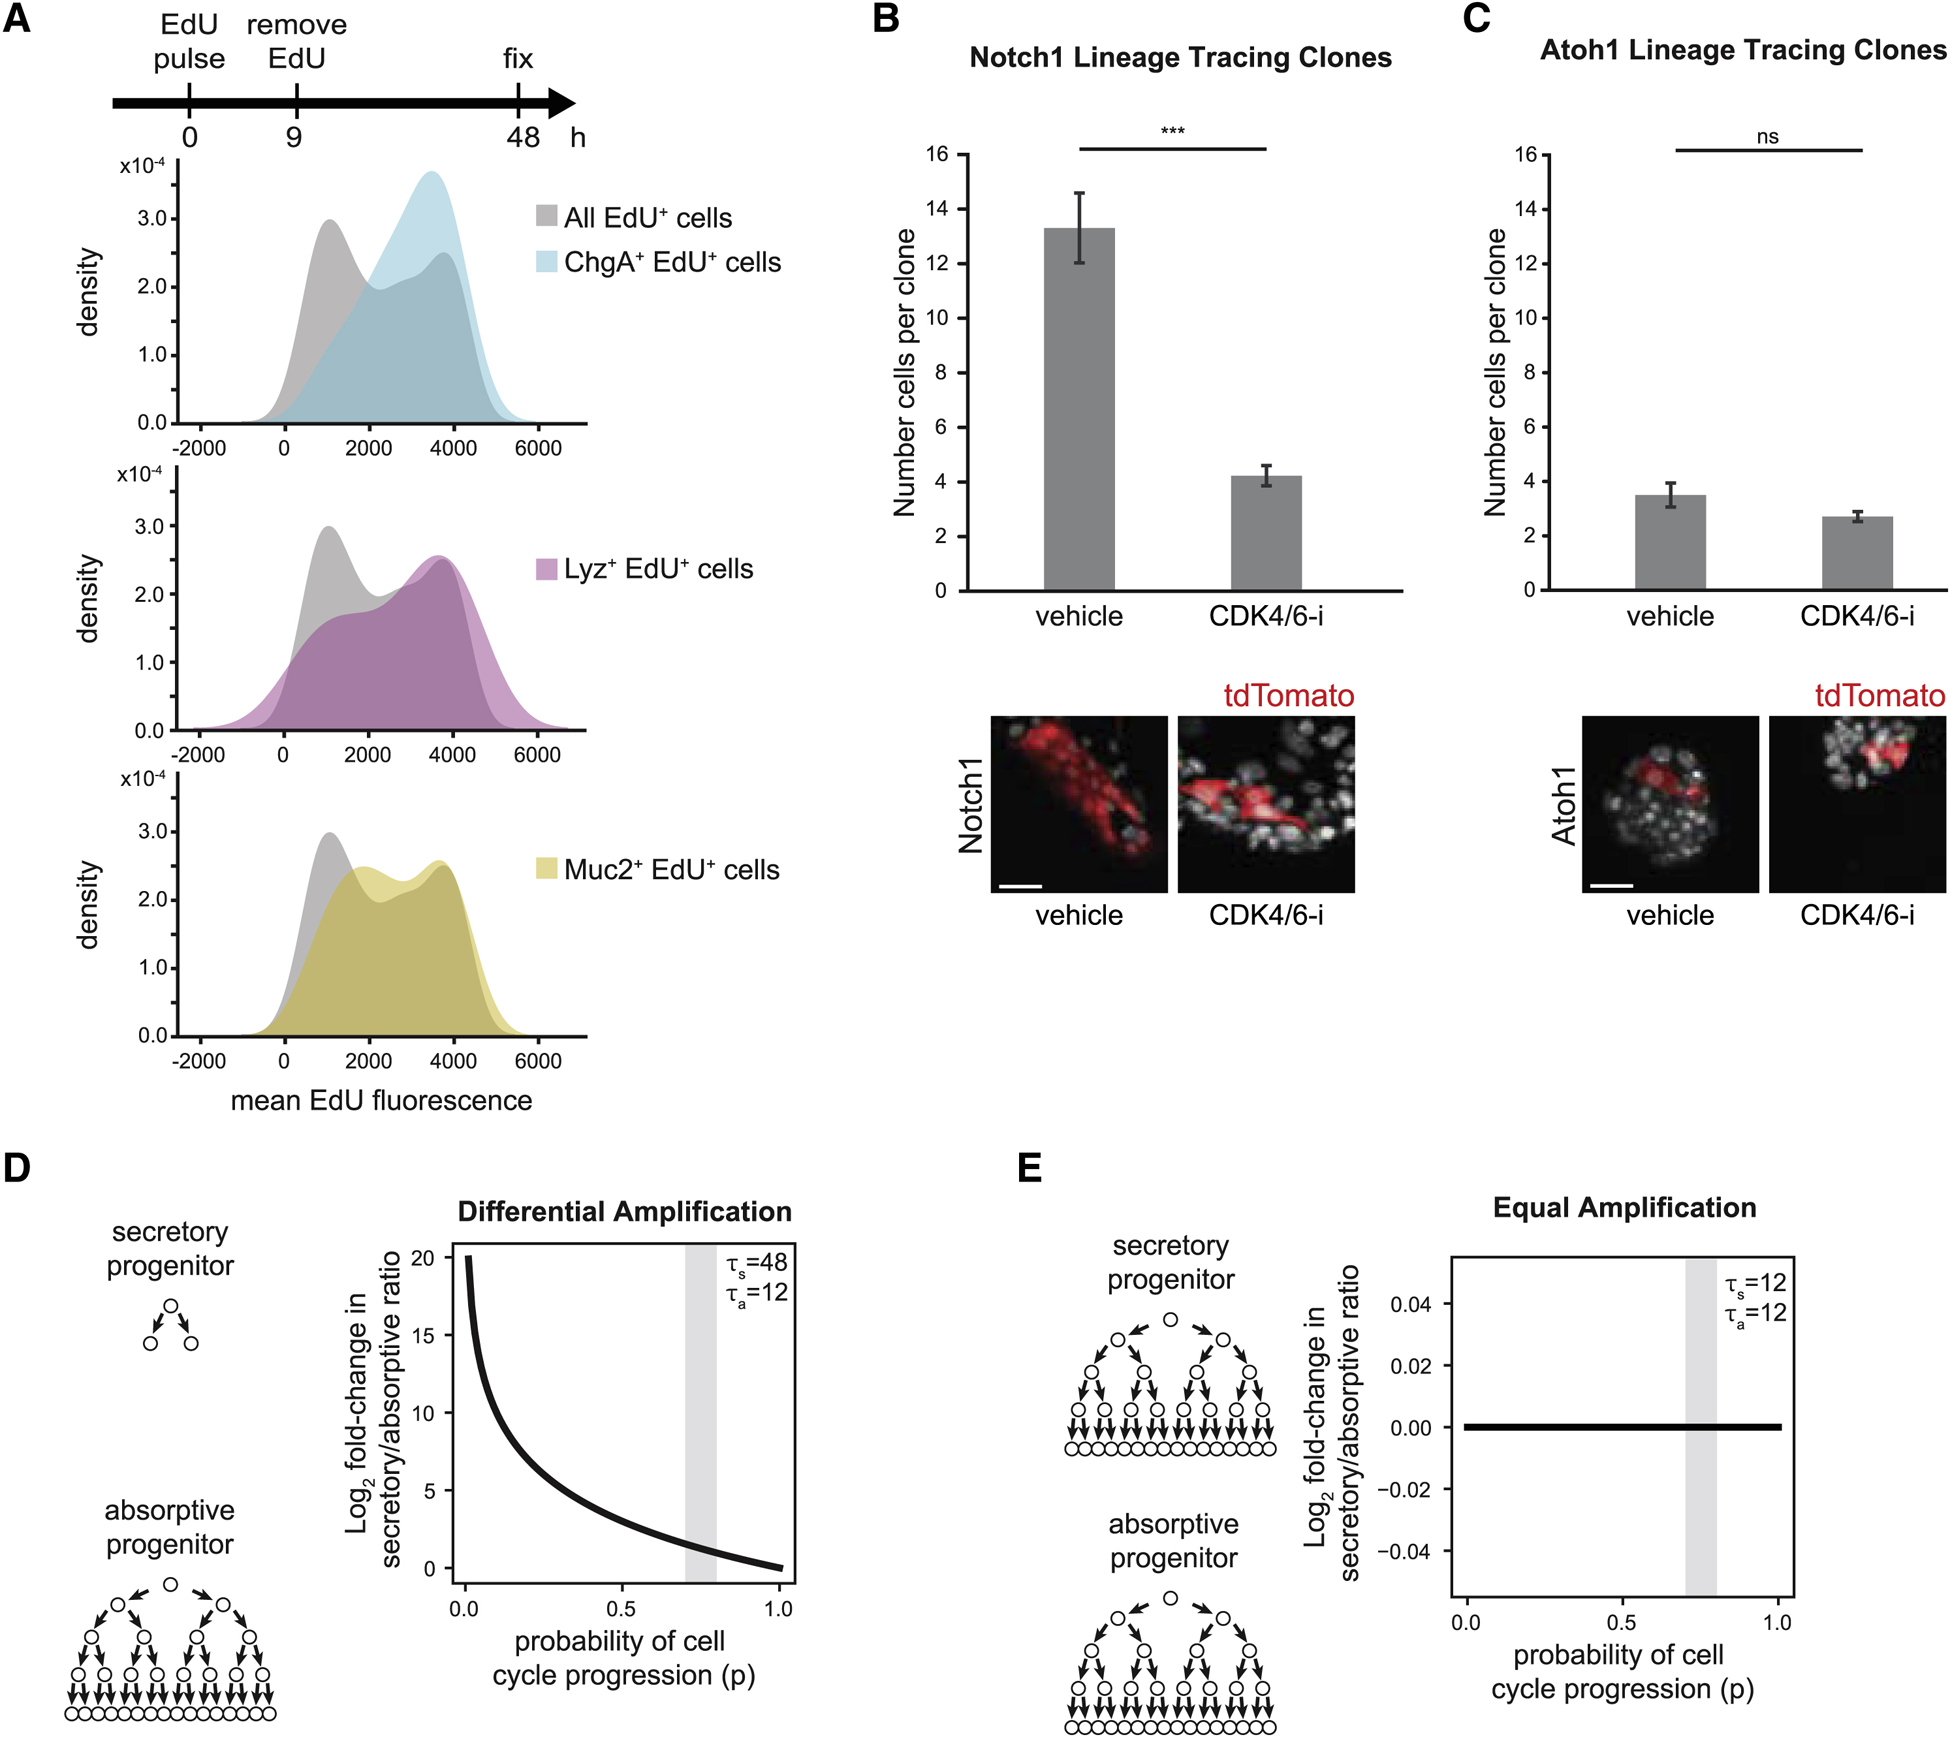
Renewing tissues have the remarkable ability to continually produce both proliferative progenitor and specialized differentiated cell types. How are complex milieus of microenvironmental signals interpreted to coordinate tissue-cell-type composition? Here, we investigate the responses of intestinal epithelium to individual and paired perturbations across eight epithelial signaling pathways. Using a high-throughput approach that combines enteroid monolayers and quantitative imaging, we identified conditions that enrich for specific cell types as well as interactions between pathways. Importantly, we found that modulation of transit-amplifying cell proliferation changes the ratio of differentiated secretory to absorptive cell types. These observations highlight an underappreciated role for transit-amplifying cells in the tuning of differentiated cell-type composition.

Keywords: cell-type composition; high-throughput platform; intestinal epithelium; lineage model; organoid; systems biology.


Conflict of interest statement

Declaration of Interests The authors declare no competing interests.

Figures

Figure 1.
Figure 1.. Enteroid monolayers provide a model for renewing intestinal epithelium.
(A) Top: Schema for EdU pulse chase. Bottom: Quantification of %EdU+ cells in tissue at different time points. n=3 wells. Error bars mean +/− SEM. (B) Top: Schema for EdU pulse chase. Bottom: Representative images show co-localization between EdU and secretory cell type markers (Lyz; Paneth, Muc2; goblet, and ChgA; EE). Arrowheads indicate cells that co-stain for EdU and the indicated cell type marker. Scale bars 5μm.
Figure 2.
Figure 2.. Systematic characterization of perturbation effects on intestinal epithelial cell type composition reveals cell type-specific regulators.
(A) Schema for characterization of perturbation effects on cell type composition within enteroid monolayers. (B) Heatmaps of single (left) and pairwise (right) perturbation effects to enteroid monolayers. Top: Perturbation effects are represented as log2 fold-change (fc) relative to vehicle-treated wells. Bottom: Matrix of used perturbations. Single perturbations are sorted by #EdU+ stem cells; pairwise perturbations are clustered based on similarity of tissue-wide effects. Callouts (1) and (2) at bottom are referred to in text. n=28 (controls), 6–8 (single perturbations), or 2 (pairwise perturbations) wells. (C-D) Co-treatment of 3D organoids with GSK3-i + JAK1/2-i enriches for Lgr5+ stem cells. (C) Representative IF images of Lgr5-GFP-DTR 3D organoids show an increased proportion of cells expressing Lgr5 in GSK3-i + JAK1/2-i co-treatment (48 hours). Scale bar 15μm. (D) Lgr5 RNA levels measured by qRT-PCR are increased in 3D organoids co-treated with GSK3-i + JAK1/2-i for 48 hours. n=3 wells. Error bars mean +/− SEM. (E-F) Co-treatment of 3D organoids with TGF-β + PORCN-i enriches for enteroendocrine (EE) cells. (E) Representative IF images of 3D organoids show increased EE (ChgA+) cell numbers with TGF-β + PORCN-i co-treatment (24 hours). Scale bar 5μm. (F) qRT-PCR analysis of EE (ChgA) RNA relative to secretory (ChgA+Muc2+Lyz) RNA levels in 3D organoids treated with TGF-β + PORCN-i for 48 hours. n=3 wells. Error bars mean+/− SEM. ** indicates p-values < 0.01
Figure 3.
Figure 3.. Interaction mapping reveals mutual antagonism between EGFR-i and IL-4 on TA cell numbers.
(A) Example images (top) and quantification of TA cell numbers (bottom) in enteroid monolayers treated as indicated for 48 hours. Co-treatment of IL-4 + EGFR-i strongly deviates from the multiplicative model of perturbation interaction (dashed line; effect size>5, p < 0.0001). Error bars mean +/− SEM. n=28 (vehicle), 6 (EGFR-i), 8 (IL-4), or 2 (IL-4 + EGFR-i) wells. Scale bar 10 μm. (B) Example images of phospho-Erk staining in enteroid monolayers treated as indicated for 48 hours. Nuclear phospho-Erk is observed in all conditions except EGFR-i alone. Red arrows: example cells with nuclear phospho-Erk. Scale bar 7.5 μm. (C) Enteroid monolayers were treated as indicated and BMP2 RNA levels were measured by qRT-PCR. Error bars mean +/− SEM. n=3 (vehicle 24h), 3 (IL-4 24h), 3 (vehicle 48h), or 2 (IL-4 48h) wells. (D) Enteroid monolayers were treated as indicated for 48 hours and levels of BMP2 in the media were measured by ELISA (EGFR-i+IL-4 vs control: ns). n=2 wells. Error bars mean +/− SEM. ** indicates p-values < 0.01; *** indicates p-values < 0.001; ns: not significant
Figure 4.
Figure 4.. Inhibiting proliferation increases secretory cell prevalence in enteroid monolayers, in 3D organoids, and in vivo.
(A) Numbers of TA cells, but not EdU+ stem cells, correlate with secretory cell fractions. Perturbation effects (log2fc) are plotted pairwise for each feature. r: correlation coefficient (r). Diff.: #EdU cells (Methods). (B) The TA to secretory cell correlation is not driven by a specific perturbation. Each of 13 perturbations was sequentially dropped from the dataset and correlation coefficients (r value) were calculated. Error bars mean +/− SD. (C) Inhibiting cell cycle progression increases secretory cell fractions. Enteroid monolayers were treated as indicated for 48 hours, after which #TA cells and #secretory/#absorptive cells were quantified. n = 3 wells. Error bars mean +/− SEM. (D) Impairing proliferation increases the secretory to absorptive (Atoh1:Hes1) ratio in vivo. Mice were treated with CDK4/6-i (palbociclib) or vehicle every 24 hours for 48 hours. At 50 hours, intestinal crypts were harvested and gene expression was measured by qRT-PCR. n=8 mice/group. Error bars mean +/− SEM. (E) TA cells alter secretory fractions in response to cell cycle inhibitors. 3D organoids were enriched for stem (GSK3-i + HDAC-i) or TA (PORCN-i) cells then treated with a CDK4/6 inhibitor (palbociclib) for 48 hours. The secretory to absorptive (Atoh1:Hes1) ratio was measured by qRT-PCR. n = 3 wells. Scale bars 10μm. Error bars mean +/− SEM. ** indicates p-values < 0.01; *** indicates p-values < 0.001
Figure 5.
Figure 5.. Differential amplification of secretory progenitors connects proliferation with differentiated cell type composition.
(A) Secretory progenitors divide fewer times than other progenitors. Top: Enteroids were pulsed with EdU (0–9 hours) then fixed and stained (at 48 hours). Mean EdU signal intensity was quantified in all EdU+ cells and in EdU+ cells that also stained positive for markers of Paneth (Lyz), goblet (Muc2) and EE (ChgA) cells. Distribution of EdU intensities is represented as a kernel density plot. Cells with higher EdU intensity divided fewer times than those with lower EdU. (B-C) Enteroid monolayers were derived from (B) Notch1-CreER;R26R-tdTomato mice or (C) Atoh1-CreER;R26R-tdTomato mice. 4-hydroxytamoxifen was added to cultures for 24 hours, followed by 48 hours of vehicle or CDK4/6-i (palbociclib). CDK4/6-i reduced the average number of cells in absorptive (Notch1) clones but had little effect on the average number of cells in secretory (Atoh1) clones. Representative images of clones under vehicle or CDK4/6-i treatment are shown. Error bars mean +/− SEM. n= 78 (Notch1 vehicle), 74 (Notch1 CDK4/6-i), 30 (Atoh1 vehicle), or 38 (Atoh1 CDK4/6-i) clones. Scale bar 50 μm. (D-E) Model output of secretory to absorptive differentiated cell ratio as a function of probability of cell cycling (p). Gray bands indicate experimentally observed range for parameter p. (D) Secretory progenitors divide fewer times than absorptive progenitors (τs=48 hours, τa=12 hours). Inhibiting the cell cycle (increasing p) increases the secretory to absorptive ratio. (E) Secretory progenitors divide the same number of times as absorptive progenitors (τs, τa=12 hours). Inhibiting the cell cycle (increasing p) does not change the secretory to absorptive ratio. *** indicates p-values < 0.001; ns: not significant

References

    1. Balázsi G, van Oudenaarden A, and Collins JJ (2011). Cellular decision making and biological noise: from microbes to mammals. Cell 144, 910–925. - PMC - PubMed
    1. Basak O, Beumer J, Wiebrands K, Seno H, van Oudenaarden A, and Clevers H (2017). Induced Quiescence of Lgr5+ Stem Cells in Intestinal Organoids Enables Differentiation of Hormone-Producing Enteroendocrine Cells. Cell Stem Cell 20, 177–190.e4. - PubMed
    1. Batlle E, Henderson JT, Beghtel H, van den Born MMW, Sancho E, Huls G, Meeldijk J, Robertson J, van de Wetering M, Pawson T, et al. (2002). Beta-catenin and TCF mediate cell positioning in the intestinal epithelium by controlling the expression of EphB/ephrinB. Cell 111, 251–263. - PubMed
    1. Beumer J, and Clevers H (2016). Regulation and plasticity of intestinal stem cells during homeostasis and regeneration. Development 143, 3639–3649. - PubMed
    1. Beumer J, and Clevers H (2020). Cell fate specification and differentiation in the adult mammalian intestine. Nat. Rev. Mol. Cell Biol - PubMed

Publication types